

Test, trace, isolate: evidence for declining SARS-CoV-2 PCR sensitivity in a clinical cohort
- PMID: 34161880
- PMCID: PMC8059257
- DOI: 10.1016/j.diagmicrobio.2021.115392
Test, trace, isolate: evidence for declining SARS-CoV-2 PCR sensitivity in a clinical cohort
Abstract
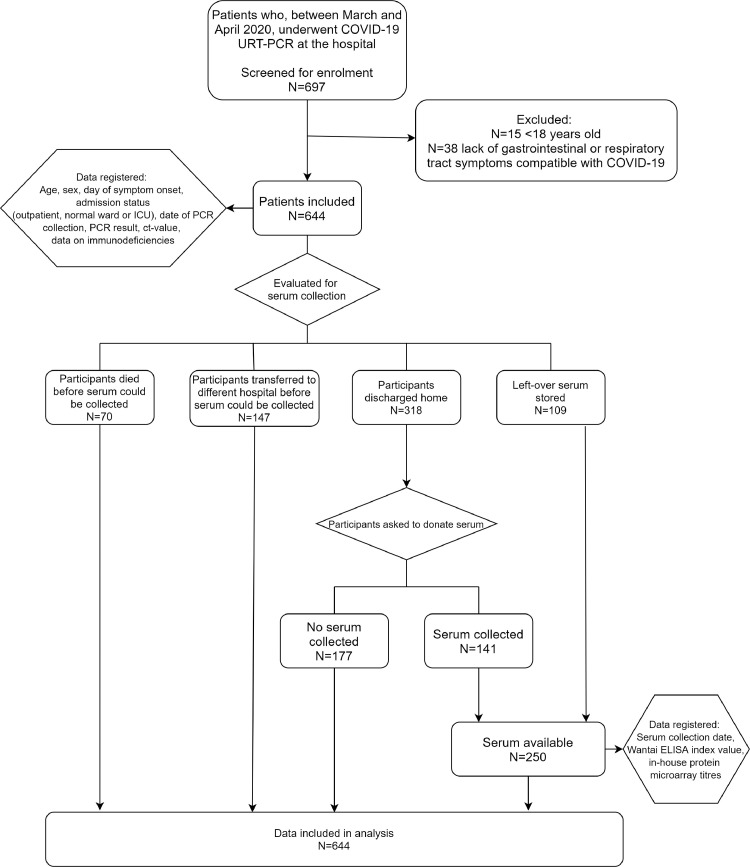
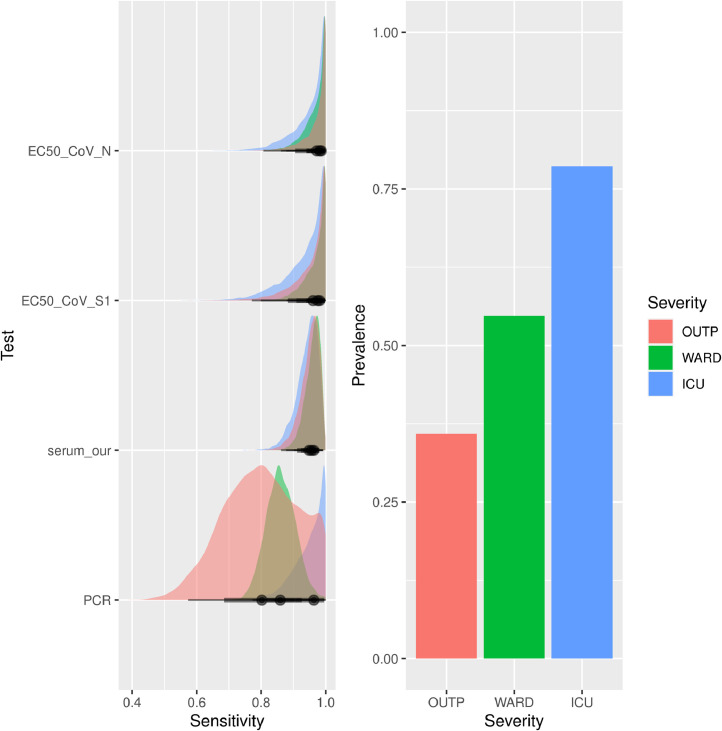
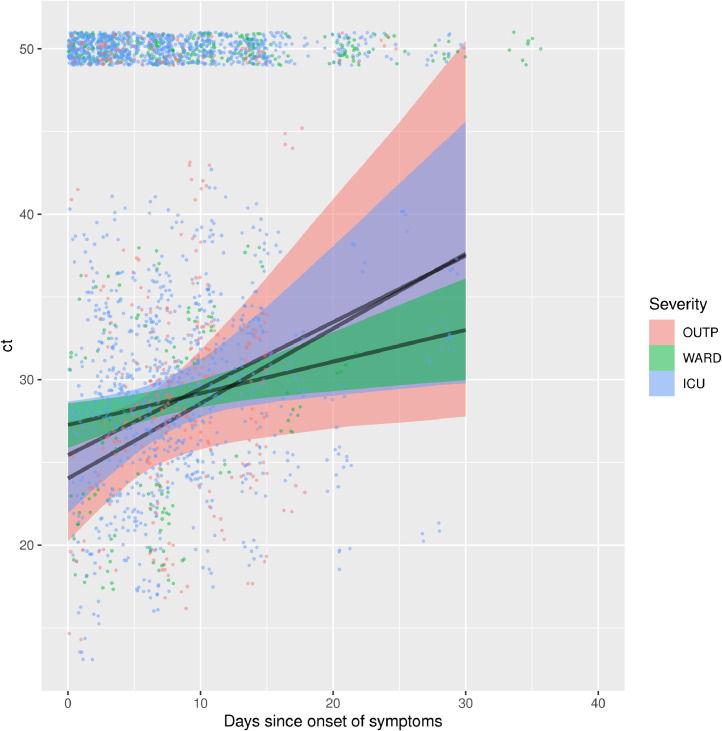
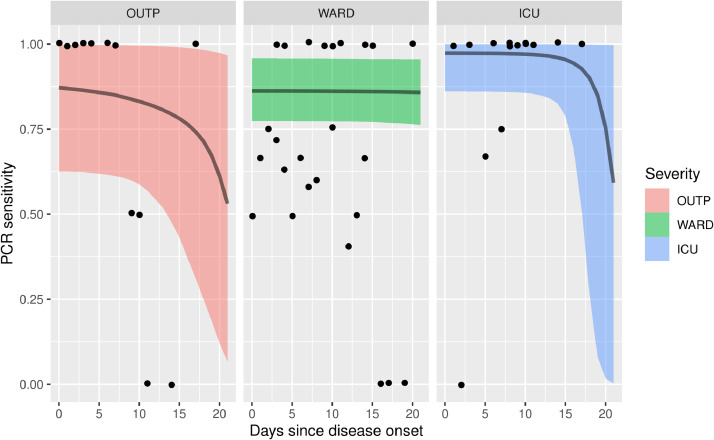
Real-time reverse transcription-polymerase chain reaction (RT-PCR) on upper respiratory tract (URT) samples is the primary method to diagnose SARS-CoV-2 infections and guide public health measures, with a supportive role for serology. We reinforce previous findings on limited sensitivity of PCR testing, and solidify this fact by statistically utilizing a firm basis of multiple tests per individual. We integrate stratifications with respect to several patient characteristics such as severity of disease and time since onset of symptoms. Bayesian statistical modelling was used to retrospectively determine the sensitivity of RT-PCR using SARS-CoV-2 serology in 644 COVID-19-suspected patients with varying degrees of disease severity and duration. The sensitivity of RT-PCR ranged between 80% - 95%; increasing with disease severity, it decreased rapidly over time in mild COVID-19 cases. Negative URT RT-PCR results should be interpreted in the context of clinical characteristics, especially with regard to containment of viral transmission based on 'test, trace and isolate'. Keywords: SARS-CoV-2, RT-PCR, serology, sensitivity, public health.
Keywords: RT-PCR; SARS-CoV-2; public health; sensitivity; serology.
Copyright © 2021 The Authors. Published by Elsevier Inc. All rights reserved.
Figures
Similar articles
-
Rapid SARS-CoV-2 antigen detection assay in comparison with real-time RT-PCR assay for laboratory diagnosis of COVID-19 in Thailand.Virol J. 2020 Nov 13;17(1):177. doi: 10.1186/s12985-020-01452-5. Virol J. 2020. PMID: 33187528 Free PMC article.
-
Universal screening for SARS-CoV-2 infection: a rapid review.Cochrane Database Syst Rev. 2020 Sep 15;9(9):CD013718. doi: 10.1002/14651858.CD013718. Cochrane Database Syst Rev. 2020. PMID: 33502003 Free PMC article.
-
Comparative evaluation of RT-PCR and antigen-based rapid diagnostic tests (Ag-RDTs) for SARS-CoV-2 detection: performance, variant specificity, and clinical implications.Microbiol Spectr. 2024 Jun 4;12(6):e0007324. doi: 10.1128/spectrum.00073-24. Epub 2024 Apr 29. Microbiol Spectr. 2024. PMID: 38683014 Free PMC article.
-
SARS-CoV-2 seroprevalence and transmission risk factors among high-risk close contacts: a retrospective cohort study.Lancet Infect Dis. 2021 Mar;21(3):333-343. doi: 10.1016/S1473-3099(20)30833-1. Epub 2020 Nov 2. Lancet Infect Dis. 2021. PMID: 33152271 Free PMC article.
-
Diagnostic Accuracy Estimates for COVID-19 Real-Time Polymerase Chain Reaction and Lateral Flow Immunoassay Tests With Bayesian Latent-Class Models.Am J Epidemiol. 2021 Aug 1;190(8):1689-1695. doi: 10.1093/aje/kwab093. Am J Epidemiol. 2021. PMID: 33823529 Free PMC article. Review.
Cited by
-
Management of COVID-19 Patients in the Emergency Department.J Pers Med. 2021 Sep 27;11(10):961. doi: 10.3390/jpm11100961. J Pers Med. 2021. PMID: 34683102 Free PMC article. Review.
-
SARS-CoV-2 transmitters have more than three times higher viral loads than non-transmitters - Practical use of viral load for disease control.J Clin Virol. 2022 Jun;150-151:105131. doi: 10.1016/j.jcv.2022.105131. Epub 2022 Mar 14. J Clin Virol. 2022. PMID: 35395500 Free PMC article.
-
External quality assessment of molecular detection and variant typing of SARS-CoV-2 in European expert laboratories in 2023.J Clin Microbiol. 2025 Apr 9;63(4):e0153824. doi: 10.1128/jcm.01538-24. Epub 2025 Mar 14. J Clin Microbiol. 2025. PMID: 40084838 Free PMC article.
-
Recent findings and applications of biomedical engineering for COVID-19 diagnosis: a critical review.Bioengineered. 2021 Dec;12(1):8594-8613. doi: 10.1080/21655979.2021.1987821. Bioengineered. 2021. PMID: 34607509 Free PMC article. Review.
-
Testing for SARS-CoV-2: lessons learned and current use cases.Clin Microbiol Rev. 2024 Jun 13;37(2):e0007223. doi: 10.1128/cmr.00072-23. Epub 2024 Mar 15. Clin Microbiol Rev. 2024. PMID: 38488364 Free PMC article. Review.
References
-
- Chen Y, Chen L, Deng Q, Zhang G, Wu K, Ni L, et al. The presence of SARS-CoV-2 RNA in the feces of COVID-19 patients. J Med Virol. 2020;92(7):833–840. - PubMed
MeSH terms
LinkOut - more resources
Full Text Sources
Medical
Miscellaneous
