. 2021 Jun 23;40(1):206.
doi: 10.1186/s13046-021-02012-7.

Metformin induces Ferroptosis by inhibiting UFMylation of SLC7A11 in breast cancer

Affiliations

Metformin induces Ferroptosis by inhibiting UFMylation of SLC7A11 in breast cancer

Jingjing Yang et al. J Exp Clin Cancer Res. .

Abstract

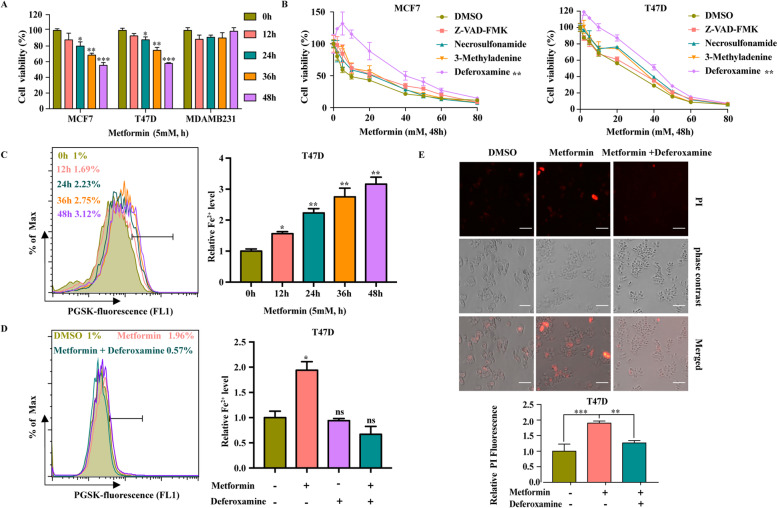
Background: Ferroptosis is a newly defined form of regulated cell death characterized by the iron-dependent accumulation of lipid peroxidation and is involved in various pathophysiological conditions, including cancer. Targeting ferroptosis is considered to be a novel anti-cancer strategy. The identification of FDA-approved drugs as ferroptosis inducers is proposed to be a new promising approach for cancer treatment. Despite a growing body of evidence indicating the potential efficacy of the anti-diabetic metformin as an anti-cancer agent, the exact mechanism underlying this efficacy has not yet been fully elucidated.

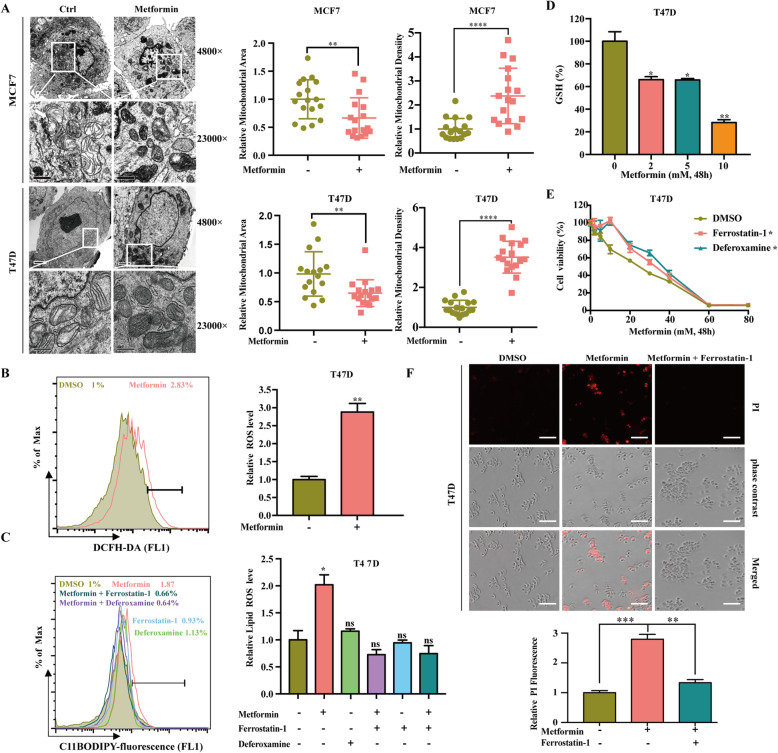
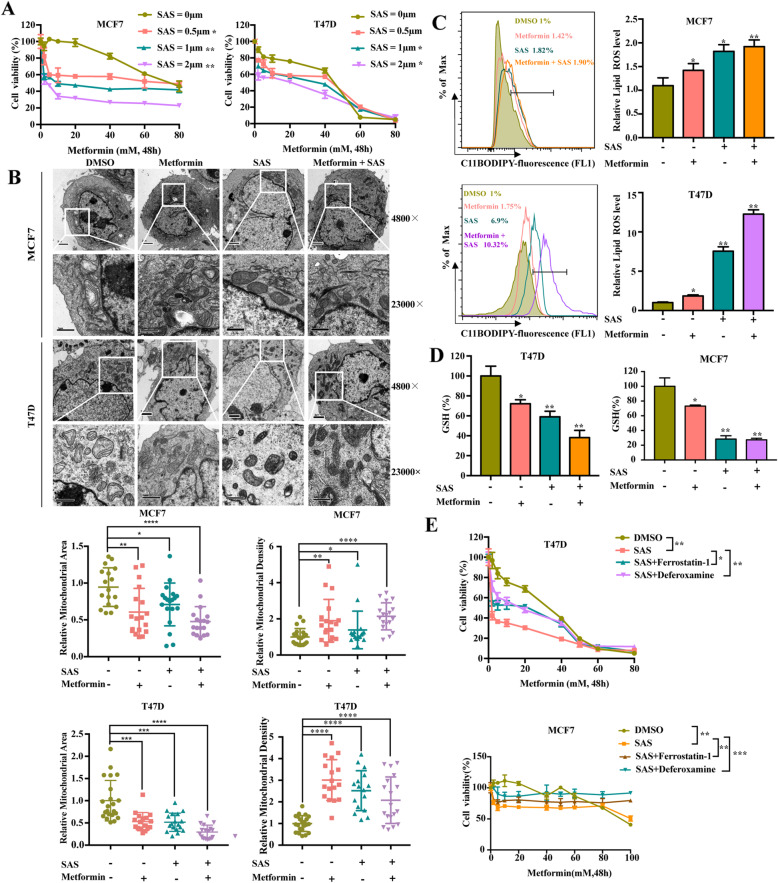
Methods: The UFMylation of SLC7A11 is detected by immunoprecipitation and the expression of UFM1 and SLC7A11 in tumor tissues was detected by immunohistochemical staining. The level of ferroptosis is determined by the level of free iron, total/lipid Ros and GSH in the cells and the morphological changes of mitochondria are observed by transmission electron microscope. The mechanism in vivo was verified by in situ implantation tumor model in nude mice.

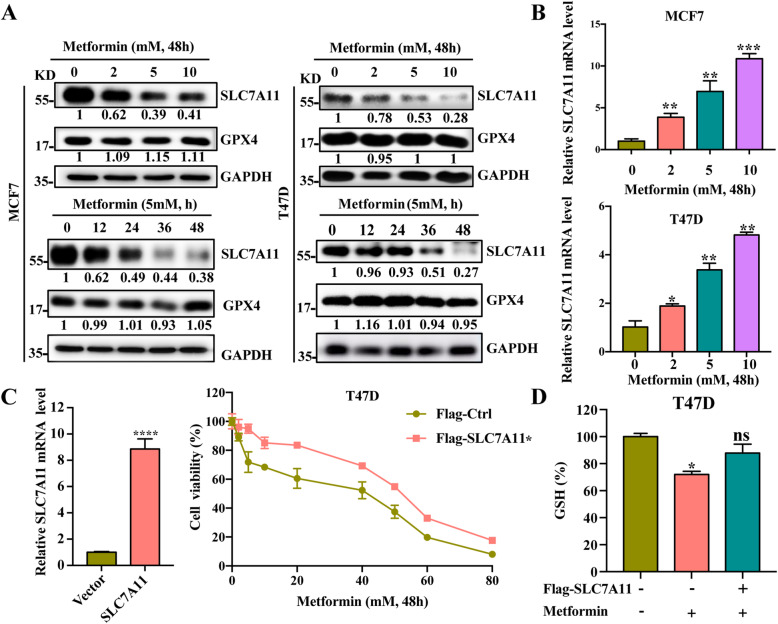
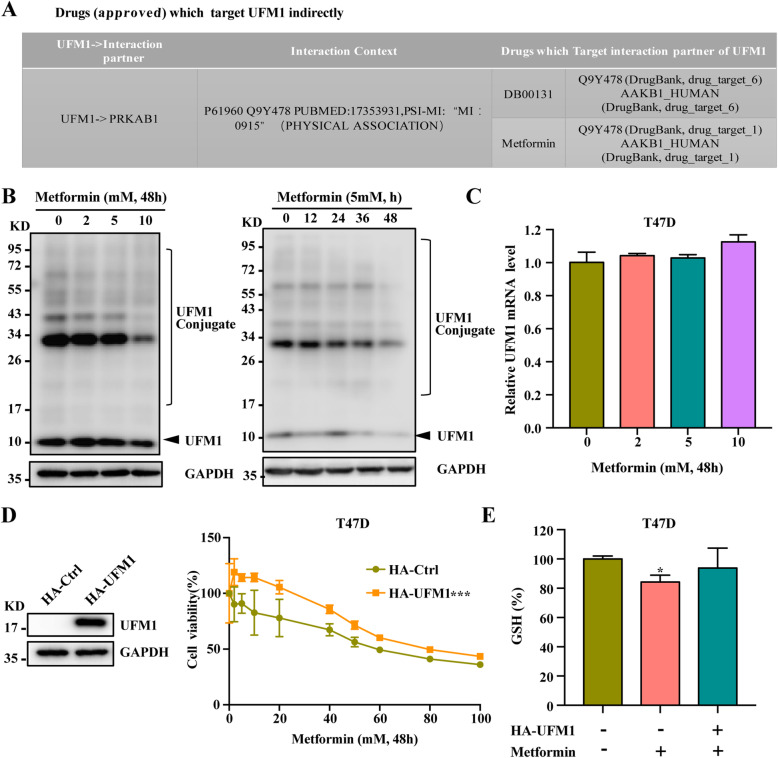
Results: Metformin induces ferroptosis in an AMPK-independent manner to suppress tumor growth. Mechanistically, we demonstrate that metformin increases the intracellular Fe2+ and lipid ROS levels. Specifically, metformin reduces the protein stability of SLC7A11, which is a critical ferroptosis regulator, by inhibiting its UFMylation process. Furthermore, metformin combined with sulfasalazine, the system xc- inhibitor, can work in a synergistic manner to induce ferroptosis and inhibit the proliferation of breast cancer cells.

Conclusions: This study is the first to demonstrate that the ability of metformin to induce ferroptosis may be a novel mechanism underlying its anti-cancer effect. In addition, we identified SLC7A11 as a new UFMylation substrate and found that targeting the UFM1/SLC7A11 pathway could be a promising cancer treatment strategy.

Keywords: Breast cancer; Ferroptosis; Metformin; SLC7A11; UFMylation.


Conflict of interest statement

The authors declare that they have no competing interests.

Figures

Fig. 1
Fig. 1
Metformin-Induced Cell Death can be Inhibited by DFO. A Breast cancer lines were treated with metformin (5 mM) for 0, 12, 24, 36, or 48 h, and cell viability was assayed. B MCF7 and T47D cells were treated with metformin (0–80 mM) in the absence or presence of Z-VAD-FMK (20 μM), necrosulfonamide (1 μM), 3-Methyladenine (5 mM) or Deferoxamine (20 μM) for 48 h, and cell viability was assayed. C T47D cells were treated with metformin (5 mM) for 0, 12, 24, 36, or 48 h, and the relative levels of Fe2+ were assayed. D T47D cells were treated with metformin (5 mM) for 48 h in the absence or presence of Deferoxamine. The relative levels of Fe2+ were assayed. E T47D cells were treated with metformin (5 mM) for 48 h in the absence or presence of Deferoxamine. Microscopy showing cell death. Propidium iodide (PI) staining indicates dead cells (scale bar, 100 mM). Quantitative analysis of cell death was measured by PI staining coupled with flow cytometry
Fig. 2
Fig. 2
Metformin can Trigger ferroptosis. A Cell morphology was observed via transmission electron microscopy after cells were treated with metformin (5 mM) for 48 h. The area and density of mitochondrial is quantitative analysis by using the ImageJ software. B T47D cells were treated with metformin (5 mM) for 48 h. The relative total ROS levels were assayed via DCFH-DA fluorescence. C T47D cells were treated with metformin (5 mM) for 48 h in the absence or presence of Ferrostatin-1 (1 μM) and Deferoxamine (20 μM) for 48 h. The relative lipid ROS levels were assayed via C11-BODIPY fluorescence. D T47D cells were treated with metformin at 0, 2, 5, or 10 mM for 48 h, and the relative levels of GSH were assayed. E T47D cells were treated with metformin (0–80 mM) for 48 h in the absence or presence of Ferrostatin-1 (1 μM) and Deferoxamine (20 μM) for 48 h. Cell viability was assayed. F T47D cells were treated with metformin (5 mM) for 48 h in the absence or presence of Ferrostatin-1 (1 μM) for 48 h. Microscopy showing cell death. Propidium iodide (PI) staining indicates dead cells (scale bar, 100 mM). Quantitative analysis of cell death was measured by PI staining coupled with flow cytometry
Fig. 3
Fig. 3
Metformin causes System Xc dysfunction. A MCF7 and T47D cells were treated with metformin at 0, 2, 5, or 10 mM for 48 h or treated with metformin (5 mM) for 0, 12, 24, 36, or 48 h. SLC7A11 and GPX4 protein expression was measured via Western blotting. B The relative SLC7A11 RNA level was measured via qRT-PCR after MCF7 and T47D cells were treated with metformin at 0, 2, 5, or 10 mM for 48 h. C T47D cells were treated with metformin (0–80 mM) for 48 h with or without the overexpression of SLC7A11. Cell viability was assayed. D T47D cells were treated with 5 mM metformin for 48 h with or without the overexpression of SLC7A11. The relative levels of GSH were assayed
Fig. 4
Fig. 4
Metformin can regulate UFM1 expression. A DRUGSURV database (http://www.bioprofiling.de/GEO/DRUGSURV/) analysis showing that UFM1 is an indirect target of metformin. B T47D cells were treated with metformin at 0, 2, 5, or10 mM for 48 h or treated with metformin (5 mM) for 0, 12, 24, 36, or 48 h. The UFM1-conjugated proteins were measured via Western blotting. C The relative UFM1 RNA level was measured via qRT-PCR after T47D cells were treated with metformin at 0, 2, 5, or 10 mM for 48 h. D T47D cells were treated with Metformin (0–80 mM) for 48 h with or without the overexpression of UFM1. Cell viability was assayed. E T47D cells were treated with 5 mM metformin for 48 h with or without overexpression of UFM1. The relative levels of GSH were assayed
Fig. 5
Fig. 5
Metformin downregulated SLC7A11 expression by inhibiting UFMylation of SLC7A11. A UFM1 and SLC7A11 expression in breast cancer cell lines was detected via Western blotting. Scatter plots showing positive correlation of UFM1 and SLC7A11 expression in different cancer types. B TCGA database analyse the effect of UFM1 or SLC7A11 on survival. C After knockdown of UFM1 with siRNA, the relative SLC7A11 protein and RNA expression levels were measured via Western blotting and qRT-PCR. D The protein level of SLC7A11 in breast cancer cell lines was detected by Western blotting after cells were treated with cycloheximide (CHX, 100 μg/ml) after knockdown of UFM1. E After siRNA-mediated knockdown of UFM1, SLC7A11 UFMylation was measured via Co-IP. F SLC7A11 UFMylation was measured via Co-IP in the absence or presence of UfSP2. G SLC7A11 UFMylation was measured via Co-IP in the absence or presence of metformin
Fig. 6
Fig. 6
Metformin can induce ferroptosis independent of the AMPK pathway. A T47D cells were treated with metformin (5 mM) for 48 h in the absence or presence of Comp C (1 μM) for 48 h. Protein expression was measured via Western blotting. B T47D cells were treated with metformin (5 mM) for 48 h in the absence or presence of Comp C (1 μM) for 48 h, and the relative GSH levels were assayed. C and D T47D cells were treated with metformin (5 mM) for 48 h in the absence or presence of Comp C (1 μM) for 48 h. The relative lipid ROS and Fe2+ levels were assayed via C11-BODIPY and PSGK fluorescence, respectively. E T47D cells were treated with AICAR (2 mM) for 48 h, and protein expression was measured via Western blotting. F T47D cells were treated with AICAR (2 mM) for 48 h. The relative lipid ROS levels were assayed via C11-BODIPY fluorescence
Fig. 7
Fig. 7
The synergistic effect of SAS and Metformin can effectively inhibit breast cancer. A T47D and MCF7 cells were treated with metformin (0–80 mM) in the absence or presence of sulfasalazine for 48 h. Cell viability was assayed. B Cell morphology was observed via transmission electron microscopy after cells were treated with metformin (5 mM) in the absence or presence of sulfasalazine for 48 h. The area and density of mitochondrial is quantitative analysis by using the ImageJ software. C T47D cells were treated with metformin (5 mM) in the absence or presence of sulfasalazine for 48 h. The relative lipid ROS levels were assayed using C11-BODIPY fluorescence. D T47D and MCF7 cells were treated with metformin (5 mM) in the absence or presence of sulfasalazine for 48 h. The relative levels of GSH were assayed. E T47D and MCF7 cells were treated with metformin and sulfasalazine in the absence or presence of ferrostatin-1 (1 μM) and Deferoxamine (20 μM) for 48 h. Cell viability was assayed
Fig. 8
Fig. 8
Sulfasalazine synergistically enhances the anti-cancer activity of Metformin in vivo. A Athymic nude mice were orthotopically injected with T47D cells and treated with metformin (200 mg/kg, three weeks) daily in drinking water with or without sulfasalazine administration via intraperitoneal injection until the end of the experiment. Tumor volumes are shown relative to the initial volume measured before treatment (n = 5 mice/group). B Representative isolated tumor images from each treatment group at day 21 after treatment are shown. C Representative images of immunohistochemical staining (SLC7A11, UFM1 and 4-HNE) of T47D cell-derived xenograft tumors with the indicated treatments. The box graphs show the quantification of IHC staining. Chi-square test was used for statistical analysis. D Schematic diagram showing metformin regulation of ferroptosis. SLC7A11 can be modified by UFM1; metformin exerts its anti-cancer effect by inhibiting UFMylation of SLC7A11 leading to ferroptosis in an AMPK-independent manner

References

    1. Pernicova I, Korbonits M. Metformin-mode of action and clinical implications for diabetes and cancer. Nat Rev Endocrinol. 2014;10(3):143–156. doi: 10.1038/nrendo.2013.256. - DOI - PubMed
    1. Barzilai N, Crandall JP, Kritchevsky SB, Espeland MA. Metformin as a tool to target aging. Cell Metab. 2016;23(6):1060–1065. doi: 10.1016/j.cmet.2016.05.011. - DOI - PMC - PubMed
    1. Soberanes S, Misharin AV, Jairaman A, Morales-Nebreda L, McQuattie-Pimentel AC, Cho T, et al. Metformin targets mitochondrial electron transport to reduce air-pollution-induced thrombosis. Cell Metabol. 2019;29(2):335–347.e5. doi: 10.1016/j.cmet.2018.09.019. - DOI - PMC - PubMed
    1. Zhang CS, Li M, Ma T, Zong Y, Cui J, Feng JW, Wu YQ, Lin SY, Lin SC. Metformin activates AMPK through the lysosomal pathway. Cell Metab. 2016;24(4):521–522. doi: 10.1016/j.cmet.2016.09.003. - DOI - PubMed
    1. Stynen B, Abd-Rabbo D, Kowarzyk J, Miller-Fleming L, Aulakh SK, Garneau P, Ralser M, Michnick SW. Changes of cell biochemical states are revealed in protein homomeric complex dynamics. Cell. 2018;175(5):1418–1429. doi: 10.1016/j.cell.2018.09.050. - DOI - PMC - PubMed

MeSH terms