. 2021 Jun 23;7(26):eabg3505.
doi: 10.1126/sciadv.abg3505. Print 2021 Jun.

Lactate and IL6 define separable paths of inflammatory metabolic adaptation

Affiliations

Lactate and IL6 define separable paths of inflammatory metabolic adaptation

Stefanie Dichtl et al. Sci Adv. .

Abstract

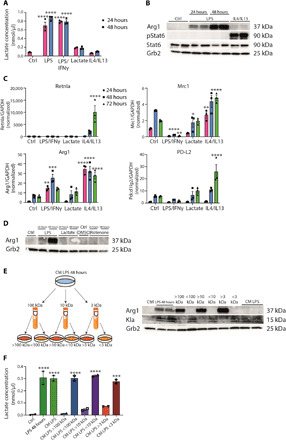
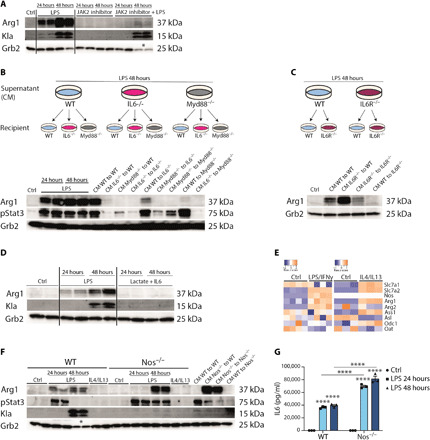
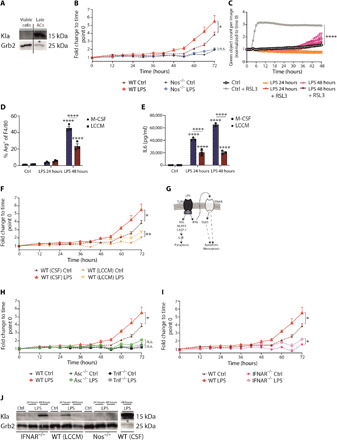
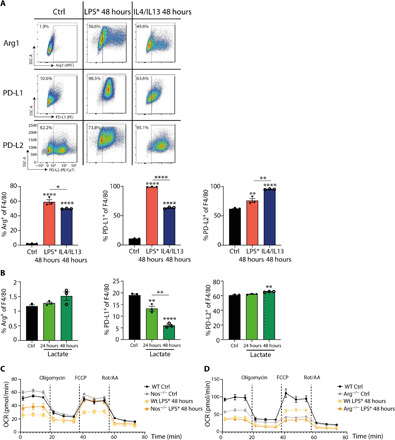
Lactate is an end point of Warburg-type metabolism found in inflammatory macrophages. Recently, lactate was shown to modify histones of lipopolysaccharide (LPS)-activated macrophages in a time-dependent way and promote the expression of genes linked to tissue repair, including arginase-1 (Arg1). We tested the interrelationships between histone lactylation (Kla) and tissue reparative gene expression and found that Kla was uncoupled from changes in gene expression linked to resolving M2 macrophage activation but correlated with Arg1 expression. LPS-induced Arg1 was instead dependent on autocrine-paracrine interleukin-6 (IL6) production, the IL6 receptor, and Stat3 signal transduction. We found that Kla increases as macrophages prepare to die under inflammatory stress, and Kla was absent in macrophages that cannot generate reactive nitrogen or have defects in diverse macrophage death pathways. Thus, Kla is a consequence rather than a cause of macrophage activation but occurs coincidently with an IL6- and Arg1-dependent metabolic rewiring under inflammatory duress.


Figures

Fig. 1
Fig. 1. Inflammation-associated lactate and M2-like gene expression are biochemically uncoupled.
(A) Intracellular lactate concentration was determined in wild-type BMDMs left untreated (Ctrl), and LPS/IFNγ-, LPS-, lactate-, or IL4/IL13-treated for 24 or 48 hours. Data shown are representative of three independent experiments. (B) BMDMs, which were treated with solvent (Ctrl), LPS, or IL4/IL13, were used to isolate whole-cell lysates and analyzed by Western blotting for the indicated proteins. (C) RNA from wild-type BMDMs left untreated (Ctrl), stimulated with LPS/IFNγ, lactate, or IL4/IL13 was used for quantitative reverse transcription polymerase chain reaction. Data shown are the mean fold increase of the 24-hour Ctrl group. GAPDH, glyceraldehyde-3-phosphate dehydrogenase. (D) Wild-type BMDMs were stimulated with LPS, lactate, or rotenone. DMSO, dimethyl sulfoxide. (E) Wild-type BMDMs were stimulated with LPS for 48 hours (LPS 48 hours). Supernatant was used unfractionated (CM LPS) or fractionated for 100-, 10-, or 3-kDa protein size. Unfractionated and fractionated supernatant was transferred to naïve BMDMs for further 24 hours. (F) Intracellular lactate concentration was determined in the described groups. Statistically significant differences were determined by one-way or two-way (A and C) analysis of variance (ANOVA) with Tukey correction; n = 2 biological replicates. All values are means ± SEM; *P < 0.05; **P < 0.01; ***P < 0.001; ****P < 0.0001. Superscripts indicate statistical significance compared to the control group. If not indicated otherwise, n = 3 biological replicates.
Fig. 2
Fig. 2. Arg1 expression is controlled by IL6.
(A) Wild-type (WT) BMDMs were stimulated with LPS and treated with the JAK2 inhibitor AG 490 or both. Data shown are representative of three experiments. (B) Wild-type, Il6−/−, and Myd88−/− BMDMs were stimulated with LPS for 24 or 48 hours. CM of LPS, 48-hour–stimulated BMDMs of all genotypes, were transferred to naïve wild-type and Il6−/− and Myd88−/− BMDMs for further 24 hours. (C) Wild-type and Il6r−/− BMDMs were stimulated with LPS for 48 hours. CM were transferred to naïve wild-type and Il6r−/− BMDMs. (D) Whole-cell lysates of wild-type BMDMs, which were left untreated (Ctrl) or treated with LPS or lactate + IL6, were analyzed by Western blotting. (E) Heatmaps showing transcriptomic data from profile GSE115354 and RNA-seq analysis of Ctrl and IL4/IL13-stimulated BMDMs. (F) Wild-type and Nos2−/− BMDMs were left untreated or stimulated with LPS or IL4/IL13. CM of both genotypes were transferred to untreated wild-type and Nos2−/− BMDMs. (G) Concentration of IL6 in the supernatant of wild-type and Nos2−/− BMDMs stimulated with LPS was measured by enzyme-linked immunosorbent assay (ELISA). n = 3 biological replicates. Statistically significant differences were determined by a two-way ANOVA with Tukey correction; * displays that increased cell death was observed and therefore loading control (Grb2) was decreased. All values are means ± SEM; ****P < 0.0001. If not indicated otherwise, superscripts show statistical significance compared to the control group.
Fig. 3
Fig. 3. Type 1 IFNs and cell death suppression are inversely associated with histone lactylation.
(A) Wild-type BMDMs were treated with LPS for 48 hours, and live/dead staining was used. Cells were sorted for viable cells and late apototic cells (ACs). (B) Wild-type and Nos2−/− BMDMs were left untreated (Ctrl) or were stimulated with LPS, and cell death was assayed by LDH release. (C) Wild-type BMDMs were left untreated or were stimulated with LPS, and where indicated, the ferroptosis inducer RSL3 was added. Cell death was detected via CellTox green cytotoxicity assay. (D) Wild-type BMDMs differentiated with macrophage colony-stimulating factor (M-CSF) or LCCM were stimulated with LPS, and the percentages of Arg1+ of F4/80+ macrophages were determined. (E) The concentration of IL6 in the supernatant was measured by ELISA. (F) Wild-type BMDMs were differentiated with M-CSF or LCCM and stimulated with LPS. LDH release was evaluated over time. (G) Overview of LPS-induced cell death pathways. Wild-type, Asc−/−, and Trif−/− BMDMs (H) or Ifnar−/− BMDMs (I) were stimulated with LPS, and LDH release was evaluated. (J) Ifnar−/−, Nos2−/−, and wild-type BMDMs, differentiated with LCCM or CSF, were left untreated or were stimulated with LPS. * displays that increased cell death was observed. All values are means ± SEM; *P < 0.05; **P < 0.01; ****P < 0.0001. Statistically significant differences were determined by a one-way (A, E, G, and H) or two-way (B to D) ANOVA with Bonferroni correction; n = 3 biological replicates. n.s., not significant.
Fig. 4
Fig. 4. Arg1 controls the bioenergetic state of inflammation-induced regulatory macrophages.
(A) Representative blots of wild-type BMDMs stimulated with LPS or IL4/IL13 for the indicated time and percentages of Arg1+, PD-L1+ and PD-L2+ or F4/80+ macrophages were determined by flow cytometry analysis. Data shown are representative of three independent experiments. SSC-A, side scatter area; APC, allophycocyanin; PE, phycoerythrin. (B) Wild-type BMDMs were stimulated with solvent (Ctrl) or lactate for the indicated time, and the percentages of Arg1+, PD-L1+, and PD-L2+ or F4/80+ macrophages were determined by flow cytometry analysis. Data represent two independent experiments. (C) Wild-type and Nos2−/− BMDMs were left untreated or were treated with LPS*. The cells were sequentially treated with oligomycin, carbonyl cyanide-4 (trifluoromethoxy) phenylhydrazone (FCCP), and rotenone/antimycin A (Rot/AA), and the oxygen consumption rate (OCR) was determined. (D) Wild-type or Arg1-deficient BMDMs were left untreated or were treated with LPS*, and mitochondrial respiration was measured. All values are means ± SEM; *P < 0.05; **P < 0.01; and ****P < 0.0001. Statistically significant differences were determined by one-way ANOVA with Tukey correction. If not indicated otherwise, superscripts show statistical significance compared to the control group. n = 3 biological replicates.

References

    1. O’Neill L. A., Pearce E. J., Immunometabolism governs dendritic cell and macrophage function. J. Exp. Med. 213, 15–23 (2016). - PMC - PubMed
    1. Everts B., Amiel E., van der Windt G. J., Freitas T. C., Chott R., Yarasheski K. E., Pearce E. L., Pearce E. J., Commitment to glycolysis sustains survival of NO-producing inflammatory dendritic cells. Blood 120, 1422–1431 (2012). - PMC - PubMed
    1. Zhang D., Tang Z., Huang H., Zhou G., Cui C., Weng Y., Liu W., Kim S., Lee S., Perez-Neut M., Ding J., Czyz D., Hu R., Ye Z., He M., Zheng Y. G., Shuman H. A., Dai L., Ren B., Roeder R. G., Becker L., Zhao Y., Metabolic regulation of gene expression by histone lactylation. Nature 574, 575–580 (2019). - PMC - PubMed
    1. Diskin C., Ryan T. A. J., O’Neill L. A. J., Modification of proteins by metabolites in immunity. Immunity 54, 19–31 (2021). - PubMed
    1. Irizarry-Caro R. A., McDaniel M. M., Overcast G. R., Jain V. G., Troutman T. D., Pasare C., TLR signaling adapter BCAP regulates inflammatory to reparatory macrophage transition by promoting histone lactylation. Proc. Natl. Acad. Sci. U.S.A. 117, 30628–30638 (2020). - PMC - PubMed

Publication types