. 2021 Jun 23;12(7):641.
doi: 10.1038/s41419-021-03924-0.

Clinical stage drugs targeting inhibitor of apoptosis proteins purge episomal Hepatitis B viral genome in preclinical models

Affiliations

Clinical stage drugs targeting inhibitor of apoptosis proteins purge episomal Hepatitis B viral genome in preclinical models

Michelle P Clark et al. Cell Death Dis. .

Abstract

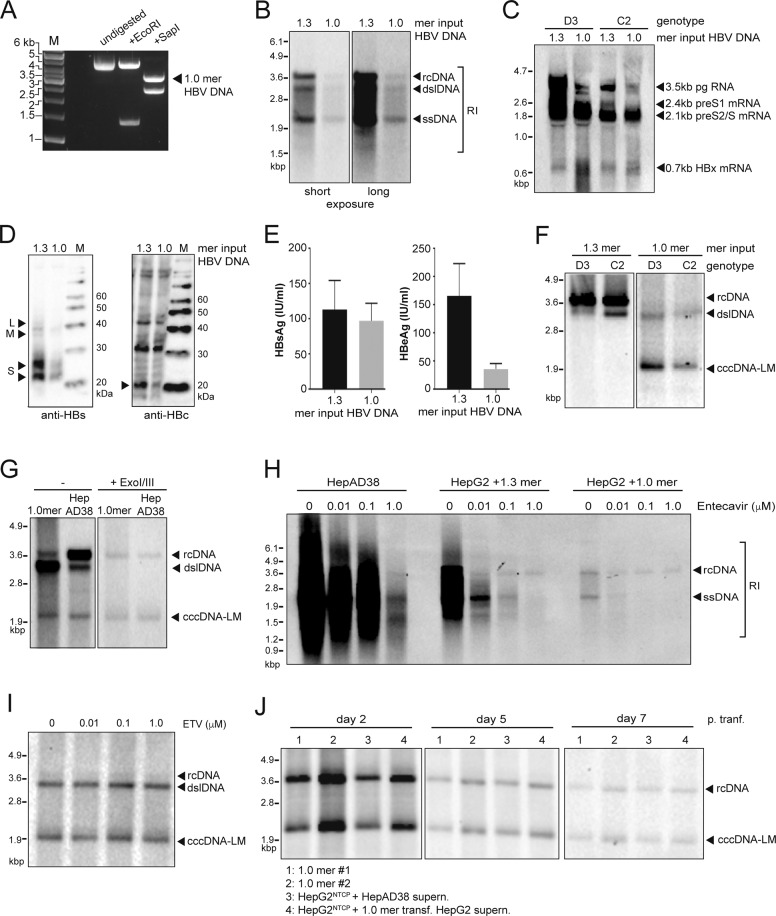
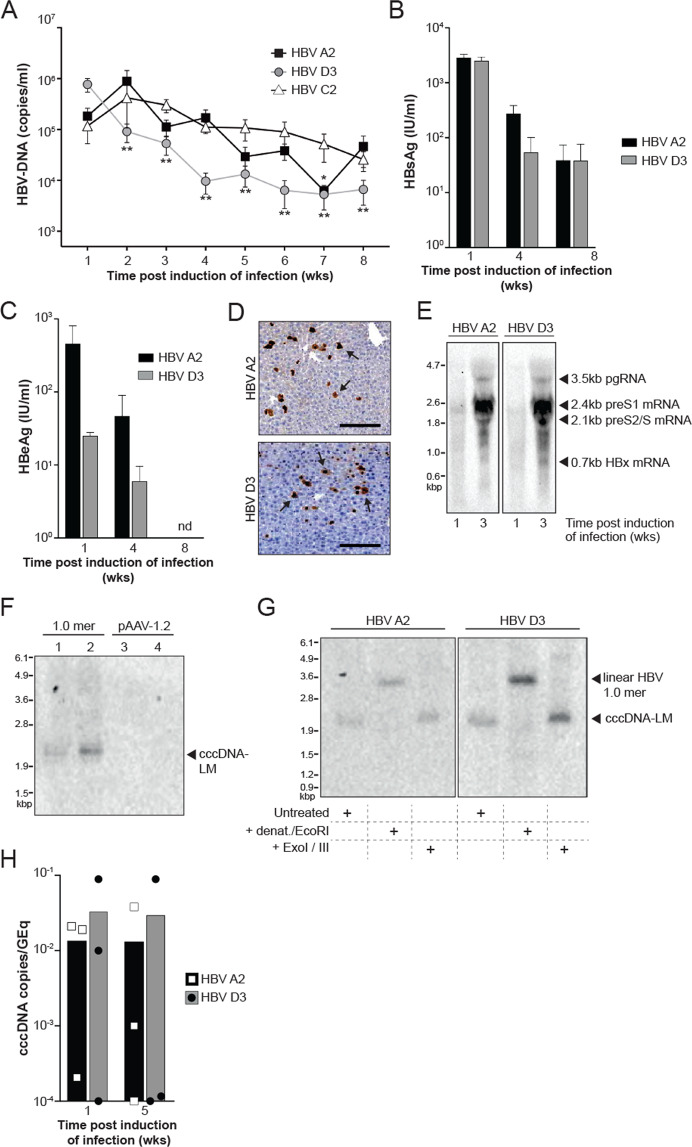
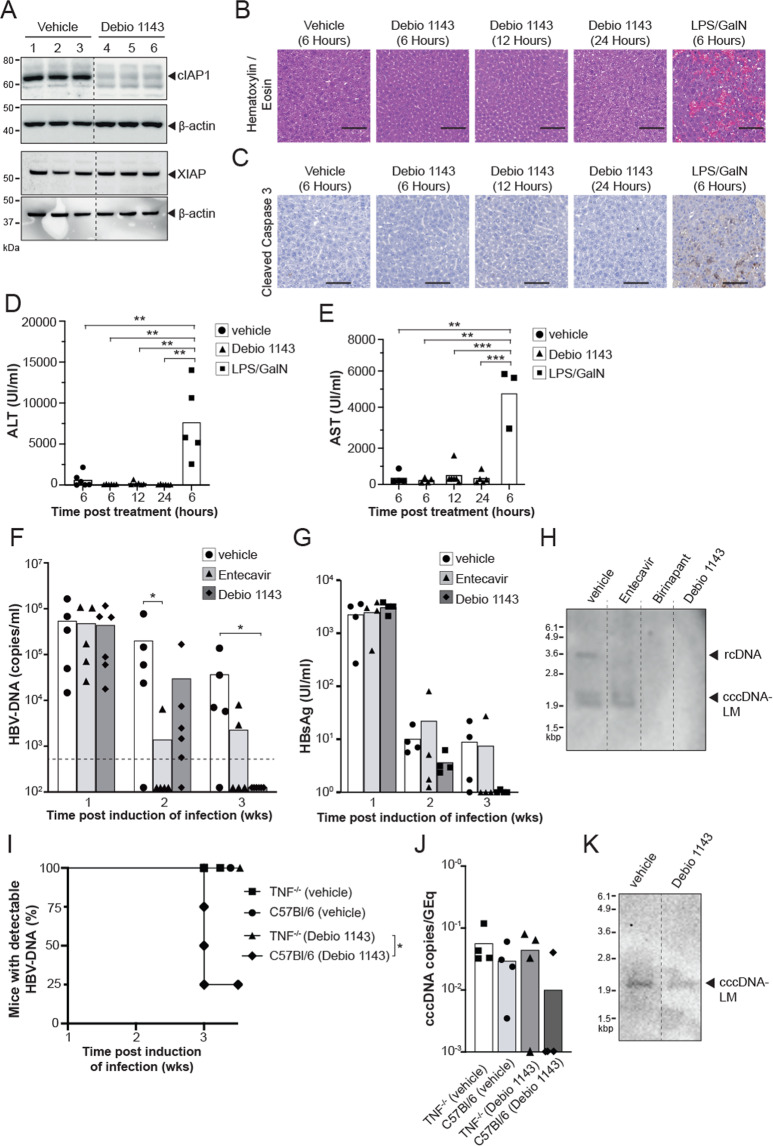
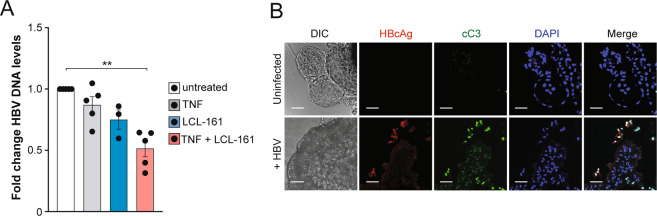
A major unmet clinical need is a therapeutic capable of removing hepatitis B virus (HBV) genome from the liver of infected individuals to reduce their risk of developing liver cancer. A strategy to deliver such a therapy could utilize the ability to target and promote apoptosis of infected hepatocytes. Presently there is no clinically relevant strategy that has been shown to effectively remove persistent episomal covalently closed circular HBV DNA (cccDNA) from the nucleus of hepatocytes. We used linearized single genome length HBV DNA of various genotypes to establish a cccDNA-like reservoir in immunocompetent mice and showed that clinical-stage orally administered drugs that antagonize the function of cellular inhibitor of apoptosis proteins can eliminate HBV replication and episomal HBV genome in the liver. Primary human liver organoid models were used to confirm the clinical relevance of these results. This study underscores a clinically tenable strategy for the potential elimination of chronic HBV reservoirs in patients.


Conflict of interest statement

Debiopharm International SA, the manufacturer of the monovalent IAP inhibitor Debio 1143, sponsored parts of the research performed at The Walter and Eliza Hall Institute of Medical Research under a research license agreement.

Figures

Fig. 1
Fig. 1. HBV 1.0 mers promote HBV replication and facilitates formation of cccDNA-like molecules in HepG2 cells.
A Agarose gel electrophoresis of HBV 1.0mer DNA (genotype D3) digested with indicated restriction endonucleases, 1.0 g per lane, M, DNA ladder marker. B Southern blot analysis of intracellular HBV core-associated HBV DNA extracted from HepG2 cells at day 5 post-transfection of wildtype HBV 1.3 plasmid or linearized 1.0 mer DNA (genotype D3). C Northern blot analysis of intracellular HBV RNA from HepG2 cells 5 days post-transfection with wildtype HBV 1.3 plasmid or linearized 1.0 mer DNA. D Western blot analysis of intracellular HBsAg (left) and HBcAg (right), indicated by black arrows from total HepG2 lysates at day 5 post-transfection with HBV 1.3 plasmid or linearized 1.0 mer DNA (genotype D3). E Quantitative analysis of HBsAg (left) and HBeAg (right) from the supernatant of HepG2 cells at day 5 post-transfection with HBV 1.3 plasmid or linearized 1.0 mer DNA (genotype D3). Data are represented as mean ± s.e.m. F Southern blot analysis of HBV DNA extracted by Hirt-lysis from HepG2 cells at day 5 post transfection with HBV 1.3 plasmid or linearized 1.0 mer DNA. G Southern blot analysis of HBV DNA extracted by Hirt-lysis from HepG2 cells at day 5 post transfection of wildtype 1.0mer DNA (genotype D3) or from replication induced HepAD38 cells 7 days post seeding, undigested or Exo I/III digested. H Southern blot analysis of intracellular core-associated HBV DNA from HepAD38 cells at day 7 post seeding or from HepG2 cells at day 5 post transfection with HBV1.3mer plasmid or linearized 1.0 mer. Cells were maintained in the presence of indicated concentrations of Entecavir. I Southern blot analysis of HBV DNA extracted by Hirt-lysis from HepG2 cells at day 5 post transfection with linearized 1.0 mer HBV DNA, after treatment with entecavir at indicated concentrations. J Southern blot analysis of HBV DNA extracted by Hirt-lysis at indicated timepoints from HepG2 cells transfected with HBV 1.0 mer genotype D3 (lane 1 + 2), transgenic HepG2NTCP cells inoculated with HBV containing supernatant of HepAD38 cells (lane 3) or transgenic HepG2NTCP cells inoculated with HBV containing supernatant of HBV 1.0 mer (genotype D3) transfected HepG2 cells. Results are representative of three independent experiments.
Fig. 2
Fig. 2. HBV replication and formation of cccDNA-Like molecules in C57BL/6 mice.
A Serial measurement of serum HBV DNA levels in C57BL/6 mice after induction of infection with HBV 1.0 mers. Data are represented as mean ± s.e.m. from three independent experiments (n = 15 for genotype A2, n = 12 for genotype D3, n = 15 for genotype C2). Statistical analyses using unpaired two-tailed t tests were performed comparing each week with week 1. *P < 0.05, **P < 0.01. B Quantitative analysis of HBsAg in serum of C57BL/6 mice at indicated time points after induction of infection with HBV 1.0 mers. Data are represented as mean ± s.e.m. from two independent experiments (n = 12 for genotype A2, n = 11 for genotype D3). C Quantitative analysis of HBeAg in serum of C57BL/6 mice at indicated timepoints after induction of infection with HBV 1.0 mers of indicated genotypes. Data are represented as mean ± s.e.m. from two independent experiments (n = 12 for genotype A2, n = 11 for genotype D3). nd = non-detectable. D Immunohistochemistry staining of HBV core antigen positive cells in liver sections of C57BL/6 mice one week after induction of infection with the indicated HBV genotypes, arrows indicate HBcAg-positive stained liver cells, n = 6 per group, scale bars: 125 μm. Data is representative of two independent experiments. E Northern blot analysis of total liver HBV RNA from C57BL/6 mice at indicated time points after induction of HBV infection with indicated genotypes. Data is representative of two independent experiments. F Southern blot analysis of HBV DNA extracted by Hirt-lysis from total liver of C57BL/6 mice 3 weeks post induction of infection with HBV 1.0 mer, genotype D3 (lanes 1 and 2) in comparison to mice transfected with pAAV-HBV1.2 plasmid DNA, genotype A2 (lanes 3 and 4). Data is representative of two independent experiments. G Southern blot analysis of HBV DNA extracted by Hirt-lysis and exposed to heat denaturation and EcoRI digest or Exo I/III digest in comparison to untreated DNA from total liver of C57BL/6 mice 3 weeks post induction of infection with HBV 1.0 mer (genotype A2 or D3). Results are representative of three independent experiments. H Quantification of HBV cccDNA from total liver of C57BL/6 mice 1- and 5-weeks post induction of infection with HBV 1.0 mer (genotype A2 and D3) and treatment with specified compounds. Data are represented as mean (n = 3 per time point). HBV cccDNA levels expressed as a ratio of cccDNA copies per genomic equivalents (GEq). The limit of detection is 1 cccDNA copy/2 mg of liver.
Fig. 3
Fig. 3. Debio 1143 promotes clearance of HBV infection in C57BL/6 mice.
A Western blot analysis of cIAP1, XIAP (black arrow), and β-Actin protein levels in the liver of naive C57BL/6 mice 18 h after a single dose of vehicle or Debio 1143 treatment (n = 3 mice per group, indicated by numbers above blots). Data is representative of three independent experiments. B Hematoxylin and eosin staining of liver sections of uninfected C57Bl/6 mice at indicated timepoints after a single dose of vehicle, Debio 1143 or LPS/GalN (n = 3 mice per group). Data is representative of two independent experiments. Scale bars = 100 µM. C Immunohistochemistry staining of cleaved caspase-3 in liver sections of uninfected C57Bl/6 mice at indicated timepoints after a single dose of vehicle, Debio 1143 or LPS/GalN. (n = 3 mice per group). Data is representative of two independent experiments. Scale bars = 100 µM. D Serum alanine aminotransferase (ALT) levels at indicated timepoints after a single dose of vehicle, Debio 1143 or LPS/GalN. Data are represented as mean (n = 5–6). Statistical analyses using unpaired two-tailed t tests were performed **P < 0.01. E Serum aspartate aminotransferase (AST) levels at indicated timepoints after a single dose of vehicle, Debio 1143 or LPS/GalN. Data are represented as mean (n = 3–6). Statistical analyses using unpaired two-tailed t tests were performed **P < 0.01, ***P < 0.001. F Serial measurement of serum HBV DNA levels in C57BL/6 mice after induction of HBV infection with HBV 1.0 mers (genotype D3) and treatment with specified compounds at indicated timepoints. Dashed line indicates assay detection limit of 500 HBV DNA copies/ml. Representative data of two independent experiments shown as mean (n = 5 for vehicle, n = 5 for Entecavir, n = 6 for Debio 1143). Statistical analyses using unpaired two-tailed t tests for parametric data and Holm–Sidak correction for multiple t tests was performed. *P < 0.05. G Measurement of serum HbsAg in C57BL/6 mice after induction of HBV infection with HBV 1.0 mers (genotype D3) and treatment with specified compounds at indicated timepoints. H Southern blot analysis of HBV DNA extracted by Hirt-lysis from total liver of individual C57BL/6 mice 3 weeks post induction of infection with HBV 1.0 mer (genotype D3) and treatment with specified compounds. Results are representative from three independent experiments. I Proportion of animals and time when TNF−/− or C57BL/6 mice after induction of HBV infection with HBV 1.0 mers (genotype D3) and treatment with Debio 1143 or vehicle first achieved an undetectable serum HBV DNA level. Data are represented as mean (n = 4). Statistical analyses using log-rank Mantel–Cox test was performed *P < 0.05. J Quantification of HBV cccDNA from total liver of individual TNF−/− and C57BL/6 mice 3 weeks post induction of infection with HBV 1.0 mer (genotype D3) and treatment with specified compounds. Data are represented as mean (n = 4 per group). HBV cccDNA levels expressed as a ratio of cccDNA copies per genomic equivalents (GEq). The limit of detection is 1 cccDNA copy/ 2 mg of liver. K Southern blot analysis of HBV DNA extracted by Hirt-lysis from total liver of individual TNF−/− mice 3 weeks post induction of infection with HBV 1.0 mer (genotype D3) and treatment with specified compounds.
Fig. 4
Fig. 4. LCL-161 selectively induces TNF mediated apoptosis of HBV infected primary human liver organoids.
A HBV DNA levels in supernatant of HBV-infected liver organoid cultures 4 days after indicated treatment with 10 μM LCL-161, 200 ng/ml recombinant TNF or the combinaton of both (8 days after infection), identical donor derived organoid cultures were used in all groups (n = 3 for LCL-161 only group, n = 5 for all other groups). Data are represented as mean ± s.e.m. and normalized to untreated organoid culture. Statistical analyses using unpaired two-tailed t tests for parametric data was performed. **P < 0.01. B Immunofluorescence staining of differentiated liver organoids, uninfected or infected with HBV and treated with 10 μM LCL-161 and 200 ng/ml TNF for 6 h on day 6 post infection. Scale bars: 50 μm. Donor-derived organoid cultures with n = 2 for uninfected and n = 4 for uninfected groups were used. DIC differential interference contrast, cC3 cleaved caspase 3. Results are representative from three independent experiments.

References

    1. World Health Organization. WHO global hepatitis report 2017. World Health Organization; 2017. p. 1–83. Avaliable from: https://apps.who.int/iris/handle/10665/255016.
    1. Werle-Lapostolle B, Bowden S, Locarnini S, Wursthorn K, Petersen J, Lau G, et al. Persistence of cccDNA during the natural history of chronic hepatitis B and decline during adefovir dipivoxil therapy. Gastroenterology. 2004;126:1750–8. doi: 10.1053/j.gastro.2004.03.018. - DOI - PubMed
    1. Durantel D, Zoulim F. New antiviral targets for innovative treatment concepts for hepatitis B virus and hepatitis delta virus. J Hepatol. 2016;64:S117–S131. doi: 10.1016/j.jhep.2016.02.016. - DOI - PubMed
    1. Protzer U. Viral hepatitis: The bumpy road to animal models for HBV infection. Nat Rev Gastroenterol Hepatol. 2017;14:327–8. doi: 10.1038/nrgastro.2017.44. - DOI - PubMed
    1. Yan H, Zhong G, Xu G, He W, Jing Z, Gaon Z, et al. Sodium taurocholate cotransporting polypeptide is a functional receptor for human hepatitis B and D virus. elife. 2012;1:e00049. doi: 10.7554/eLife.00049. - DOI - PMC - PubMed

Publication types

MeSH terms

Substances