. 2021 Jun 23;12(1):3872.
doi: 10.1038/s41467-021-23792-8.

CD45 pre-exclusion from the tips of T cell microvilli prior to antigen recognition

Affiliations

CD45 pre-exclusion from the tips of T cell microvilli prior to antigen recognition

Yunmin Jung et al. Nat Commun. .

Abstract

The tyrosine phosphatase CD45 is a major gatekeeper for restraining T cell activation. Its exclusion from the immunological synapse (IS) is crucial for T cell receptor (TCR) signal transduction. Here, we use expansion super-resolution microscopy to reveal that CD45 is mostly pre-excluded from the tips of microvilli (MV) on primary T cells prior to antigen encounter. This pre-exclusion is diminished by depleting cholesterol or by engineering the transmembrane domain of CD45 to increase its membrane integration length, but is independent of the CD45 extracellular domain. We further show that brief MV-mediated contacts can induce Ca2+ influx in mouse antigen-specific T cells engaged by antigen-pulsed antigen presenting cells (APC). We propose that the scarcity of CD45 phosphatase activity at the tips of MV enables or facilitates TCR triggering from brief T cell-APC contacts before formation of a stable IS, and that these MV-mediated contacts represent the earliest step in the initiation of a T cell adaptive immune response.


Conflict of interest statement

The authors declare no competing interests.

Figures

Fig. 1
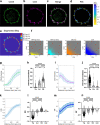
Fig. 1. Pre-exclusion of CD45 at the tips of MV on human CD4+ T cells.
a A representative Airyscan image of a human CD4+ T cell labeled with Alexa Fluor 488 (AF488) conjugated anti-CD45 antibody. b A representative 4x-ExM-Airyscan image of a similarly labeled cell. Yellow arrows indicate MV tips. c Representative 4x-ExM-Airyscan images of MV on human CD4+ T cells stained with anti-CD45-AF488 (green) and FM 4-64FX membrane dye (red). d A representative 4x-ExM-Airyscan image of a human CD4+ T cell stained with anti-CD45-AF488 (green), FM 4-64FX membrane dye (blue) and anti-l-sel-AF568 (magenta). e, f Magnified images of areas 1 and 2 marked by the rectangles in d. Individual channel images of CD45 (A), membrane (B), and l-sel (C) (right, upper panels) and merged images of (A) and (B), (A) and (C), and (B) and (C) (right, lower panels). These images are representative of nine cells observed in three independent experiments. Scale bars in a, b, d: 2 µm; in c: 500 nm; e, f: 1 µm. The scale bars are corrected by the expansion factor except for a.
Fig. 2
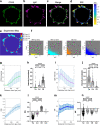
Fig. 2. Presence of CD3 molecules on tips of MV, where CD45 is largely depleted, in human CD4+ T cells.
ac Representative 4x-ExM-Airyscan images of a CD4+ T cell labeled with anti-CD45-AF488 (green; a), anti-CD3-CF633 (magenta; b), and the merged image (c). Images in ac are representative of 35 cells observed in three independent experiments. d The RIS image between a and b. e The segmented map of the cell in ac for positions of the individual MV tips (MV tips, red cross), MV-tip area (yellow), MV-column area (MV-col area, cyan), and cell body area (CB area, orange). Scale bars in d and e: 2 µm. f The intensity scatter plots for CD3 and CD45 within the MV-tip area (yellow), MV-col area (cyan), CB area (orange), and entire cell area (blue) of the cell shown in e. g The mean of the median CD45-intensities (normalized) of 35 cells was plotted as a function of the distance from the MV tips. Error bars represent the standard deviation (SD). h The median CD45-intensities (normalized) within the segmented areas (MV-tip area (Tip, black circle), MV-col area (Col, gray square), CB area (CB, dark gray triangle)) of each z-plane images (20 z-plane images per cell) of the 35 cells. Each dot represents data collected from a z-plane image. Bars represent the mean and error bars represent the standard error of the mean (SE). i The mean of the median CD3 intensities (normalized) was analyzed as g. j The median CD3 intensities (normalized) within the segmented areas described as h. k The mean of the median RIS values between the CD45 and the CD3 images was analyzed as g. l The median RIS values within the segmented areas or entire cell (Cell, light gray downward-triangle) described as h. m The mean of SRʹ values between the CD45 and the CD3 images was analyzed as g. n The mean SRʹ values within the segmented areas described as l. p values (****p ≤ 0.0001) were calculated by two-tailed Wilcoxon matched-pairs signed rank test. Source data for gn are provided as a Source Data file.
Fig. 3
Fig. 3. Highly enriched membrane-bound IgM molecules on the tips of MV of human B cells.
ac Representative 4x-ExM-Airyscan images of a B cell labeled with anti-CD45-AF488 (green; a), anti-IgM-CF633 (magenta; b), and the merged image (c). Images in ac are representative of 19 cells observed in three independent experiments. d The RIS image between a and b. e The segmented map of the cell in ac for positions of the individual MV tips (MV tips, red cross), MV-tip area (yellow), MV-col area (cyan), and cell body area (CB area, orange). Scale bars in d and e: 2 µm. f The intensity scatter plots for IgM and CD45 within the MV-tip area (yellow), MV-col area (cyan), CB area (orange), and entire cell area (Cell, blue) of the cell shown in e. g The mean of the median CD45-intensities (normalized) of 19 cells was plotted as a function of the distance from the MV tips. Error bars represent the SD. h The median CD45-intensities (normalized) within the segmented areas (MV-tip area (Tip, black circle), MV-col area (Col, gray square), CB area (CB, dark gray triangle)) of each z-plane images (20 z-plane images per cell) of the B cells (19 cells). Each dot represents data collected from a z-plane image. Bars represent the mean and error bars represent the SE. i The mean of the median IgM-intensities (normalized) was analyzed as g. j The median IgM-intensities (normalized) within the segmented areas described as h. k The mean of the median RIS values between the CD45 and the IgM images was analyzed as g. l The median RIS values within the segmented areas or entire cell (Cell, light gray downward-triangle) described as h. m The mean SRʹ values between the CD45 and the IgM images was analyzed as g. n The mean SRʹ values within the segmented areas described as l. p values (****p ≤ 0.0001) were calculated by two-tailed Wilcoxon matched-pairs signed rank test. Source data for gn are provided as a Source Data file.
Fig. 4
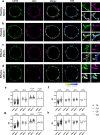
Fig. 4. Effect of MβCD on the distribution of surface CD45 molecules in human CD4+ T cells.
ad Representative 4x-ExM-Airyscan images of CD45 (green), CD3 (magenta), the merged, and RIS of representative untreated (MβCD –) or MβCD-treated (MβCD + , 10 mM) resting (a, b, respectively) and effector (c, d, respectively) T cells. Magnified images of the area marked in the merged images are presented in the right most panels. Scale bars: 2 µm in the merge and the RIS images; 500 nm in the magnified images. Images in ad are representative of three independent experiments. ef The median RIS values (e) and the mean SRʹ values (f) within the segmented areas, (MV-tip area (Tip, black circle), MV-col area (Col, gray square), CB area (CB, dark gray upward-triangle), or entire cell (Cell, light gray downward-triangle)) were analyzed from each z-plane images (20 z-plane images per cell) of the resting T cells (MβCD –: 19 cells; MβCD + : 21 cells). Each dot represents data collected from a z-plane image. Bars represent the mean and error bars represent the SE. g, h The median RIS values (g) and the mean SRʹ values (h) of effector T cells (MβCD –: 14 cells; MβCD + : 22 cells) were similarly analyzed as e, f. p values (ns (not significant), p > 0.05; *p ≤ 0.05; **p ≤ 0.01; ****p ≤ 0.0001) were calculated by two-tailed Mann–Whitney test. Source data for eh are provided as a Source Data file.
Fig. 5
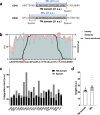
Fig. 5. Analysis of TM domain and MIL lengths.
a Examples of the MIL of human CD45 and CD3δ. Shown are the a.a. sequences of TM domain (underlined) ±10 flanking residues. The charged a.a. residues located at each end of the TM domain are marked in red; spacers (residues between the TM domain and the charged a.a. residues) are marked in gray; The MIL are marked by blue double arrows. b The percentages of sequence identity or similarity (allowing substitutions within the same group of a.a.: charged [K, H, R, E, D]; hydrophobic [A, I, L, F, V, P, G]; polar [Q, N, S, T, C]; amphipathic [W, Y, M]), and the probability of TM positioning of residues analyzed using TMHMM v2.0 (transmembrane helices based on a hidden Markov model (http://www.cbs.dtu.dk/services/TMHMM/) for each residue of the CD45 TM domain ± 10 flanking residues among 38 species (Supplementary Table 3). c Lengths of the TM domains (black bars) and spacers (gray bars) of the T cell membrane proteins listed in Supplementary Table 2. d Mean lengths of the TM domains and the MILs of non-CD45 membrane proteins (n = 45) listed in Supplementary Table 2. Error bars represent the SE. Source data for bd are provided as a Source Data file.
Fig. 6
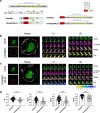
Fig. 6. CD45 distribution in Jurkat T cells lentivirally transduced with CD45 mutants.
a A schematic representation of wild-type (WT) human CD45 gene and CD45 mutants, CD45ΔEC and CD45ΔECMIL25. CD45ΔEC (native TM domain) and CD45ΔECMIL25 (K600L) include the signaling sequence domain (SS), a short extracellular domain (six a.a.) (EC), TM domain (TM), intracellular domain (IC), and triple HA tag sequences. MIL of CD45ΔEC and CD45ΔECMIL25 are marked on the right with blue double arrows. b, c Representative 4x-ExM-Airyscan images of a Jurkat T cell lentivirally transduced with CD45ΔEC (b) or CD45ΔECMIL25 (c). CD45 mutants selected among 15 or 25 cells, respectively, observed in three independent experiments. Images of endogenous (green, upper left) or the transduced (magenta, lower left) CD45 mutants, and the merged images between the two are presented. Scale bars: 5 µm. Six z-stack images (step size 125 nm) of the areas marked (1) and (2) in the merged images were magnified in the right panels. Scale bars: 500 nm. The color bar at the bottom represents RIS values between −1 (100% mutant; 0% endogenous CD45) and +1 (100% endogenous CD45; 0% mutant). d Colocalization analysis between the endogenous and mutant CD45 of 120 MV images (Supplementary Fig. 11) collected from each CD45ΔEC (black upward-triangle)- and CD45ΔECMIL25 (gray downward-triangle)-transduced Jurkat T cells. Each dot represents data collected from a MV image. Bars represent the mean and error bars represent the SE. Pearson’s correlation coefficient (Rʹ, Eq. (2)), Manders’ overlap coefficient (MOC, Eq. (4)), Manders’ correlation coefficients (MCC1 and MCC2, Eq. (5)) were calculated as described in Supplementary Table 1 and Methods. p values (****p < 0.0001) were calculated by two-tailed Mann–Whitney test. Source data for d are provided as a Source Data file.

References

    1. Tonks NK, Charbonneau H, Diltz CD, Fischer EH, Walsh KA. Demonstration that the leukocyte common antigen (CD45) is a protein tyrosine phosphatase. Biochemistry. 1988;27:8695–8701. doi: 10.1021/bi00424a001. - DOI - PubMed
    1. Penninger JM, Irie-Sasaki J, Sasaki T, Oliveira-dos-Santos AJ. CD45: new jobs for an old acquaintance. Nat. Immunol. 2001;2:389–396. doi: 10.1038/87687. - DOI - PubMed
    1. Hermiston ML, Xu Z, Weiss A. CD45: a critical regulator of signaling thresholds in immune cells. Annu. Rev. Immunol. 2003;21:107–137. doi: 10.1146/annurev.immunol.21.120601.140946. - DOI - PubMed
    1. Thomas ML. The leukocyte common antigen family. Annu. Rev. Immunol. 1989;7:339–369. doi: 10.1146/annurev.iy.07.040189.002011. - DOI - PubMed
    1. Volarevic S, et al. Regulation of TCR signaling by CD45 lacking transmembrane and extracellular domains. Science. 1993;260:541. doi: 10.1126/science.8475386. - DOI - PubMed

Publication types

MeSH terms

Substances