. 2021 Jun 23;12(1):3896.
doi: 10.1038/s41467-021-23949-5.

Single cell derived mRNA signals across human kidney tumors

Affiliations

Single cell derived mRNA signals across human kidney tumors

Matthew D Young et al. Nat Commun. .

Abstract

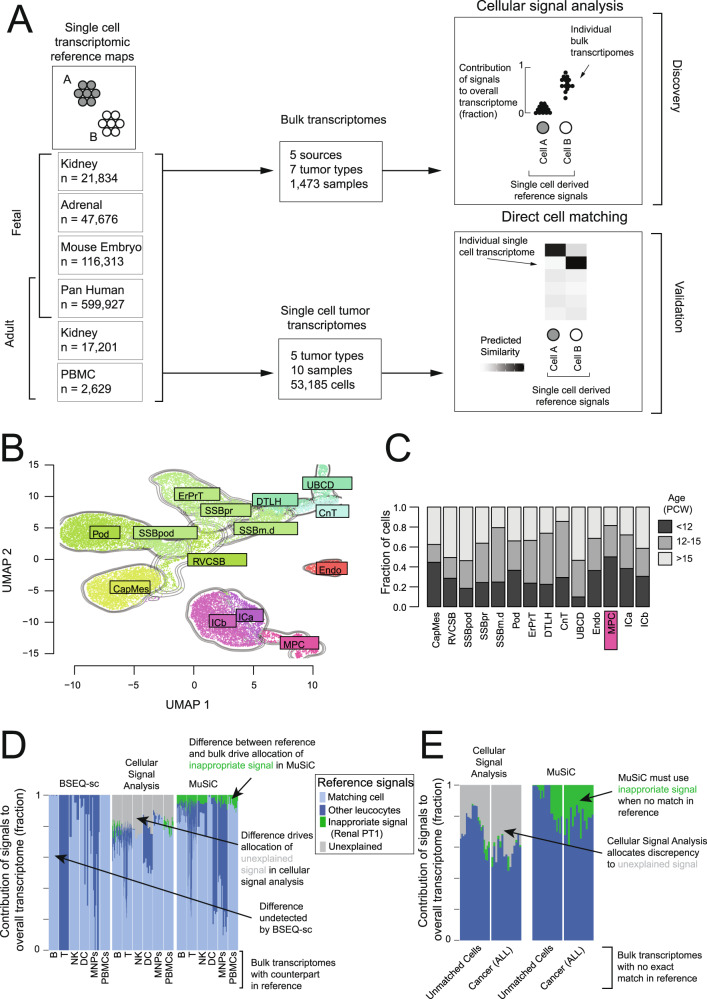
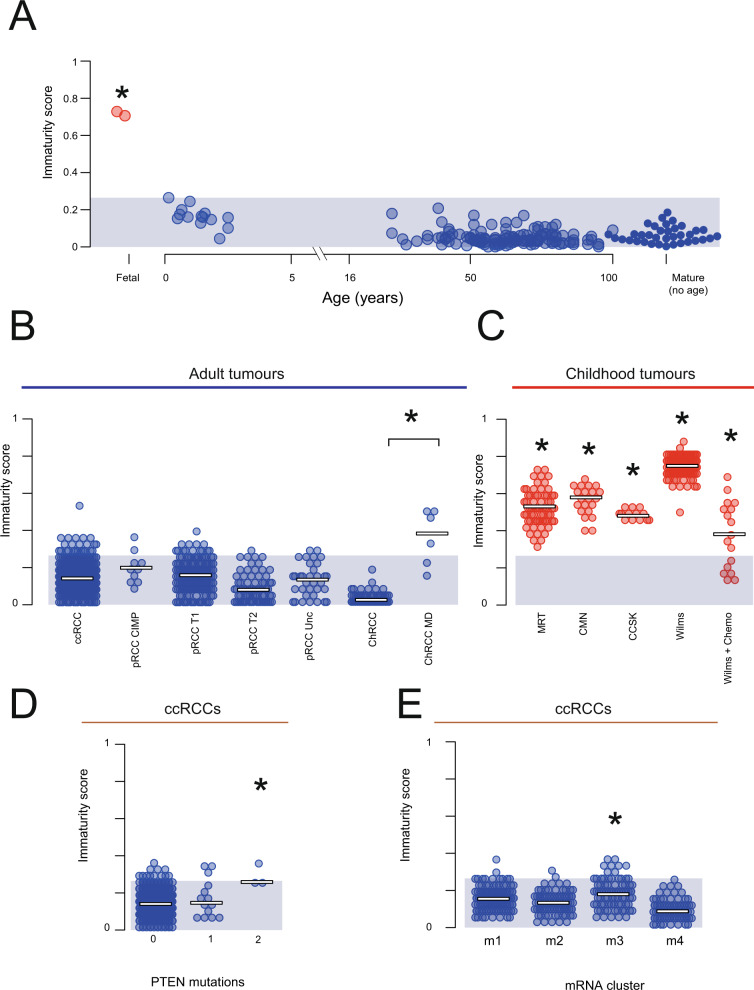
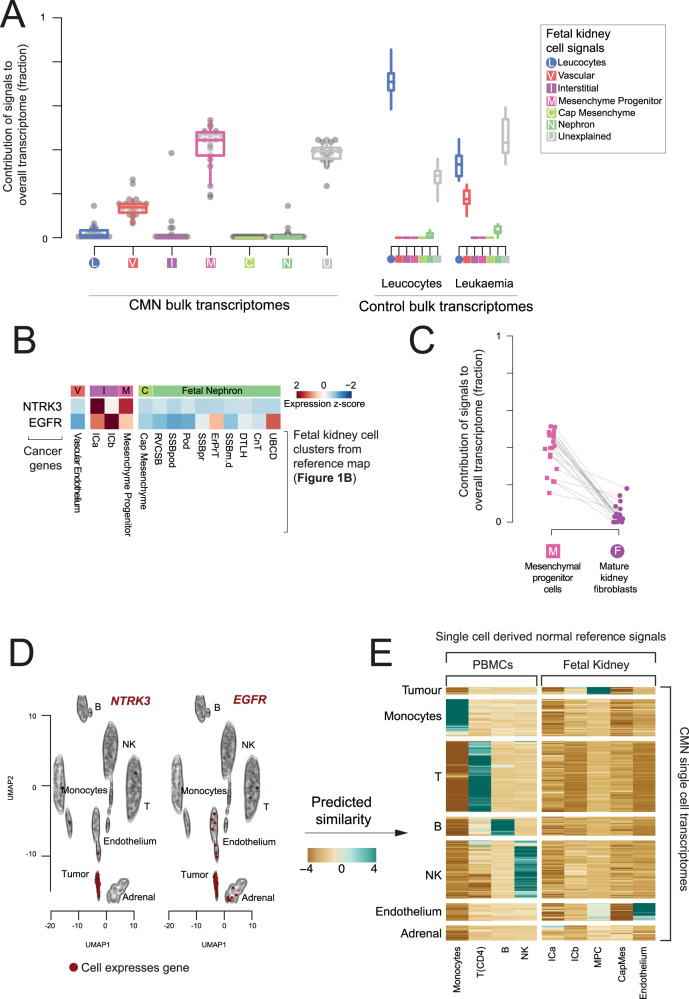
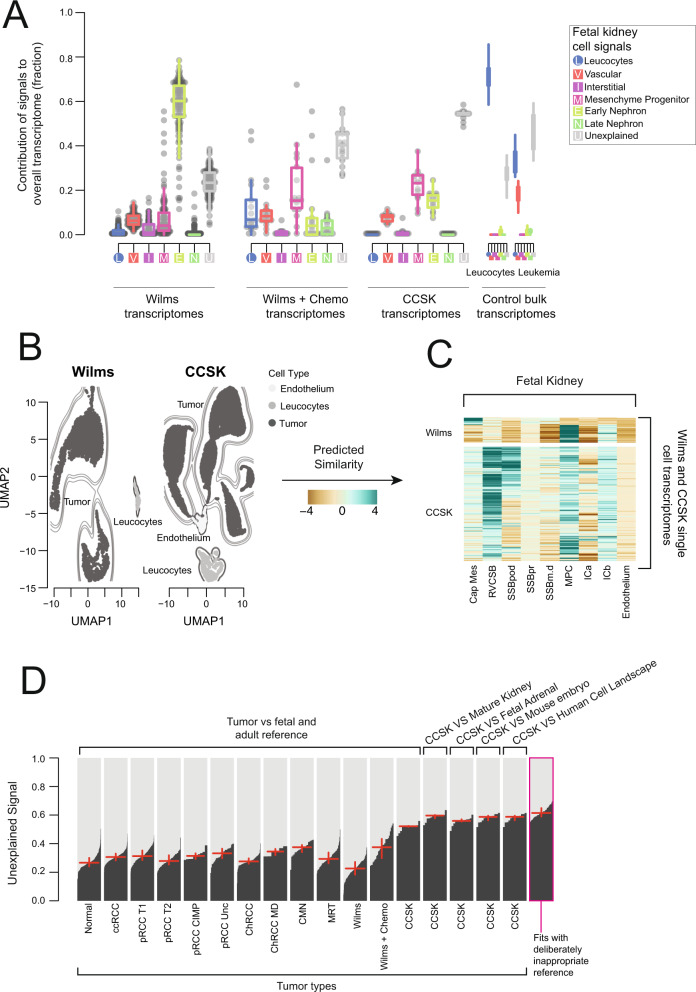
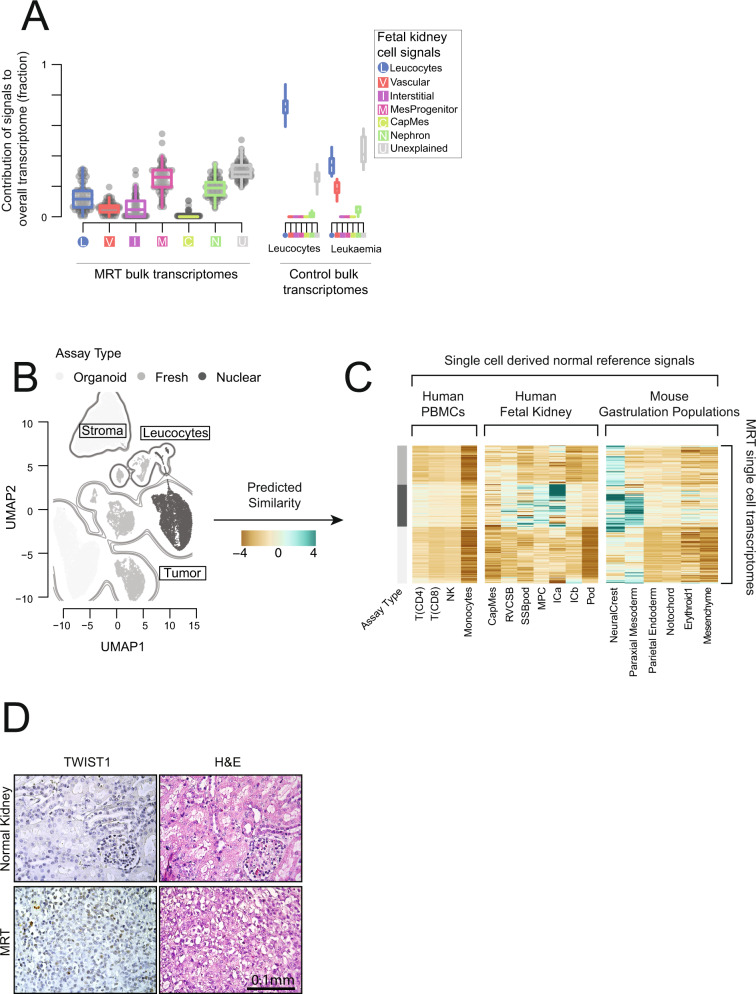
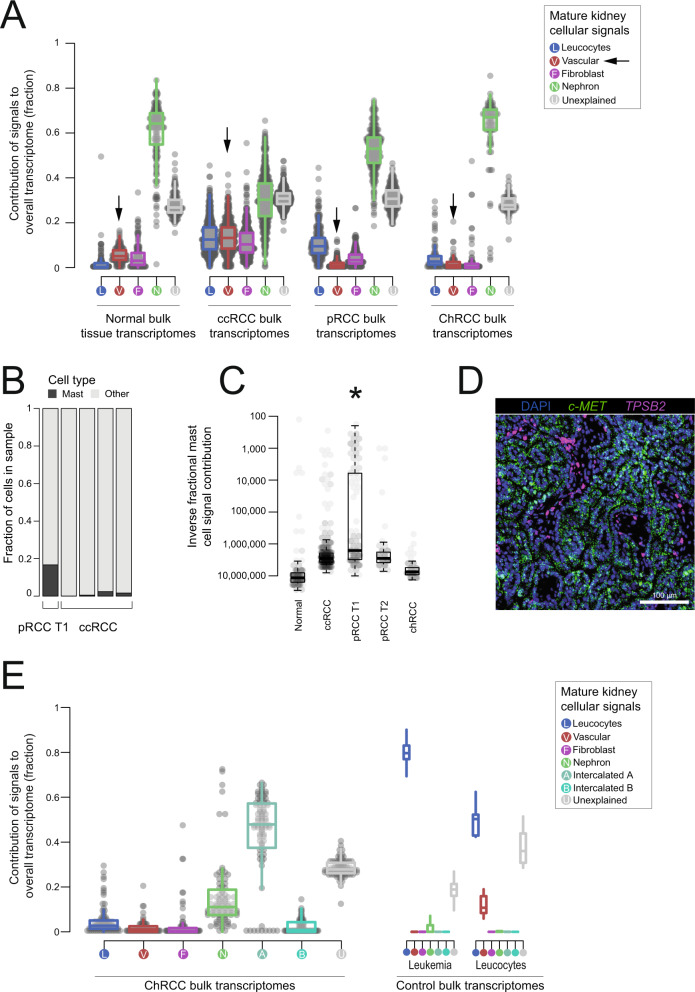
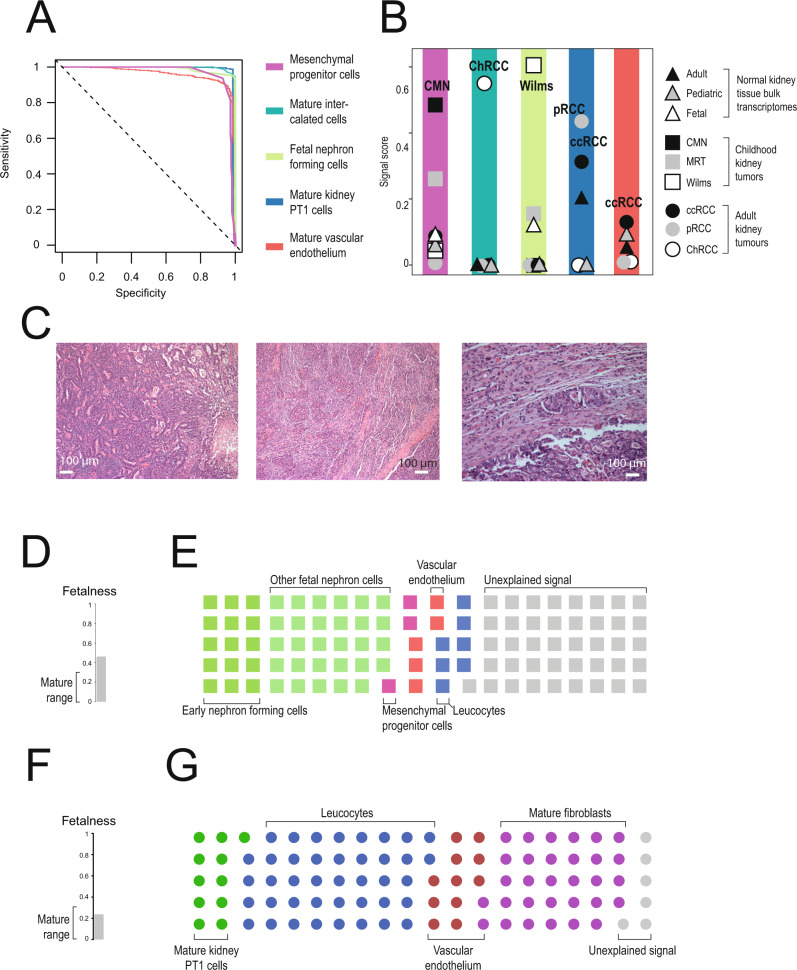
Tumor cells may share some patterns of gene expression with their cell of origin, providing clues into the differentiation state and origin of cancer. Here, we study the differentiation state and cellular origin of 1300 childhood and adult kidney tumors. Using single cell mRNA reference maps of normal tissues, we quantify reference "cellular signals" in each tumor. Quantifying global differentiation, we find that childhood tumors exhibit fetal cellular signals, replacing the presumption of "fetalness" with a quantitative measure of immaturity. By contrast, in adult cancers our assessment refutes the suggestion of dedifferentiation towards a fetal state in most cases. We find an intimate connection between developmental mesenchymal populations and childhood renal tumors. We demonstrate the diagnostic potential of our approach with a case study of a cryptic renal tumor. Our findings provide a cellular definition of human renal tumors through an approach that is broadly applicable to human cancer.


Conflict of interest statement

The authors declare no competing interests.

Figures

Fig. 1
Fig. 1. Methodology overview and validation.
A Overview of methodology: Single cell reference atlases (left) define cellular signals. These are used to calculate the contribution of each cellular signal to bulk transcriptomes (top, Supplementary Data 1), where signal contributions are normalized to give a score between 0 and 1 for each bulk transcriptome, cellular signal pair (top right). These findings are validated by comparing the same cellular signals (left) to single cell tumor transcriptomes (bottom, Supplementary Table 1), where logistic regression generates a similarity score for each single cell transcriptome, cellular signal pair (bottom right). B Combined fetal kidney reference map: Contours and colors indicate the labeled cell type. CapMes Cap Mesenchyme, RVCSB Renal vesicle and comma-shaped body, SSBpod S-shaped body podocyte, SSBpr S-shaped body proximal tubules, SSBm.d S-shaped body medial and distal, Pod Podocytes, ErPrT Early proximal tubules, DTLH Distal tubule and loop of Henle, UBCD Ureteric Bud and collecting duct, CnT Connecting tubules, Endo Endothelium, ICa Interstitial cells a (smooth muscle), ICb Interstitial cells b (stromal), MPC Mesenchymal progenitor cells. C Age distribution of fetal kidney populations: Bar heights indicate fraction of cell type (as in B) by fetal age (color) in post conception weeks. D Benchmarking with match in provided reference: Comparison of two “bulk deconvolution” methods (BSEQ-sc and MuSiC) to cellular signal analysis, using bulk transcriptomes for which a good match exists in the reference single cell dataset. Bars height represent signal contributions from an immune cell and proximal tubular cell (PT1, included as a negative control) reference set in explaining bulk transcriptome from peripheral blood or flow sorted cells as indicated by the x-axis, bar color, and legend. “Matching cell” indicates a contribution from the expected signal (e.g., NK cell signal in NK bulk transcriptomes). See also Supplementary Fig. 2A. E Benchmarking with no match in provided reference: As in D, except bulk transcriptomes are flow sorted immune cells not in the reference (labeled “Unmatched cells”) or pre-B cell acute lymphoblastic leukemias (labeled “Cancer ALL”). See also Supplementary Fig. 2B. Source data are available as a Source Data file.
Fig. 2
Fig. 2. Immaturity score.
A Normal kidney: From 201 bulk transcriptomes from normal kidney an immaturity score was calculated by fitting each bulk transcriptome using a combined mature and fetal kidney cellular signal reference. The immaturity score is the total normalized signal contribution from fetal kidney in each bulk transcriptome (y-axis). The x-axis shows sample age, with unknown age on the right and fetal samples on the left in red. The shaded blue area indicates the range of maturity scores across all normal post-natal transcriptomes. The star indicates that fetal samples have maturity scores significantly higher than normal samples (p=0.015, two-sided Wilcoxon rank sum test). B Adult renal tumors: Immaturity score (as in A) for 853 adult renal tumors, with normal immaturity score range shown by blue shading. The metabolically divergent subtype of Chromophobe renal cell carcinomas have a significantly different maturity score as indicated by the star (p = 5.6 × 10−6 two-sided Wilcoxon rank sum test). C Childhood renal tumors: Immaturity score (as in A) for 287 childhood renal tumors, with normal immaturity score range shown by blue shading. Each type of childhood tumor had a significantly different maturity score than post-natal normal tissue kidneys (p < 2.2 × 10−16 (MRT), 6.8 × 10−14 (CMN), 1.8 × 10−9 (CCSK), < 2.2 × 10−16 (Wilms), and 10−10 (Wilms + Chemo) two-sided Wilcoxon rank sum test). D ccRCCs by PTEN mutation status: Immaturity score for clear cell renal cell carcinomas as calculated in A, split by PTEN mutation status (0 = wild type, 1 = mono-allelic loss, 2 = bi-allelic loss). The star indicates that bi-allelic loss is a significant predictor of higher immaturity score (p = 0.003, two-sided t-test with multiple hypothesis correction). E ccRCCs by transcriptional group: Immaturity score for clear cell renal cell carcinomas as calculated in A, split by transcriptomic subgroups. The star indicates that samples in m3 have a significantly lower immaturity score (p = 2.9 × 10−6, two-sided t-test with multiple hypothesis correction). Source data are available as a Source Data file.
Fig. 3
Fig. 3. Congenital mesoblastic nephromas.
A Composition of bulk CMNs: The relative contribution of single cell derived signals from fetal kidney in explaining the bulk transcriptomes of 18 congenital mesoblastic nephromas (CMNs) along with control leucocyte and ALL populations. The relative contribution of each signal to each bulk RNA-seq sample is shown by the y-axis. Each signal/sample combination is represented by a single point and boxplots shows the distribution with median (middle line), 1st and 3rd quartiles (box limits) and 1.5 times the inter-quartile range (whiskers). Each signal type is abbreviated and colored as per the legend, with squares for fetal and circles for mature. CMN samples are shown on the left and control samples on the right, where “Leukocytes” are bulk transcriptomes from flow sorted leukocytes and “Leukemia” represent B-precursor acute lymphoblastic leukemia. B Expression of CMN cancer genes in fetal kidney: Expression of CMN driver genes (rows) in reference fetal kidney single cell RNA-seq populations (columns), scaled to mean 0 and standard deviation 1 in each row (i.e., z-transformed). C Comparing mesenchymal progenitor cell signals to mature fibroblasts: All 18 CMN bulk transcriptomes were analyzed using a reference signal set including both fetal kidney cells and the fibroblasts from mature kidney. This figure shows the comparison of their inferred contribution to each transcriptome for each sample (y-axis), with lines joining points representing the same sample. D Expression of CMN marker genes: tSNE map of 4,416 single cell transcriptomes from a CMN biopsy, where contours indicate clusters of cells of the type labeled. Cells positive for NTRK3 (left) and EGFR (right) are colored red. B B cell, T T cell, DC dendritic cell, NK NK cell, NKT NKT cell. E Comparison of single cell CMN to fetal kidney: Comparison of clusters of cells from D. (rows) with fetal kidney and leucocyte reference populations (columns). For each CMN cluster/reference population pair a log-similarity score was calculated using logistic regression (see Methods). Positive log-similarity scores represent a high probability of similarity between the reference and test cluster. Source data are available as a Source Data file.
Fig. 4
Fig. 4. Wilms tumor and clear cell sarcoma of the kidney.
A Bulk Wilms tumor and CCSK compared to fetal kidney: The relative contribution of single cell derived signals from fetal kidney in explaining the bulk transcriptomes of 137 nephroblastomas (Wilms tumors) and 13 CCSKs along with control populations. The relative contribution of each signal to each bulk RNA-seq sample is shown by the y-axis. Each signal/sample combination is represented by a single point and boxplots shows the distribution with median (middle line), 1st and 3rd quartiles (box limits) and 1.5 times the inter-quartile range (whiskers). Each signal type is abbreviated and colored as per the legend, with squares for fetal and circles for mature. Wilms/CCSK samples are shown on the left and control samples on the right, where “Leukocytes” are bulk transcriptomes from flow sorted leukocytes and “Leukemia” represent B-precursor acute lymphoblastic leukemia. B UMAP of CCSK and Wilms single cell transcriptomes: Points represents cell transcriptomes from Wilms tumor (left) or CCSK (right), with shading, contours, and labels indicate cell type. C Comparison of CCSK and Wilms transcriptomes to reference signals: Similarity of transcriptomes from B (rows) to fetal kidney reference signals (columns), where color indicates logit similarity. D Comparison of unexplained signal contribution to CCSKs and other tumor types: For each group of samples, the unexplained signal is calculated using the reference set of signals given at the top (e.g., fetal kidney). The unexplained signal fractions are shown by black bars, sorted in increasing order, with the red horizontal line showing the median value and the vertical line the range between the 25th and 75th percentiles. CCSK samples were fitted using 5 different reference sets (fetal and mature kidney, mature kidney only, fetal adrenal, mouse embryo, and the pan-tissue human cell landscape). The final group on the right, represents samples fitted using inappropriate references. This population serves as a calibration of the expected level of unexplained signal when the bulk transcriptome is not explained by any of the provided reference signals. Source data are available as a Source Data file.
Fig. 5
Fig. 5. Malignant rhabdoid tumors.
A Bulk MRTs compared to fetal kidney: The relative contribution of single cell derived signals from fetal kidney in explaining the bulk transcriptomes of 65 malignant rhabdoid tumors (MRTs) along with control populations. The relative contribution of each signal to each bulk RNA-seq sample is shown by the y-axis. Each signal/sample combination is represented by a single point and boxplots shows the distribution with median (middle line), 1st and 3rd quartiles (box limits) and 1.5 times the inter-quartile range (whiskers). Each signal type is abbreviated and colored as per the legend, with squares for fetal and circles for mature. MRT samples are shown on the left and control samples on the right, where “Leukocytes” are bulk transcriptomes from flow sorted leukocytes and “Leukemia” represent B-precursor acute lymphoblastic leukemia. B UMAP of single cell MRT transcriptomes: Each dot represents a single transcriptome from either tumor/tubular derived organoid cells (white), fresh tissue MRTs cells (gray) or archival MRT nuclei (black). Contours indicate tumor cells, stroma, and leucocytes as labeled. C Log similarity of single cell MRT cells to fetal kidney and developing mouse: Comparison of the transcriptomes in B to cellular signals defined from single cell reference transcriptomes. The reference population is indicated on the x-axis and the gray bar on the left indicates the technology each cell was derived from. Each row corresponds to a single transcriptome from B. The color scheme encodes the logit similarity score for each cell against each reference population (see Methods). D Immunohistochemistry of TWIST1 in MRT and normal kidney: Staining of a region of normal kidney and MRT tissue for TWIST1. The MRT image shows a part of the tissue selected for being TWIST1 positive, there were large sections of tumor tissue that were also TWIST1 negative. All normal kidney tissue was TWIST1 negative. This experiment was repeated 3 times and the scale bar (bottom-right) indicates 0.1 mm. Source data are available as a Source Data file.
Fig. 6
Fig. 6. Adult kidney tumors.
A Bulk renal cell carcinomas compared to mature kidney: The relative contribution of single cell derived signals from fetal kidney in explaining the bulk transcriptomes of 171 normal kidney biopsies, 500 clear cell renal cell carcinomas (ccRCC), 274 papillary renal cell carcinomas (pRCC), and 81 chromophobe renal cell carcinomas (ChRCC), along with control populations. The relative contribution of each signal to each bulk RNA-seq sample is shown by the y-axis. Each signal/sample combination is represented by a single point and boxplots shows the distribution with median (middle line), 1st and 3rd quartiles (box limits) and 1.5 times the inter-quartile range (whiskers). Each signal type is abbreviated and colored as per the legend, with squares for fetal and circles for mature. B Mast cell fraction in single cell RCC samples: Bar height indicates mast cell fraction (black) or other cell fraction (gray) in 5 single cell RCC expriments (x-axis labels). C Mast cell signals in bulk RCC transcriptomes: Inverse of mast cell fraction for bulk transcriptomes (dots) of type given on x-axis. Boxplots show the distribution median (middle line), 1st and 3rd quartiles (box limits), and 1.5 times the inter-quartile range beyond the box-limits (whiskers) and the star indicates that mast cell signals are significantly higher in pRCC T1 type tumors than pRCC T2 (two-sided Wilcoxon rank-sum test, p = 1.5 × 10−5). D smFISH validation: An example section of single molecule fluorescence in-situ hybridization imaging of a pRCC T1 tumor section. Nuclei are stained blue with dapi and expression of the tumor marker MET is shown in green and the mast cell marker TPSB2 in purple. See Supplementary Table 4 for a quantification of smFISH applied to pRCC T1/T2 and ccRCC tumors. smFISH imaging was performed on one tumor section from each of pRCC T1, pRCC T2, and ccRCC. The scale bar (bottom-right) indicates approximately 100 μm. E Bulk chromophobe renal cell carcinomas compared to mature kidney: The same as A, but for 81 chromophobe renal cell carcinomas (ChRCC) bulk transcriptomes. Source data are available as a Source Data file.
Fig. 7
Fig. 7. Clinical utility of cellular signal analysis.
A Sensitivity/Specificity of signals in classifying tumor types: Curves showing the sensitivity and specificity of using the scores defined by the color scheme to classify tumors by type at different cut-offs. The different score and tumor type pairs are: fetal interstitial cells and CMN (light blue), intercalated cells and ChRCCs (dark blue), developing nephron and Nephroblastoma (light green), PT1 and ccRCCs/pRCCs (dark green), and mature vascular and ccRCCs (red). B Median reference contribution by tumor type: Each point represents the median score for the group of samples indicated by the combination of shape (tissue type, see legend) and shading (score type, as in A). C Histology image of unclassified childhood renal tumor: The tumor mostly compromised pleomorphic epithelioid cells that formed tubules, papillae, glands and nests, as well as more solid areas with spindled cells and clefting similar to that of synovial sarcoma. Patchy tumor necrosis was apparent. Some areas showed smaller, more uniform cells lining narrow tubular structures, resembling adenomatous perilobar nephrogenic rests. Overall, the morphology and ancillary tests were inconclusive. Scale bars at bottom of each image indicate approximately 100 μm. D Immaturity score for unclassified childhood renal tumor: Calculated as in Fig. 2, with score range for normal post-natal kidney indicated on left. E Summary of signal contribution from fetal and mature kidney to unclassified childhood renal tumor: Each color represents the signal type labeled and fraction of squares of each type matches the signal contribution. F Immaturity score for childhood renal cell carcinoma: As in D. G Summary of signal contribution from fetal and mature kidney to childhood renal cell carcinoma: As in E but for a transcriptome derived from renal cell carcinoma fit using a mature kidney signal set. Source data are available as a Source Data file.

References

    1. Young MD, et al. Single cell transcriptomes from human kidneys reveal the cellular identity of renal tumors. Science. 2018;361:594–599. doi: 10.1126/science.aat1699. - DOI - PMC - PubMed
    1. A, B., P, W. & Jc, Z. SnapShot: TCGA-Analyzed Tumors. Cell173https://pubmed.ncbi.nlm.nih.gov/29625059/ (2018). - PubMed
    1. International Cancer Genome Consortium. et al. International network of cancer genome projects. Nature. 2010;464:993–998. doi: 10.1038/nature08987. - DOI - PMC - PubMed
    1. Behjati, S., Lindsay, S., Teichmann, S. A. & Haniffa, M. Mapping human development at single-cell resolution. Dev. Camb. Engl. 145, (2018). - PubMed
    1. A, R. et al. The Human Cell Atlas. eLife6, e27041 (2017). - PMC - PubMed

Publication types