. 2021 Jun 23;12(1):3868.
doi: 10.1038/s41467-021-24141-5.

Quantitative comparison of geological data and model simulations constrains early Cambrian geography and climate

Affiliations

Quantitative comparison of geological data and model simulations constrains early Cambrian geography and climate

Thomas W Wong Hearing et al. Nat Commun. .

Abstract

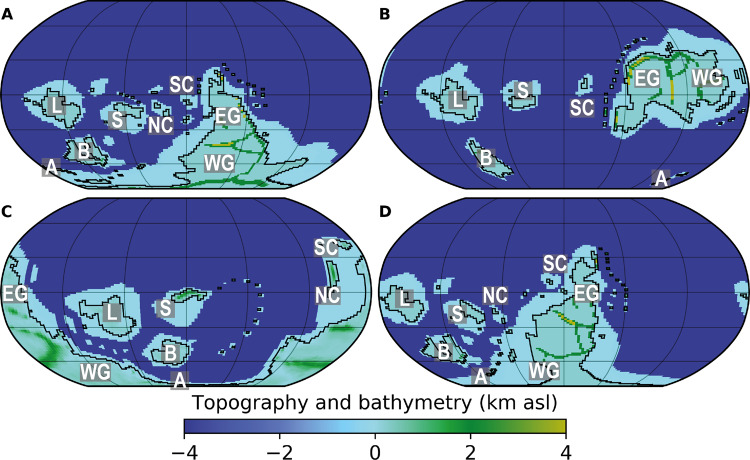
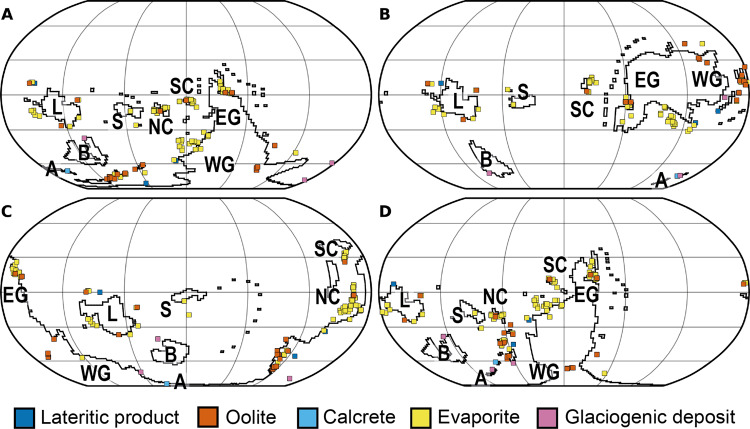
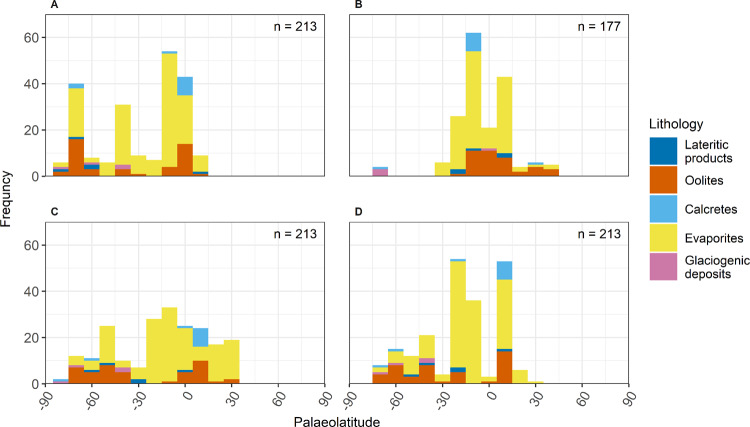
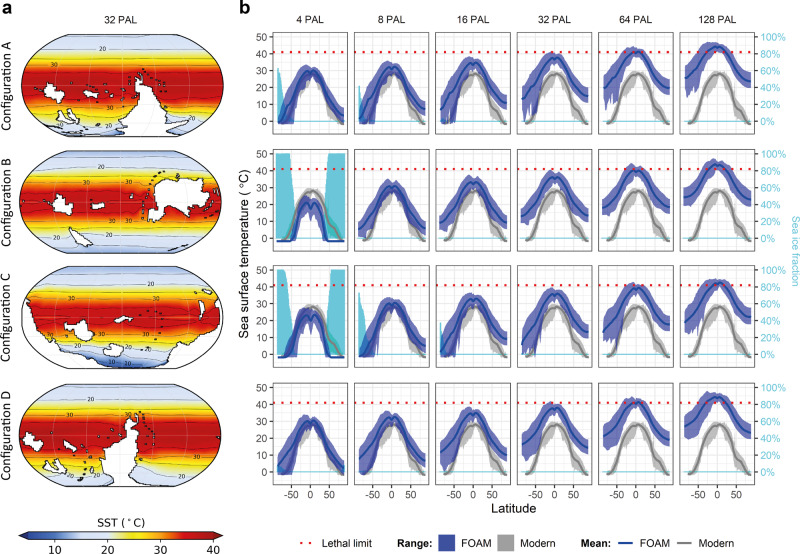
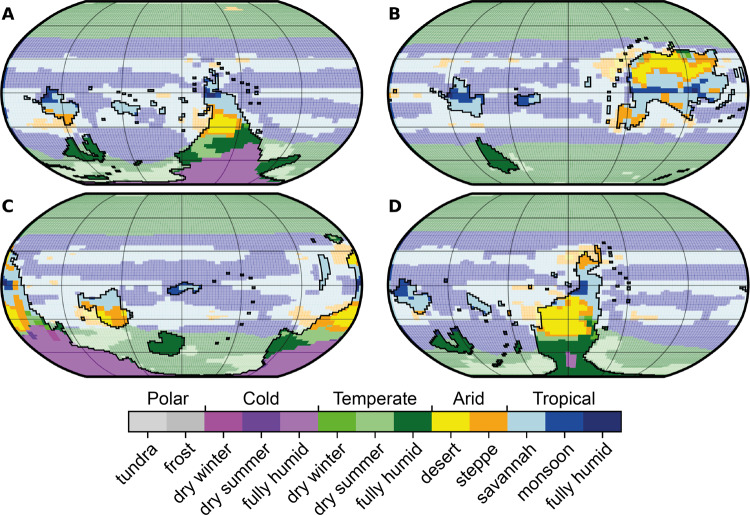
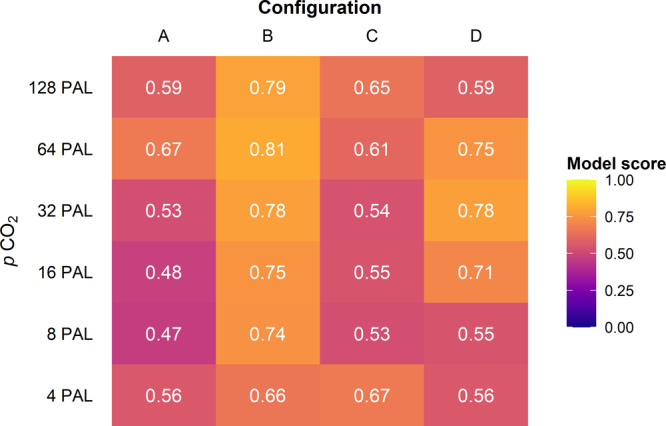
Marine ecosystems with a diverse range of animal groups became established during the early Cambrian (~541 to ~509 Ma). However, Earth's environmental parameters and palaeogeography in this interval of major macro-evolutionary change remain poorly constrained. Here, we test contrasting hypotheses of continental configuration and climate that have profound implications for interpreting Cambrian environmental proxies. We integrate general circulation models and geological observations to test three variants of the 'Antarctocentric' paradigm, with a southern polar continent, and an 'equatorial' configuration that lacks polar continents. This quantitative framework can be applied to other deep-time intervals when environmental proxy data are scarce. Our results show that the Antarctocentric palaeogeographic paradigm can reconcile geological data and simulated Cambrian climate. Our analyses indicate a greenhouse climate during the Cambrian animal radiation, with mean annual sea-surface temperatures between ~9 °C to ~19 °C and ~30 °C to ~38 °C for polar and tropical palaeolatitudes, respectively.


Conflict of interest statement

The authors declare no competing interests.

Figures

Fig. 1
Fig. 1. Four continental configurations (A–D) tested here, overlain with the palaeotopography and palaeobathymetry used in our FOAM simulations.
Configuration A: 510 Ma reconstruction, after refs. . Configuration B: terminal Ediacaran–early Cambrian reconstruction, after refs. ,. Configuration C: 510 Ma reconstruction, after refs. ,. Configuration D: Cambrian reconstruction, after ref. . A: Avalonia; B: Baltica; EG: East Gondwana; L: Laurentia; NC: North China; S: Siberia; SC: South China; WG: West Gondwana; asl: above sea level.
Fig. 2
Fig. 2. Palaeo-positions of lower Cambrian climatically sensitive lithologies plotted on each of the continental configurations (A–D) investigated here.
See Fig. 1 for explanation of the configurations and continent abbreviations.
Fig. 3
Fig. 3. Zonal distribution of lower Cambrian climatically sensitive lithologies for each continental configuration (A–D).
Bin width = 10° latitude. See the Supplementary Information for 5° latitude bin width and breakdown by palaeocontinent. The sample size for configuration B is smaller due to the absence of North China in this configuration,.
Fig. 4
Fig. 4. FOAM GCM simulations of early Cambrian sea-surface temperatures for each continental configuration (A–D) with present-day orbital parameters.
a Maps of simulated SST for configurations A–D at 32 PAL pCO2. b Zonally averaged model (dark blue) SST annual mean and seasonal variation for each configuration and pCO2 forcing, with comparable present-day SST values (grey) from ref. , and lethal temperature limit for animals of 41 °C, following ref. , plotted with mean zonal sea-ice cover (light blue). The sea ice cover represents the percentage of the ocean that is covered by sea ice (yearly average). pCO2 levels relative to PAL (=280 ppm).
Fig. 5
Fig. 5. Simulated distributions of Köppen–Geiger climate classes for each configuration (A–D) simulated with 32 PAL pCO2 and present-day orbital parameters.
Land areas are unfaded and outlined in black, ocean areas are faded. See ‘Methods’ and Supplementary Information for description and discussion of Köppen–Geiger climate classes.
Fig. 6
Fig. 6. Data–model agreement scores for lower Cambrian lithology data and FOAM GCM simulations, incorporating palaeogeographic uncertainty of 200 km.
The scores compare Köppen–Geiger climate classes assigned to climatically sensitive rock types with the climate classes produced under each GCM simulation, following the agreement scoring equation of ref. (see ‘Methods’). Simulations were run with present-day orbital parameters.

References

    1. Erwin, D. H. & Valentine, J. W. The Cambrian Explosion: The Reconstruction of Animal Biodiversity. (Roberts & Co., 2013).
    1. Wood R, et al. Integrated records of environmental change and evolution challenge the Cambrian Explosion. Nat. Ecol. Evol. 2019;3:528–538. doi: 10.1038/s41559-019-0821-6. - DOI - PubMed
    1. Hammarlund EU, et al. Early Cambrian oxygen minimum zone-like conditions at Chengjiang. Earth Planet. Sci. Lett. 2017;475:160–168. doi: 10.1016/j.epsl.2017.06.054. - DOI
    1. Guilbaud, R. et al. Oxygen minimum zones in the early Cambrian ocean. Geochem. Perspect. Lett.10.7185/geochemlet.1806 (2018).
    1. Velde S van de, Mills BJW, Meysman FJR, Lenton TM, Poulton SW. Early Palaeozoic ocean anoxia and global warming driven by the evolution of shallow burrowing. Nat. Commun. 2018;9:2554. doi: 10.1038/s41467-018-04973-4. - DOI - PMC - PubMed

Publication types