. 2021 Jun 23;12(1):3862.
doi: 10.1038/s41467-021-24132-6.

Irreversible electroporation augments checkpoint immunotherapy in prostate cancer and promotes tumor antigen-specific tissue-resident memory CD8+ T cells

Affiliations

Irreversible electroporation augments checkpoint immunotherapy in prostate cancer and promotes tumor antigen-specific tissue-resident memory CD8+ T cells

Brandon J Burbach et al. Nat Commun. .

Abstract

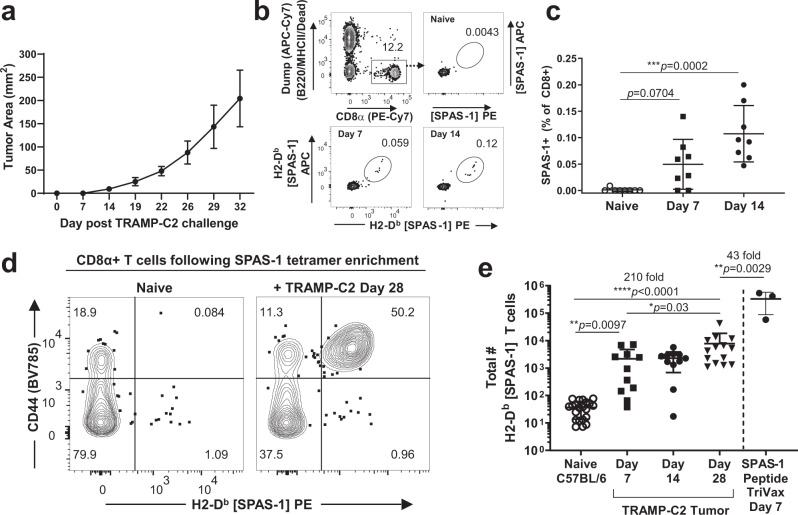
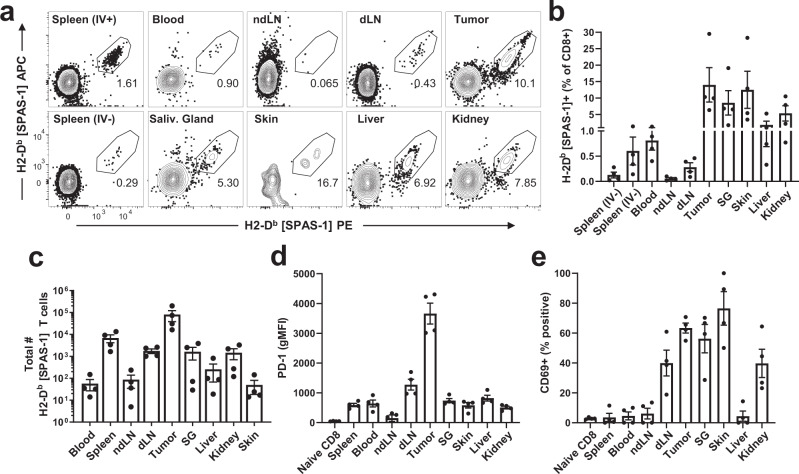
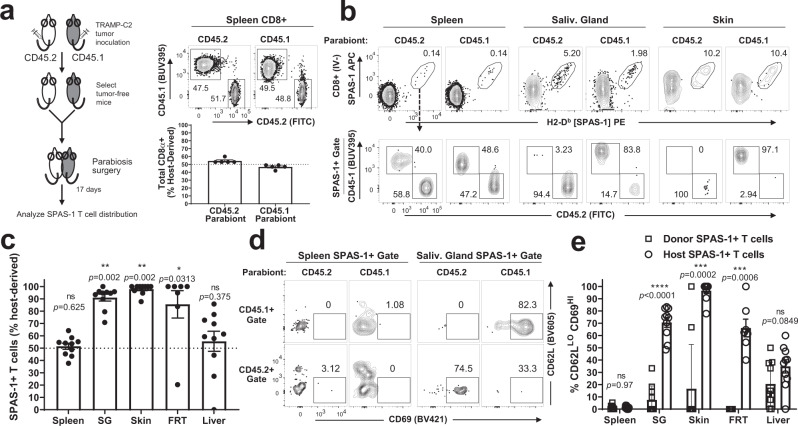
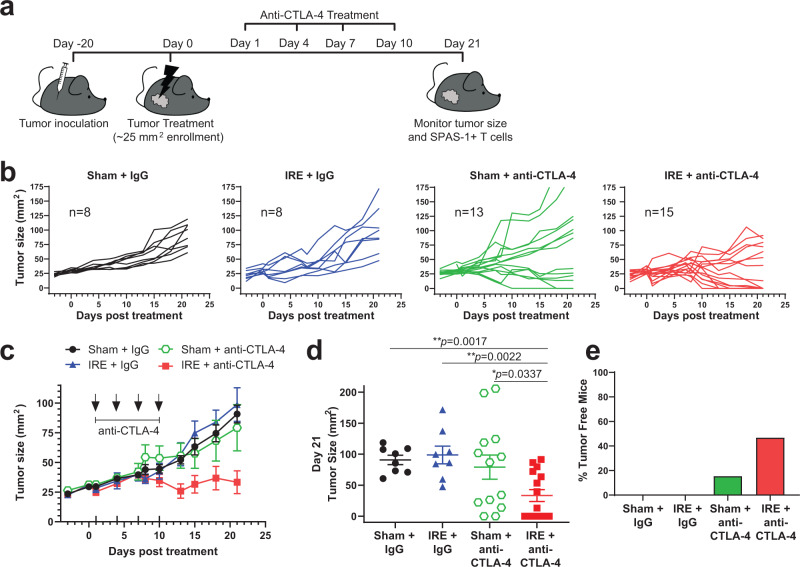
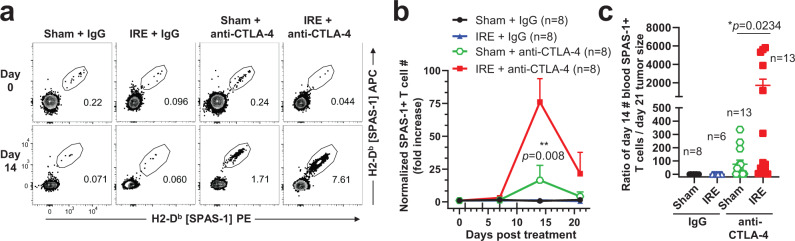
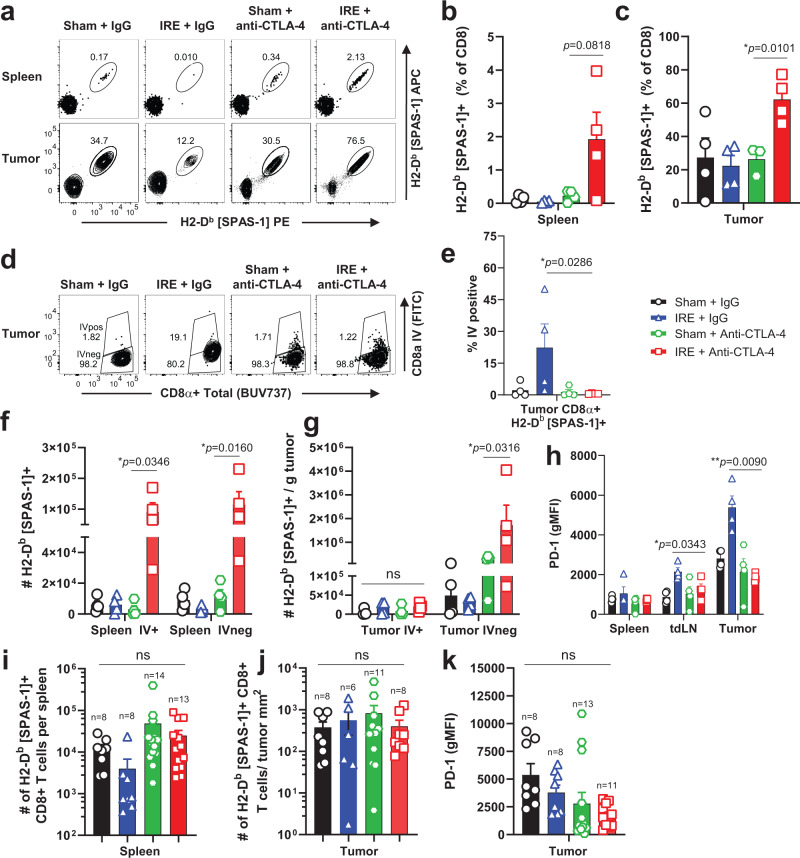
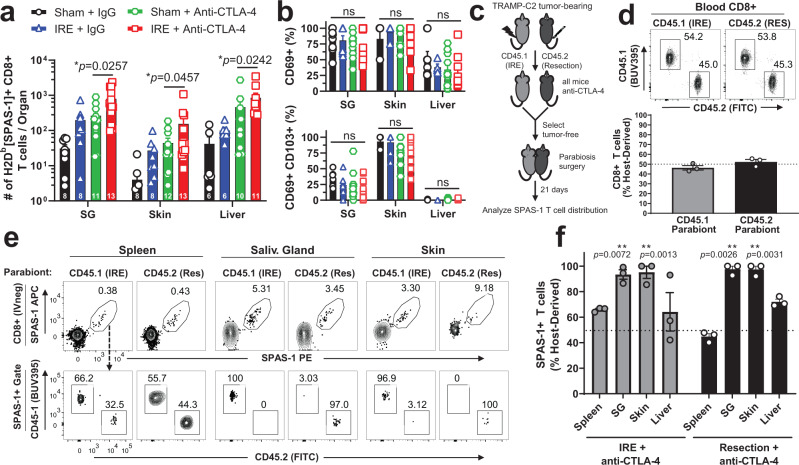
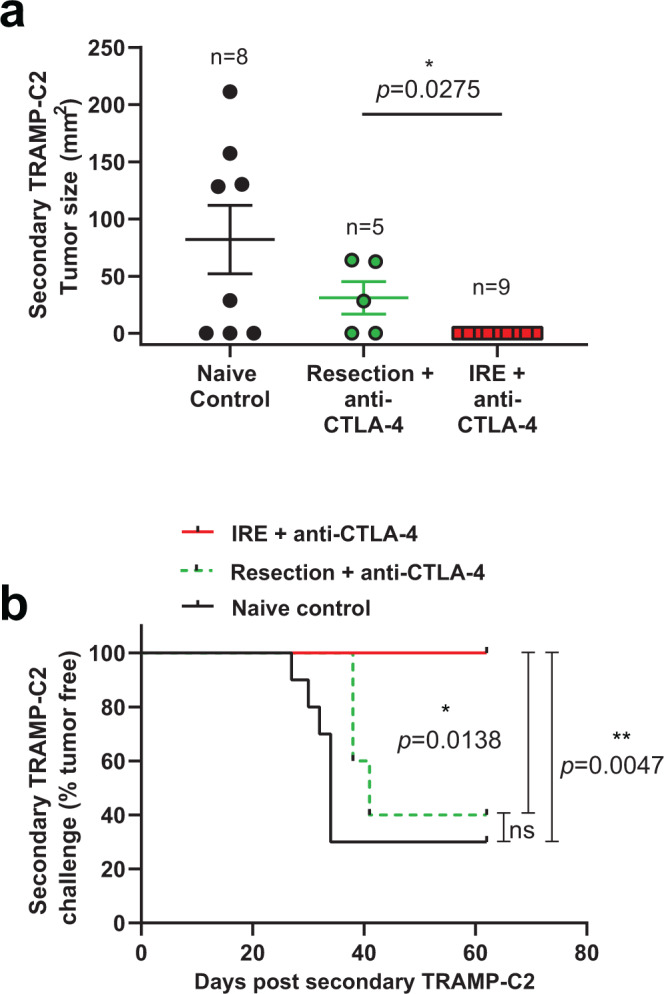
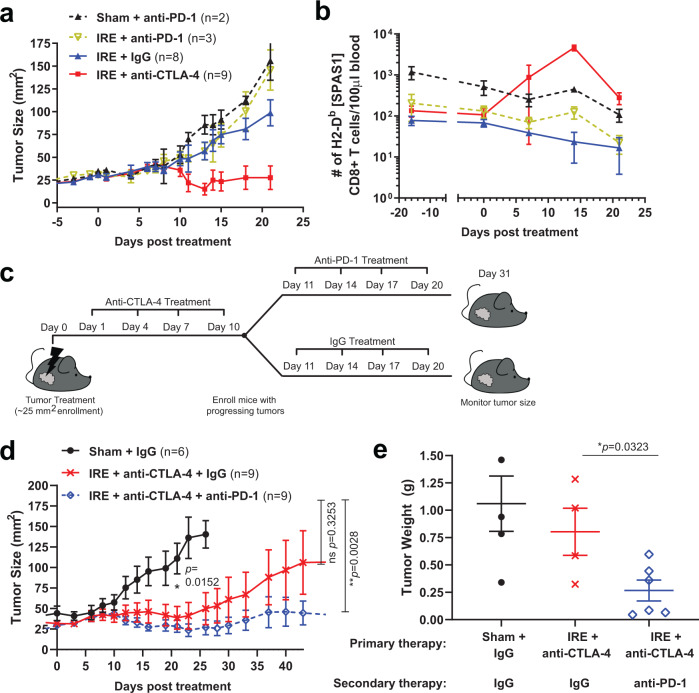
Memory CD8+ T cells populate non-lymphoid tissues (NLTs) following pathogen infection, but little is known about the establishment of endogenous tumor-specific tissue-resident memory T cells (TRM) during cancer immunotherapy. Using a transplantable mouse model of prostate carcinoma, here we report that tumor challenge leads to expansion of naïve neoantigen-specific CD8+ T cells and formation of a small population of non-recirculating TRM in several NLTs. Primary tumor destruction by irreversible electroporation (IRE), followed by anti-CTLA-4 immune checkpoint inhibitor (ICI), promotes robust expansion of tumor-specific CD8+ T cells in blood, tumor, and NLTs. Parabiosis studies confirm that TRM establishment following dual therapy is associated with tumor remission in a subset of cases and protection from subsequent tumor challenge. Addition of anti-PD-1 following dual IRE + anti-CTLA-4 treatment blocks tumor growth in non-responsive cases. This work indicates that focal tumor destruction using IRE combined with ICI is a potent in situ tumor vaccination strategy that generates protective tumor-specific TRM.


Conflict of interest statement

B.F. is employed by Boston Scientific. S.R. retired from BTG plc in 2018. Both B.F. and S.R. provided conceptual and technical oversight to portions of the project. The remaining authors declare no competing interests.

Figures

Fig. 1
Fig. 1. Quantification of SPAS-1 neoantigen-specific CD8+ T cells following TRAMP-C2 tumor challenge.
a TRAMP-C2 cells were injected s.c. in the flank of C57BL/6J mice and tumor growth measured. Average of four mice from one representative experiment of four performed. b Representative flow cytometry staining of blood collected from mice before (naive) and at the indicated times after TRAMP-C2 tumor challenge. SPAS-1+ T cells within the CD8+ T cell gate were identified by dual staining with phycoerythrin (PE)- and allophycocanin (APC)- labeled peptide-MHC-I tetramers loaded with STHVNHLHC peptide specific for the H8 neoantigen of SPAS-1 in TRAMP-C2 cells. c Quantification of staining shown in (b), compiled in multiple mice. Kruskal–Wallace test was performed, p = 0.0005, with exact p values by Dunn’s multiple comparision test; ***p < 0.001. Results in (ac) are representative of four independent experiments performed. (d, e) Single-cell suspensions of pooled spleen and peripheral lymph nodes from naive tumor-bearing mice were incubated with PE- and APC- fluorochrome tetramerized H2-Db SPAS-1. Tetramer-binding cells were captured by enrichment over anti-flurochrome magnetic beads and then stained for flow cytometry. d Representative flow cytometry staining of gated CD8+ T cells after tetramer enrichment showing expression of PE-labeled tetramer and CD44. e Quantified and pooled data showing values for individual naive (n = 21) or TRAMP-C2 challenged mice at days 7, 14, and 28 (n = 11, 11, and 14, respectively). Data are derived from 5, 3, and 4 independent experiments, respectively, for naive, day 7 and 14, and day 28 following tumor challenge. For SPAS-1 tetramer enrichment from naive mice injected i.v. with the SPAS-1 peptide in the presence of Poly I:C and anti-CD40 (TriVax), one representative experiment with three biological replicates is shown, of two similar experiments performed. Kruskal–Wallace test was performed, p < 0.0001, with exact p values by Dunn’s multiple comparison test; *p < 0.05, **p < 0.001, ****p < 0.0001. Bars represent mean ± S.E.M. Source data are provided as a Source Data File.
Fig. 2
Fig. 2. SPAS-1+ T cells are broadly distributed in lymphoid and non-lymphoid tissues following TRAMP-C2 tumor challenge.
Mice were challenged s.c. with TRAMP-C2 in the flank and necropsies were performed 28 days later. Mice were injected i.v. with 3 µg of FITC-labeled anti-CD8α antibody 3 min prior to harvest, to identify CD8+ T cells in the circulation. Single-cell suspensions from the indicated organs were prepared (see Methods) and stained for flow cytometry. a Representative FACS plots showing dual fluorescent staining for SPAS-1 tetramer within the CD8+ IV- gate (see Supplementary Fig. 1a, b). b, c Quantification of replicate mice showing the frequency and total number of SPAS-1+ T cells. de Expression of PD-1 and CD69, respectively, on gated IV- SPAS-1+ T cells. See also Supplementary Fig. 1c. Results in (be) represent four biologically independent replicates from three independent experiments assessing SPAS-1+ CD8+ T cells in these tissues. Bars represent mean ± S.E.M. IV intravascular (− or +), SG salivary gland, dLN tumor-draining lymph node, ndLN non-draining LN. Source data are provided as a Source Data File.
Fig. 3
Fig. 3. SPAS-1+ memory T cells in non-lymphoid tissues are tissue resident.
Female CD45.2 and CD45.1 mice were challenged s.c. in opposite flanks with TRAMP-C2 tumor cells. Mice lacking tumors 6 weeks later but exhibiting residual SPAS-1+ CD8+ memory T cell response in the blood were selected. a Schematic of experimental design. Parabiosis was performed to surgically join the circulation of challenged but tumor-free CD45.2 and CD45.1 mice. After 17 days of equilibration, mice in each pair were individually injected i.v. with 3 µg of FITC-labeled anti-CD8α antibody 3 min prior to harvest, to mark CD8+ T cells in the circulation. Single-cell suspensions from the indicated organs were prepared and stained for flow cytometry. CD8+ T cells from the spleen of one parabiotic pair are discriminated with antibodies to CD45.2 and CD45.1, quantified in the bottom graph. Data points in (a), (c), (e) reflect individual biological replicate mouse pairs (five pairs total), from one of two similar experiments performed. b Representative flow plots visualizing three different tissues of a single parabiotic pair. Top row, SPAS-1+ gate in CD8+ IV- T cells. Bottom row, CD45.2, and CD45.1 staining of SPAS-1+ T cells from the plot above. c Quantification of data from five parabiotic pairs, calculating the proportion of SPAS-1+ T cells in each tissue that was derived from the host mouse as fraction of the total from both host and donor mouse. Significance was determined by two-sided Wilcoxon sign-rank test with a theoretical value of 50; *p < 0.05; **p < 0.01. d Representative flow plots showing the expression of CD62L and CD69 cell surface phenotype of IV- SPAS-1+ T cells from each partner, separated by partner. e Quantification of the fraction of CD62LloCD69hi SPAS-1 T cells in each mouse, derived from the host or donor partner. Unpaired two-sided Mann–Whitney test was performed; ***p < 0.001; ****p < 0.0001. All error bars represent mean ± S.E.M. IV intravascular, SG salivary gland, FRT female reproductive tract. Source data are provided as a Source Data File.
Fig. 4
Fig. 4. Irreversible electroporation augments anti-CTLA-4 therapy and improves tumor outcome.
a Schematic of experimental design. Briefly, mice were injected intradermal (i.d.) with 1.0 × 106 TRAMP-C2 cells into the right flank, and animals were enrolled into the indicated treatment group when their tumor reached 4–5 mm in diameter. b Individual tumor growth curves following each treatment, with the time synchronized to treatment on day 0. c Averaged tumor growth curves from (b). d Individual tumor sizes on day 21 from each treatment group in (b). e Fraction of tumor-free mice from each group, at day 21 post-treatment. Data in (be) reflect n = 8–15 mice/group pooled from four independent experiments, with exact n shown on panel b Unpaired two-tailed Mann–Whitney test was performed; *p < 0.05; **p < 0.01. Bars represent mean ± S.E.M. Source data are provided as a Source Data File.
Fig. 5
Fig. 5. SPAS-1+ T cells are increased in the blood following combination therapy and predict tumor outcome.
Mice bearing TRAMP-C2 tumors were treated as in Fig. 4. a Representative SPAS-1 tetramer staining of CD8+ T cells in peripheral blood at days 0 and 14 following the indicated treatment. b The absolute number of SPAS-1+ T cells per 100 µl of blood was calculated at days 7, 14, and 21 following treatment and normalized to the baseline in each mouse at day 0. c Ratio of the number of SPAS-1+ T cells per 100 µl of the blood of each mouse at day 14 over the endpoint tumor size at day 21. Data in (b) represent blood tested in n = 8 individual mice/group. c n = 6–13 individual mice/group, with exact n shown for each group. Data pooled from four independent experiments. Bars represent mean ± S.E.M. Unpaired two-tailed Mann–Whitney test was performed; *p < 0.05, **p < 0.01 Source data are provided as a Source Data File.
Fig. 6
Fig. 6. Combination therapy is associated with increased numbers of tumor-specific SPAS-1+ T cells in spleen and tumors.
Mice bearing ~4–5 mm diameter TRAMP-C2 tumors were treated with Sham, IRE, and/or anti-CTLA-4 as in Fig. 4. On day 14 (ah) or day 21 (ik) following therapy, single-cell suspensions from the indicated tissues were analyzed by flow cytometry. Data in (bh) represent individual mice (n = 4/group) pooled from two independent experiments, and ik represent individual mice (n = 6–14/group) pooled from four independent experiments, with exact n shown for each group. a Representative tetramer staining of SPAS-1 from spleen and tumor samples in each treatment group, gated on Live, Thy1.2+ CD8+ T cells. b, c Frequency of SPAS-1+ T cells in spleen and tumor, respectively. Intravascular (IV) anti-CD8α was injected 3 min prior to sacrifice. d, e Representative flow cytometry plots and quantification, respectively, gated on Thy1.2+ CD8 + SPAS-1+ T cells, showing IV CD8α stain used to segregate the IV-negative and -positive fractions from each treatment group. fg Total number of SPAS-1+ CD8+ T cells in the indicated IV fraction of spleen and tumor, respectively. h, k PD-1 expression at days 14 and 21, respectively. ij Total number of SPAS-1+ T cells in the IV-negative fractions of spleen and tumor, respectively at day 21 following the start of therapy. Bars represent mean ± S.E.M. b, c, ek, Unpaired two-tailed T test with Holm-Sidak’s correction was performed; ns, not significant, *p < 0.05, **p < 0.01. Source data are provided as a Source Data File.
Fig. 7
Fig. 7. Combination therapy is associated with increased numbers of tissue-resident memory SPAS-1+ T cells in non-lymphoid tissues.
Mice bearing TRAMP-C2 tumors were treated as in Fig. 4. a 21 days following therapy, the number of SPAS-1 + T cells was quantified by flow cytometry from the indicated tissues. b Percentage of SPAS-1+ T cells identified in (a) that express CD69 (top panel) or CD69 and CD103 (bottom panel). Data in (a, b) represent individual mice (n = 8–13/group) pooled from four independent experiments, with exact n for each group shown at the base of each bar for each tissue. The exact n values for the number of samples analyzed in (b) are shown in the Source Data File. c TRAMP-C2 tumors were inoculated i.d. into CD45.1 and CD45.2 mice and tumors were removed by IRE or surgical resection, respectively, followed by anti-CTLA-4, every third day for four total doses. Mice that cleared tumors were selected and rested for three additional weeks, and parabiosis surgery was performed. d Flow cytometry of blood collected from each partner mouse 17 days after surgery, showing the fraction of host-derived total CD8+ cells from each parabiont in a representative FACS plot (top) and quantified for 3 pairs of mice (bottom). e After 21 days of equilibration, mice in each pair were individually injected i.v. with 3 µg of FITC-labeled anti-CD8α antibody 3 min prior to harvest, to mark CD8+ T cells in the circulation. Single-cell suspensions from the indicated organs were prepared and stained for flow cytometry. Top row, SPAS-1+ T cell gating from the IV-CD8+ T cell population from the indicated organs of each congenically distinct partner is shown. Bottom row, SPAS-1+ T cells from each partner are discriminated by CD45.1 and CD45.2 to determine the partner of origin. f Quantification of data from 3 parabiotic pairs, separated by treatment group. The proportion of SPAS-1+ T cells in each tissue that were derived from the host mouse is presented as a fraction of the total from both host and donor mice. ab Data pooled from four independent experiments. Unpaired two-tailed Mann–Whitney test was performed; *p < 0.05. cf Data representative of one experiment with 3 parabiotic pairs. One sample T test with a hypothetical value of 50 was performed; ns, not significant; **p < 0.01. All bars represent mean ± S.E.M. SG salivary gland. Source data are provided as a Source Data File.
Fig. 8
Fig. 8. IRE plus anti-CTLA-4 combination therapy is associated with protection from secondary tumor challenge.
TRAMP-C2 tumors were inoculated into the right flank of C57BL/6J mice and allowed to grow to ~4–5 mm diameter. Tumors were removed by IRE or surgical resection, followed by treatment with four doses of anti-CTLA-4. Tumor-free mice were selected and rested for three additional weeks when mice were re-challenged in the left flank with 1.0 × 106 TRAMP-C2 cells. a Tumor size 42 days after secondary tumor challenge, with exact n values shown and data points reflecting independent biological replicate mice. Age-matched naive mice were used as a control, demonstrating typical ~60–70% tumor “take” rate. Bars represent mean ± SEM. Unpaired two-tailed Mann–Whitney test was performed; *p < 0.05. b Kaplan–Meier curves from the mice in (a), noting the day of tumor incidence following secondary tumor challenge. Two-sided Mantel-Cox log rank test was performed; *p < 0.05; **p < 0.01. Source data are provided as a Source Data File.
Fig. 9
Fig. 9. Anti-PD-1 treatment following IRE plus anti-CTLA-4 combination therapy sustains tumor regression.
a Mice bearing TRAMP-C2 tumors were treated with IRE or sham, followed by either IgG, anti-CTLA-4 or anti-PD-1 as indicated. Average tumor growth is shown. b The absolute number of SPAS-1+ T cells per 100 µl of blood was determined by flow cytometry at days 0, 7, 14, and 21 following treatment in a. Data in (a) reflects 2–9 independent mice treated per group, of one representative experiment performed. Exact n values are shown for each group, with bars representing the mean ± S.E.M. Data in (b) reflects the analysis of blood from two independent mice from the experiment in (a), depicted as the mean ± the range. c Schematic of experimental design. Mice were injected in the flank with TRAMP-C2 cells as in Fig. 4. Tumors reaching 4–5 mm diameter were treated with IRE on day 0, followed by anti-CTLA-4 on days 1, 4, 7, and 10. On day 11, mice were randomly grouped for secondary therapy with 4 doses every 3 days of either IgG (control) or anti-PD-1. d Average tumor growth of each treatment arm, reflecting compiled data from n = 6–9 mice/group, pooled from two independent experimental cohorts. Unpaired two-tailed Mann–Whitney test was performed; *p < 0.05, **p < 0.01. All individual mice are shown in Supplementary Fig. 8b. e Surviving mice from (d) were euthanized on day 53 and tumors weighed; n = 4 for Sham + IgG and IRE + anti-CTLA-4 + IgG, n = 6 for IRE + anti-CTLA-4 + anti-PD-1. Unpaired two-tailed student’s T test was performed; *p < 0.05. Bars in (de) represent mean ± S.E.M. Source data are provided as a Source Data File.

References

    1. Yang Y. Cancer immunotherapy: harnessing the immune system to battle cancer. J. Clin. Invest. 2015;125:3335–3337. doi: 10.1172/JCI83871. - DOI - PMC - PubMed
    1. Lizee G, et al. Harnessing the power of the immune system to target cancer. Annu. Rev. Med. 2013;64:71–90. doi: 10.1146/annurev-med-112311-083918. - DOI - PubMed
    1. Zappasodi R, Merghoub T, Wolchok JD. Emerging concepts for immune checkpoint blockade-based combination therapies. Cancer Cell. 2018;33:581–598. doi: 10.1016/j.ccell.2018.03.005. - DOI - PMC - PubMed
    1. Galluzzi, L., Chan, T. A., Kroemer, G., Wolchok, J. D. & Lopez-Soto, A. The hallmarks of successful anticancer immunotherapy. Sci. Transl. Med.10, eaat7807 (2018). - PubMed
    1. Schenkel JM, Masopust D. Tissue-resident memory T cells. Immunity. 2014;41:886–897. doi: 10.1016/j.immuni.2014.12.007. - DOI - PMC - PubMed

Publication types

MeSH terms

Substances