. 2021 Jun 23;12(1):3903.
doi: 10.1038/s41467-021-24078-9.

COVseq is a cost-effective workflow for mass-scale SARS-CoV-2 genomic surveillance

Affiliations

COVseq is a cost-effective workflow for mass-scale SARS-CoV-2 genomic surveillance

Michele Simonetti et al. Nat Commun. .

Abstract

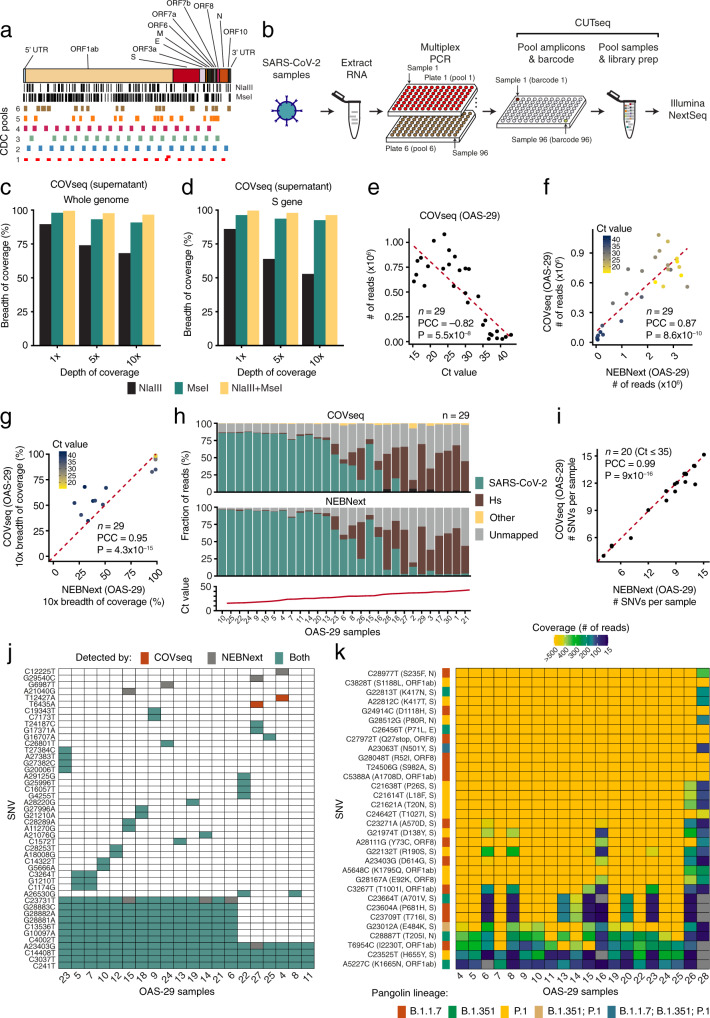
While mass-scale vaccination campaigns are ongoing worldwide, genomic surveillance of severe acute respiratory syndrome coronavirus 2 (SARS-CoV-2) is critical to monitor the emergence and global spread of viral variants of concern (VOC). Here, we present a streamlined workflow-COVseq-which can be used to generate highly multiplexed sequencing libraries compatible with Illumina platforms from hundreds of SARS-CoV-2 samples in parallel, in a rapid and cost-effective manner. We benchmark COVseq against a standard library preparation method (NEBNext) on 29 SARS-CoV-2 positive samples, reaching 95.4% of concordance between single-nucleotide variants detected by both methods. Application of COVseq to 245 additional SARS-CoV-2 positive samples demonstrates the ability of the method to reliably detect emergent VOC as well as its compatibility with downstream phylogenetic analyses. A cost analysis shows that COVseq could be used to sequence thousands of samples at less than 15 USD per sample, including library preparation and sequencing costs. We conclude that COVseq is a versatile and scalable method that is immediately applicable for SARS-CoV-2 genomic surveillance and easily adaptable to other pathogens such as influenza viruses.


Conflict of interest statement

The authors declare no competing interests.

Figures

Fig. 1
Fig. 1. COVseq implementation and validation.
a Location along the Severe Acute Respiratory Syndrome Coronavirus 2 (SARS-CoV-2) genome (top) of MseI and NlaIII recognition sites (vertical black bars) and Centers for Disease Control and Prevention (CDC) multiplexed PCR assay amplicon pools (colored rectangles). Gene names (top) are according to the reference SARS-CoV-2 sequence NC_045512.2. b Schematic high-throughput COVseq workflow. Purified RNA samples (e.g., extracted from nasal- or oro-pharyngeal swabs) are first equally distributed in corresponding wells of six 96-well plates and amplified using six different PCR primer pools (one pool per plate) to amplify the amplicons shown in (a). After PCR, the contents of the wells in the six 96-well plates are pooled into the corresponding wells of a new 96-well plate and purified. Afterwards, 96 CUTseq adapters (see Supplementary Data 2) are used to barcode each sample individually, before all the samples are pooled together into the same sequencing library. Alternatively, 384 samples can be barcoded separately before being pooled together, by using the 384 CUTseq adapters listed in Supplementary Data 2. c Percentage of bases in the SARS-CoV-2 reference genome covered by COVseq at varying sequencing depths (SE150 sequencing) for three different libraries prepared from RNA extracted from the supernatant of a viral culture, using genome digestion with one or two restriction enzymes (MseI and NlaIII). d Same as in (c), but for the S gene encoding the spike protein. e Inverse correlation between the cycle threshold (Ct) determined by RT-PCR and the number of reads, for OAS-29 samples (see Supplementary Data 4) sequenced by COVseq (MiSeq PE300). f Correlation between the total number of reads obtained with COVseq vs. NEBNext for the same samples in (e). g Correlation between the breadth of coverage at 10× sequencing depth obtained by COVseq vs. NEBNext for the same samples in (e). h Percentage of sequencing reads aligned to the SARS-CoV-2 reference genome, human reference genome (Hs), other genomes or unmapped, for the same samples in (e). The bottom plot shows the Ct value of each sample. i Correlation between the number of single-nucleotide variants (SNVs) per sample detected by COVseq (PE300) vs. NEBNext (SE75) in 20 (n) out of 29 OAS-29 samples with Ct ≤ 35. j Matrix showing the SNVs detected by COVseq, NEBNext, or both in the 20 OAS-29 samples with Ct ≤ 35. k Heatmap of the depth of coverage at the genomic positions of all the SNVs defining the UK (B.1.1.7), South African (B.1.351) and Brazilian (P.1) variants of concern (VOC) for the 20 OAS-29 samples with Ct ≤ 35 sequenced by COVseq. Gray color indicates locations that would have insufficient coverage to call SNVs (< 15 reads). In brackets: amino acid change and SARS-CoV-2 gene affected. In (eg) and (i): each dot represents a sample; n number of samples, PCC Pearson’s correlation coefficient, P, t-test, two-tailed. In (e) and (f), the dashed red line represents the linear regression fit. In (g) and (i), the dashed red line is the bisector. In (f) and (g), each sample is color-coded based on the corresponding Ct value. For sample IDs in (h) and (j, k), see Supplementary Data 4. OAS Ospedale Amedeo di Savoia.
Fig. 2
Fig. 2. COVseq reproducibility.
a Breadth of coverage at 10× sequencing depth for three replicate (Rep) COVseq libraries each including 95 samples (samples OAS-95 in Supplementary Data 4). b Correlation matrix showing the Pearson’s correlation coefficient (PCC) of the breadth of coverage at 10× sequencing depth between the three replicate (Rep) libraries shown in (a). c Same as in (b), but for the number of single-nucleotide variants (SNVs) in each of the OAS-95 samples. d Bar plot showing the number (n) of SNVs shared by two or three of the Rep libraries in (a). e Matrix showing the list of all SNVs detected in the OAS-95 samples, in one, two, or all of the Rep libraries. The samples were ranked based on their similarity. The Pangolin lineage assigned to each sample is shown at the bottom. For sample IDs, see Supplementary Data 4. OAS Ospedale Amedeo di Savoia.
Fig. 3
Fig. 3. Phylogenetic analyses using COVseq data.
a Newick trees showing the phylogeny of the 179 samples sequenced by COVseq together with 909 randomly selected SARS-CoV-2 sequences downloaded from the global initiative on sharing of influenza data (GISAID), including 277 sequences from Italy and 646 from the rest of the world. Colors indicate the geographical origin of the samples. Dashed rectangle: cluster of 87 (n) cases from a nosocomial outbreak that occurred in January 2021 at a hospital in Turin, Italy and involved three different wards (orthopedics, cardiology, and internal medicine). b Same tree as in (a), but with colors indicating the operational taxonomic unit (OTU) clades. Abbreviations refer to the different clades. NA not assigned. c Magnified view of the cluster encircled by the dashed rectangle in (a) and (b). n number of samples.
Fig. 4
Fig. 4. COVseq applicability for SARS-CoV-2 genomic surveillance.
a Cumulative reagent cost curves for preparing sequencing libraries from up to 10,000 samples by COVseq using the CDC (CDC-COVseq) or ARTIC (ARTIC-COVseq) multiplexed PCR strategy vs. three different commercial kits (CleanPlex, NEBNext, and Nextera). CDC Centers for Disease Control and Prevention. b Same as in (a), but for up to 1000 samples. c Average cost per sample based on the final cumulative cost and total number of samples shown in (a) and (b). See Supplementary Notes for a detailed description of how the cost analysis was performed. d Same as in (c), but for up to 10,000 samples.

References

    1. Zhu N, et al. A novel coronavirus from patients with pneumonia in China, 2019. N. Engl. J. Med. 2020;382:727–733. doi: 10.1056/NEJMoa2001017. - DOI - PMC - PubMed
    1. Elbe S, Buckland‐Merrett G. Data, disease and diplomacy: GISAID’s innovative contribution to global health. Glob. Chall. 2017;1:33–46. doi: 10.1002/gch2.1018. - DOI - PMC - PubMed
    1. Mercatelli D, Giorgi FM. Geographic and genomic distribution of SARS-CoV-2 mutations. Front. Microbiol. 2020;11:1800. doi: 10.3389/fmicb.2020.01800. - DOI - PMC - PubMed
    1. Preliminary genomic characterisation of an emergent SARS-CoV-2 lineage in the UK defined by a novel set of spike mutations. Virologicalhttps://virological.org/t/preliminary-genomic-characterisation-of-an-eme... (2020).
    1. Tegally, H. et al. Emergence and rapid spread of a new severe acute respiratory syndrome-related coronavirus 2 (SARS-CoV-2) lineage with multiple spike mutations in South Africa. medRxiv10.1101/2020.12.21.20248640 (2020).

Publication types