. 2021 Jun 23;12(1):3904.
doi: 10.1038/s41467-021-24009-8.

Co-evolution of matrisome and adaptive adhesion dynamics drives ovarian cancer chemoresistance

Affiliations

Co-evolution of matrisome and adaptive adhesion dynamics drives ovarian cancer chemoresistance

Elina A Pietilä et al. Nat Commun. .

Abstract

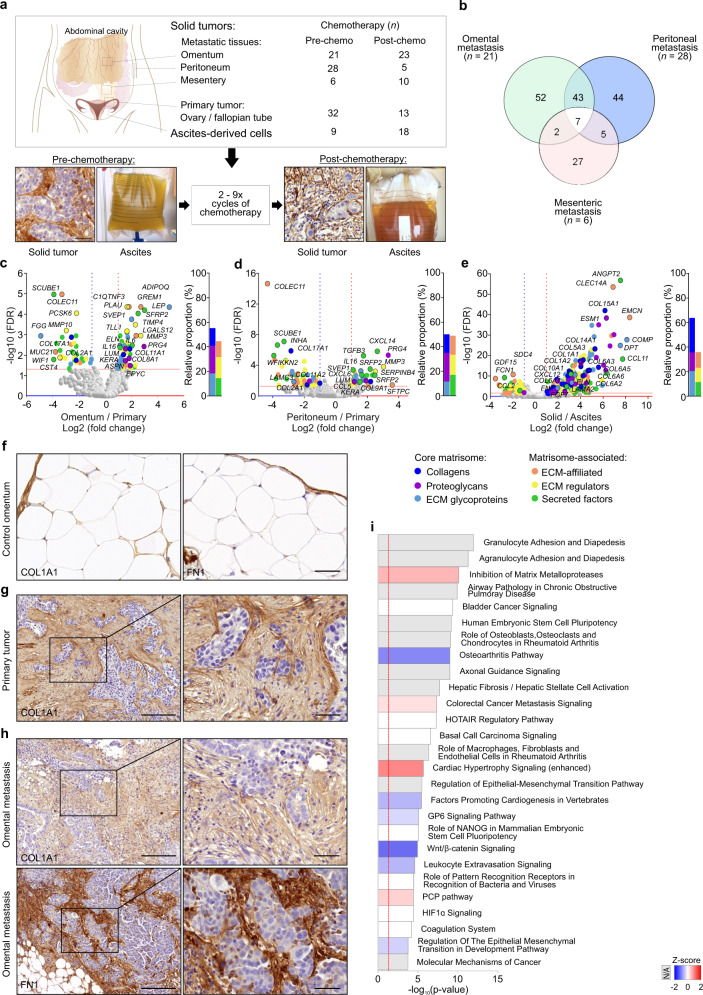
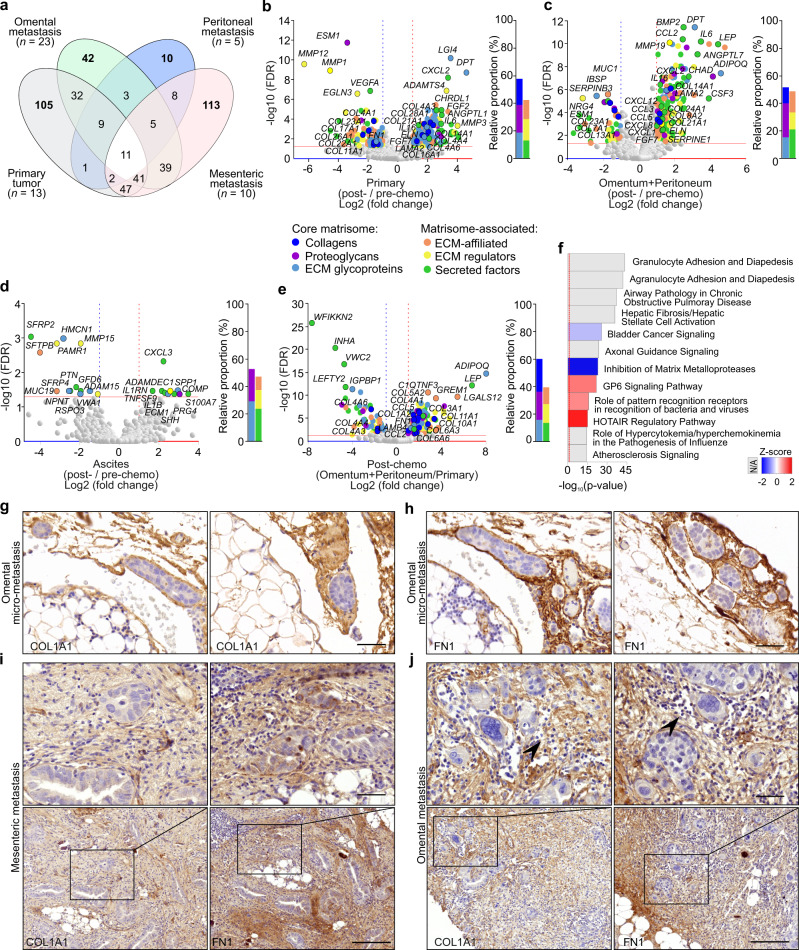
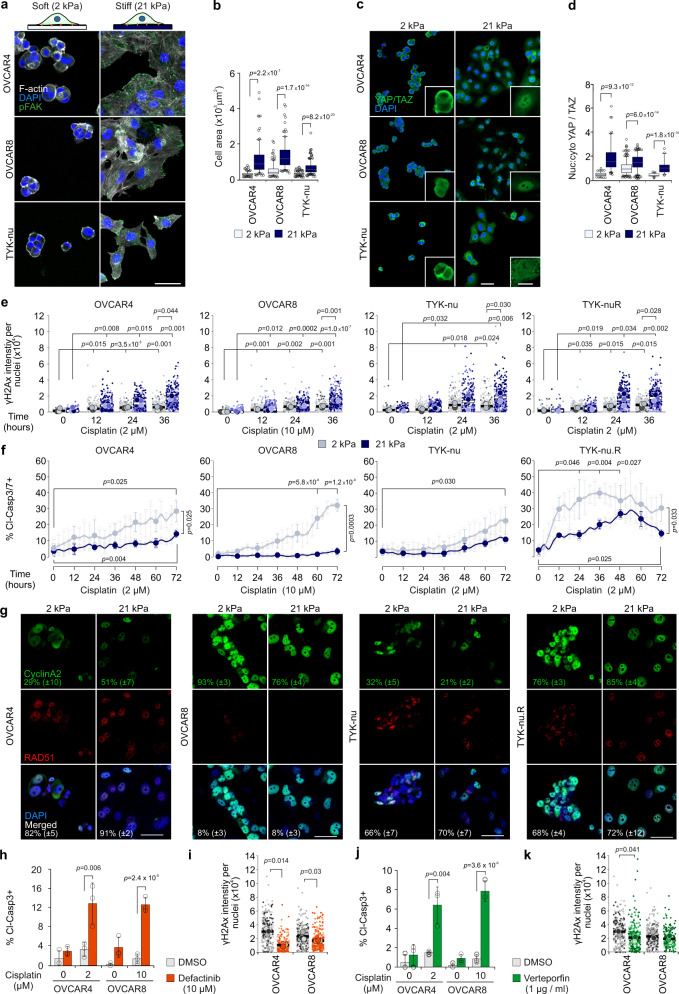
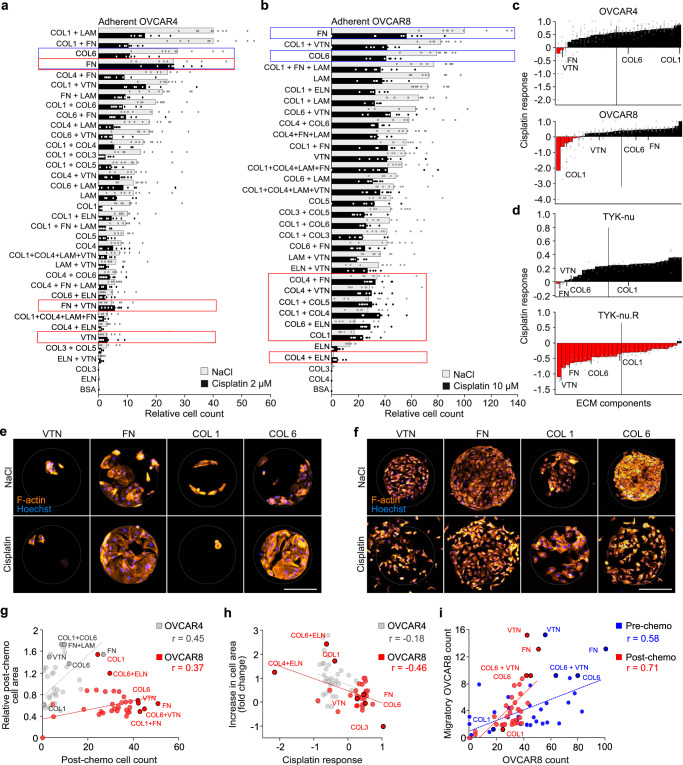
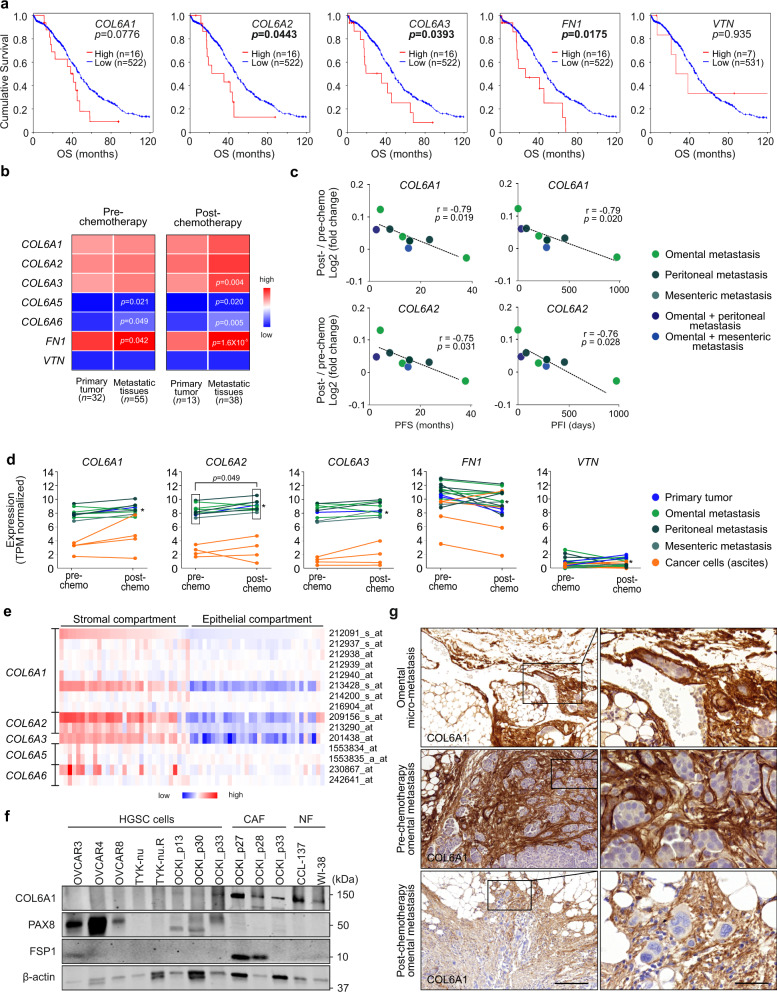
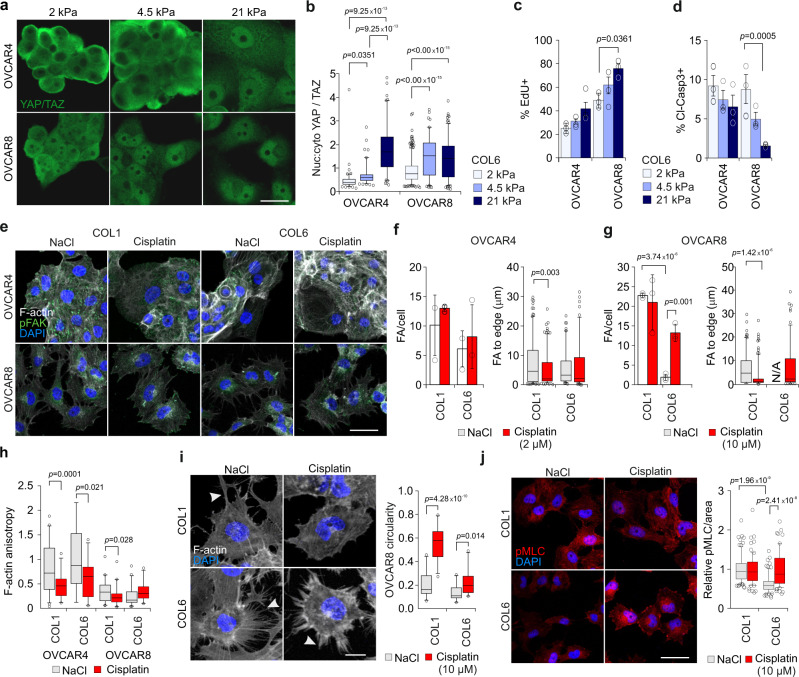
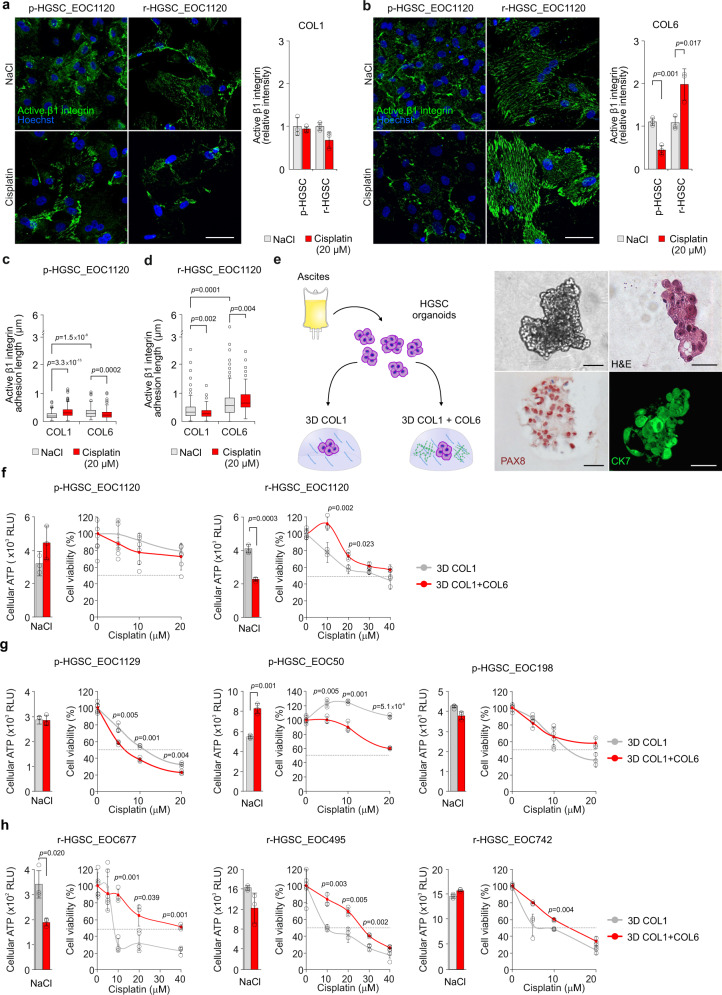
Due to its dynamic nature, the evolution of cancer cell-extracellular matrix (ECM) crosstalk, critically affecting metastasis and treatment resistance, remains elusive. Our results show that platinum-chemotherapy itself enhances resistance by progressively changing the cancer cell-intrinsic adhesion signaling and cell-surrounding ECM. Examining ovarian high-grade serous carcinoma (HGSC) transcriptome and histology, we describe the fibrotic ECM heterogeneity at primary tumors and distinct metastatic sites, prior and after chemotherapy. Using cell models from systematic ECM screen to collagen-based 2D and 3D cultures, we demonstrate that both specific ECM substrates and stiffness increase resistance to platinum-mediated, apoptosis-inducing DNA damage via FAK and β1 integrin-pMLC-YAP signaling. Among such substrates around metastatic HGSCs, COL6 was upregulated by chemotherapy and enhanced the resistance of relapse, but not treatment-naïve, HGSC organoids. These results identify matrix adhesion as an adaptive response, driving HGSC aggressiveness via co-evolving ECM composition and sensing, suggesting stromal and tumor strategies for ECM pathway targeting.


Conflict of interest statement

The authors declare no competing interests.

Figures

Fig. 1
Fig. 1. The matrisomes of pre-chemotherapy omental and peritoneal metastases differ from primary tumor matrisome.
a Schematic diagram, micrographs, and images showing the anatomical locations and the types of samples collected from high-grade serous carcinoma (HGSC) patients, n = number of samples. Scale bar = 20 µm. b Venn diagram illustrates the number of differentially expressed genes (DEGs) encoding matrisome proteins in pre-chemotherapy HGSC omental (n = 21), peritoneal (n = 28), and mesenteric (n = 6) metastatic tissues in comparison to primary tumor (n = 32). ce Volcano plots and corresponding charts indicate a strong core matrisome expression in omental (c n = 21) and peritoneal (d n = 28) metastases against primary tumor (n = 32) and in all solid tissues (primary + metastatic, n = 88) against ascites-derived cells (e n = 9). In volcano plots, colored dots indicate DEGs of each matrisome category: dark blue = collagens, purple = proteoglycans, light blue = extracellular matrix (ECM) glycoproteins, orange = ECM-affiliated proteins, yellow = ECM regulators, green = secreted factors. Horizontal line shows Benjamini–Hochberg-adjusted p value <0.05 (FDR false discovery rate); vertical lines depict 2.0-fold increased (red) and decreased (blue) expression. Bars in charts depict the relative proportion of DEGs within the six different matrisome categories. fh Micrographs of collagen 1A1 (COL1A1) and fibronectin (FN1) immunohistochemistry of control omentum (f), pre-chemo primary tumor (g COL1A1), and omental metastasis (h) show substantial desmoplastic reaction surrounding malignant cell areas. Images representative of three patients (f) and eight patients (g, h see Supplementary Fig. 1c–f for more examples). Scale bar = 0 µm (f), 200 µm and 50 µm in inset (g, h). i Ingenuity Pathway Analysis demonstrates the top pathways affected by DEGs in pre-chemo omental and peritoneal metastases (n = 49) against primary tumor (n = 32); the color key identifies the z-score; Fisher’s exact test; N/A not applicable.
Fig. 2
Fig. 2. Post-chemotherapy HGSCs exhibit strong core ECM signatures coupled to MMP induction at metastatic sites.
a Venn diagram illustrates the number of differentially expressed genes (DEGs) encoding matrisome proteins in post-chemotherapy HGSC tissues against corresponding pre-chemotherapy tissues. The number of samples post-chemo vs pre-chemo was 23 vs 21 for omental metastasis, 5 vs 28 for peritoneal metastasis, 10 vs 6 for mesenteric metastasis, and 13 vs 32 for primary tumor. be Volcano plots and corresponding charts indicate the strong core matrisome expression in post-chemotherapy primary (ovary/fallopian tube) tumors (b n = 13 vs 32), combined omental and peritoneal metastases (c n = 28 vs 49), and in ascites-derived cells (d n = 18 vs 9) compared to matching pre-chemotherapy samples. Post-chemotherapy, DEGs between combined omental and peritoneal metastases against the primary tumor are shown in e (n = 28 vs 13). In volcano plots, colored dots indicate DEGs of each matrisome category: dark blue = collagens, purple = proteoglycans, light blue = extracellular matrix (ECM) glycoproteins, orange = ECM-affiliated proteins, yellow = ECM regulators, green = secreted factors. Horizontal line shows Benjamini–Hochberg-adjusted p value <0.05 (FDR false discovery rate); vertical lines depict 2.0-fold increased (red) and decreased (blue) expression. Bars in charts depict the relative proportion of the DEGs within the six different matrisome categories. f Ingenuity Pathway Analysis demonstrates the top pathways affected by DEGs in post-chemotherapy omental and peritoneal metastases (n = 28) against post-chemotherapy primary tumor tissue (ovary/fallopian tube, n = 13); the color key identifies the z-score; Fisher’s exact test; N/A not applicable. gj Micrographs of collagen 1A1 (COL1A1) and fibronectin (FN1) immunohistochemistry of post-chemotherapy omental micro-metastasis (g, h) show the development of fibrosis in early micrometastatic tumor microenvironment (TME) and the compromised ECM fibers in post-chemotherapy mesenteric (i) and omental (j) metastases. Images representative of two patients (gi) and ten patients (j). Arrowheads indicate fragmented ECM fibers. See Supplementary Fig. 4a, b for lower magnification micrographs and Supplementary Fig. 4c–f for more examples. Scale bar = 50 µm.
Fig. 3
Fig. 3. Increased ECM stiffness protects HGSC cells against cisplatin treatment.
a, b Schematic diagram of the experimental design and representative confocal micrographs of F-actin (phalloidin, white) and phosphorylated focal adhesion kinase (pFAK, green) in cells on 2 and 21 kPa collagen 1-functionalized polyacrylamide hydrogels (COL1-PAA); OVCAR4 and OVCAR8 n = 100, TYK-nu n = 150 cells. Scale bar = 25 µm. c, d Representative confocal micrographs and corresponding nuclear to cytoplasmic ratio (nuc:cyto) of YAP/TAZ (green) in representative cells on 2 and 21 kPa COL1-PAA; OVCAR4 n = 101/101, OVCAR8 n = 323/300 and TYK-nu n = 56/45 cells. Scale bar = 25 µm and 10 µm in inset. e Superplots show the phosphorylated H2Ax (γH2Ax) intensity per nuclei over 36 h on 2 (gray) and 21 kPa (blue) COL1-PAA. Superplots depict each cell within color-coded replicate and their mean. See Supplementary Fig. 7d for representative confocal micrographs. f Charts depict the cleaved caspase 3/7+ (cl-casp3/7+) cells over 72 h treatment on 2 and 21 kPa COL1-PAA. See Supplementary Movies 1–4. g Representative confocal images and corresponding quantification of cyclinA2 (green), RAD51 (red), and co-expression (merged) in nucleus (DAPI, blue) in corresponding cells on 2 and 21 kPa COL1-PAA at 36 h cisplatin treatment (2 μM OVCAR4, TYK-nu, TYK-nu.R; 10 μM OVCAR8). Standard deviation shown in brackets. See Supplementary Fig. 8b for 24 h treatment and Supplementary Fig. 8c, d for complete quantifications. Scale bar = 50 μm. hk Charts and superplots illustrate cl-Casp3+ cells and γH2Ax intensity per nuclei in cells on 21 kPa COL1-PAA with DMSO (control; gray), Defactinib (h, i orange) or Verteporfin (j, k green) at 32 h; see Supplementary Fig. 8e, f for representative micrographs of cl-Casp3. Superplots depict each cell within color-coded replicate and their mean. Data represent mean ± SEM; n = 3 biological replicates; two-tailed Student’s t test; one-way ANOVA with Tukey’s multiple comparison test (f 0–72 h comparisons within 2 and 21 kPa). Box plots indicate median (middle line), 25th, 75th percentile (box), and 10th and 90th percentile (whiskers) as well as outliers (single points). Source data are provided as a Source data file.
Fig. 4
Fig. 4. Specific matrix proteins alter HGSC cell platinum response.
ac Charts depict the OVCAR4 (a) and OVCAR8 (b) adhesive cell count, and cisplatin response (c) on extracellular matrix (ECM) protein array after 24 h adherence and 48 h treatment with 2 μM (OVCAR4) or 10 μM (OVCAR8) cisplatin (see Supplementary Fig. 9a, b for light micrographs). Data in a, b are presented relative to untreated OVCAR8 cell count in fibronectin (FN). Data are shown as mean ± SEM; n = 1 array/biological replicate with 9 technical replicates (a, b); vertical bars (c) indicate mean value. Red boxes (a, b) and red bars (c) indicate the conditions that result in higher cell number after cisplatin treatment compared to NaCl (control). Blue boxes indicate single ECM proteins with highest cell count. d Charts depict cisplatin response of TYK-nu and TYK-nu.R on ECM protein array after 24 h adherence and 48 h treatment with 2 μM cisplatin (see Supplementary Fig. 10c, d for quantification). Vertical bars indicate mean value; n = 3 biological replicates. Red bars indicate the conditions that result in higher cell number after cisplatin treatment compared to NaCl (control). e, f Representative light micrographs of F-actin (phalloidin, orange) in OVCAR4 (e) and OVCAR8 (f) on ECM micro-spots of vitronectin (VTN), FN, and collagen 1 and 6 (COL1, COL6); n = 1 array/biological replicate, micrographs are representative of 9 technical replicates; see supplementary Fig. 9a, b for full set of micrographs (OVCAR4 n = 1 array and OVCAR8 control n = 2 arrays, cisplatin n = 1 array). Scale bar = 50 µm. gi Scatter plots depict the correlation of post-chemo cell area against cell count (g) and the increase in cell area against cisplatin response (h) in OVCAR4 and OVCAR8, as well as the number of migrated OVCAR8 against cell count pre- and post-chemotherapy (i). Cisplatin response determined by [cell viability (NaCl) − cell viability (cisplatin)]/cell viability (NaCl). Two-tailed Pearson correlation; n = 1 array with 9 technical replicates; ELN elastin, LAM laminin, BSA bovine serum albumin. Source data are provided as a Source data file.
Fig. 5
Fig. 5. COL6 increases upon chemotherapy and is associated with poor patient survival.
a Kaplan–Meier curves show the association between collagen (COL) 6A1, COL6A2, COL6A3, fibronectin (FN1), and vitronectin (VTN) expression in chemo-naïve ovarian cancer tissues with overall survival (OS) in The Cancer Genome Atlas (TCGA) dataset; log-rank test. b Heatmap shows average COL6A1-6A6, FN1, and VTN expression in pre- and post-chemotherapy high-grade serous carcinoma (HGSC) RNA-seq of primary tumor and metastatic (omental+peritoneal+mesenteric) tissue patient samples. Benjamini–Hochberg-corrected p value, two-tailed Student’s t test, n = number of samples; the color key indicates the normalized gene expression values (low = 0.00; high = 12.98). c Scatter plots depict the correlation of COL6A1 and COL6A2 expression fold change (post- against pre-chemotherapy) with platinum-free interval (PFI) and progression-free survival (PFS) in HGSC patient- and tissue-matched samples (n = 8); two-tailed Pearson correlation. d Charts illustrate change in expression of COL6A1-A3, FN1, and VTN upon chemotherapy in matched HGSC patient-derived samples (n = 12) from initially platinum-sensitive patients (including partial/complete response or stable disease). Asterisk identifies a patient with longer platinum-free interval (974 days) in comparison to other patients (0–460 days). Significance represents the induced expression of COL6A2 in metastatic tissues post-chemotherapy; two-tailed Student’s t test. See Supplementary Fig. 12c for corresponding charts for COL6A5 and COL6A6. e Heatmap of COL6A1-A6 gene expression in HGSC cells from stromal (n = 31) and epithelial compartments (n = 32; GSE40595). Used probe IDs as shown; the color key indicates the normalized gene expression values (low = −5.46; high = 7.10). f Immunoblot for COL6A1, PAX8, fibroblast-specific protein 1 (FSP1), and β-actin in HGSC cells, omental metastasis-derived cancer-associated fibroblasts (CAFs), and normal fibroblasts (NFs); n = 2 biological replicates. g Micrographs of COL6A1 immunohistochemistry reveal abundant protein expression in the immediate surroundings of the malignant HGSC foci in omental micro-metastasis and in pre- and post-chemotherapy omental metastases. Images representative of two (micro-metastasis), six (pre-chemotherapy), and ten (post-chemotherapy) patients. Scale bar = 200 µm and 50 µm in inset. See Supplementary Data 26–29 for specific values (bd). Source data are provided as a Source data file.
Fig. 6
Fig. 6. Addition of collagen 6 promotes HGSC cell survival in 3D collagen 1.
a Representative light phase-contrast images show the diverse growth phenotype response of OVCAR4 and OVCAR8 cultured in 3D collagen 1 (COL1) and Matrigel for 5 days. Scale bar = 25 µm. b Schematic diagram of the experimental design and representative confocal micrographs of COL1A1, COL6A1, and fibronectin (FN1) in OVCAR8 grown for 5 days in 3D COL1 with or without 50 µg/ml COL6 or FN supplementation. Scale bar = 25 µm. c Representative confocal micrographs of Ki67 (green) show the comparable proliferation in OVCAR4 and OVCAR8 between all corresponding 3D matrix cultures. Cells were grown for 5 days. See Supplementary Fig. 13b, c for quantifications. Scale bar = 25 µm. dh Bar charts depict cellular ATP in OVCAR4 (d COL1 vs COL1 + COL6 p = 0.016 vs COL1 + FN p = 0.034), OVCAR8 (e COL1 + COL6 vs COL1 + FN at 10 µM p = 0.005, at 20 µM p = 0.004, at 30 µM and vs COL1 p = 0.013; COL1 vs COL1 + FN at 10 µM p = 0.008, at 20 µM p = 0.025), OVCAR3 (f), TYK-nu (g), and TYK-nu.R (h) grown in corresponding 3D matrices for a total of 5 days. Scatter plots illustrate cell viability after 72 h treatment with 0–20 µM (d, fh) or 0-40 µM (e OVCAR8) cisplatin. Cell viability was determined by ATP measurement and is shown in reference to NaCl (control) per matrix. Data represent mean ± SEM of biological replicates (n = 3, OVCAR4 in c, dh n = 4 in OVCAR8 in c); two-tailed Student’s t test. Images in a, b are representative of 6 biological replicates. Source data are provided as a Source data file.
Fig. 7
Fig. 7. Cisplatin treatment enhances integrin-based cancer cell adhesion on stiff collagen 6 substrate.
a, b Representative confocal micrographs (a) and corresponding nuclear to cytoplasmic ratio (nuc:cyto; b) of YAP/TAZ (green) in cells on 2, 4.5, and 21 kPa collagen 6-functionalized polyacrylamide hydrogels (COL6-PAA) at 48 h; OVCAR4 n = 114/111/103 and OVCAR8 374/265/165 cells, respectively; Scale bar = 10 µm. c, d Charts depict positivity for EdU in untreated (c) and cleaved caspase3 in treated (cl-Casp3; d) cells on corresponding COL6-PAA at 24 h; see Supplementary Fig. 14c, d for representative micrographs. eg Representative confocal micrographs of F-actin (phalloidin, white) and phosphorylated focal adhesion (pFAK, green) in cells on 21 kPa COL1 or COL6-PAA at 48 h. Charts show the number and peripheral localization of FAs in OVCAR4 (f n = 186/191 and 103/105) and in OVCAR8 (g n = 118/195 and not applicable (N/A)/103). Scale bar = 25 µm. h Chart depicts the F-actin anisotropy in cells on 21 kPa COL1 or COL6-PAA at 48 h; OVCAR4 n = 47/35, 18/30 and OVCAR8 n = 44/41, 46/27 cells, respectively. See Fig. 7e for representative micrographs. i Representative confocal micrographs of F-actin (phalloidin, white) in OVCAR8 on 21 kPa COL1 and COL6-PAA at 24 h; n = 25 cells. White arrows indicate protrusions. Scale bar = 10 µm. j Representative confocal micrographs of myosin light chain (pMLC, red) in OVCAR8 on 21 kPa COL1 and COL6-PAA at 24 h. Chart indicates pMLC staining intensity per area; n = 86/72 and 75/65 cells, respectively. Scale bar = 25 µm. Data represent mean ± SEM of biological replicates (n = 3 in b, dj, n = 4 in c). One-way ANOVA with Tukey’s multiple comparison test (b, f, g, i, j, l); two-tailed Student’s t test (c, d, h). Box plots indicate median (middle line), 25th, 75th percentile (box), and 10th and 90th percentile (whiskers) as well as outliers (single points). Source data are provided as a Source data file.
Fig. 8
Fig. 8. Collagen 6 confers relapse HGSC patient cells with cisplatin-induced adhesion and cisplatin resistance.
ad Representative light micrographs of active β1 integrin (green) in EOC1120 patient ascites-derived cells collected pre-chemotherapy (p-HGSC) at primary debulking surgery (PDS) and at relapse (r-HGSC) stages and grown for 24 h on 3D collagen 1 (COL1) and COL6 before receiving NaCl (control) or 20 μM cisplatin for 48 h. Charts illustrate active β1 integrin intensity (a, b) and adhesion length (c, d); p-HGSC 205/255 and 180/289 cells, respectively; r-HGSC 349/360 and 343/311 cells, respectively, within n = 3 biological replicates. Scale bar (a, b) = 50 µm. e Schematic diagram of the experimental design and representative micrographs of p-HGSC organoids obtained from patient EOC1032 at interval debulking surgery after neoadjuvant chemotherapy treatment (NACT) and grown in 3D matrices for 5 days. Phase-contrast light micrograph and hematoxylin–eosin (H&E) staining depict organoid phenotype and morphology. Immunohistochemistry and immunofluorescence show PAX8 and cytokeratin 7 (CK7, green) positivity; n = 4 biological replicates. Scale bar = 25 µm. fh Bar charts depict cellular ATP in EOC1120 (PDS) p-HGSC (pre-chemo)/r-HGSC (post-chemo) (f) and 3 unpaired p-HGSC (g pre-chemo, EOC1129, EOC50 from NACT, EOC198 from PDS) and r-HGSC (h post-chemo, EOC677 from NACT, EOC495 and EOC742 from PDS) organoids grown for a total of 7 days in 3D COL1 or COL1 + COL6 (50 µg/ml). Scatter plots illustrate cell viability after 72 h treatment with 0-40 µM cisplatin, which was determined by ATP measurement and is shown in reference to NaCl (control) per matrix; n = 3 biological replicates. Data represent mean ± SEM; two-tailed Student’s t test (a, b, fh); one-way ANOVA with Tukey’s multiple comparison test (c, d). Box plots indicate median (middle line), 25th, 75th percentile (box), and 10th and 90th percentile (whiskers) as well as outliers (single points). Source data are provided as a Source data file.

References

    1. Winkler J, Abisoye-Ogunniyan A, Metcalf KJ, Werb Z. Concepts of extracellular matrix remodelling in tumour progression and metastasis. Nat. Commun. 2020;11:1–19. doi: 10.1038/s41467-020-18794-x. - DOI - PMC - PubMed
    1. Senthebane, D. A. et al. The role of tumor microenvironment in chemoresistance: to survive, keep your enemies closer. Int. J. Mol. Sci.18, 1586 (2017). - PMC - PubMed
    1. Shaked Y. The pro-tumorigenic host response to cancer therapies. Nat. Rev. Cancer. 2019;19:667–685. doi: 10.1038/s41568-019-0209-6. - DOI - PubMed
    1. Eble JA, Niland S. The extracellular matrix in tumor progression and metastasis. Clin. Exp. Metastasis. 2019;36:171–198. doi: 10.1007/s10585-019-09966-1. - DOI - PubMed
    1. Özbek S, Balasubramanian PG, Chiquet-Ehrismann R, Tucker RP, Adams JC. The evolution of extracellular matrix. Mol. Biol. Cell. 2010;21:4300–4305. doi: 10.1091/mbc.e10-03-0251. - DOI - PMC - PubMed

Publication types

MeSH terms