. 2021 Jun 23;12(1):3887.
doi: 10.1038/s41467-021-24206-5.

ATRX promotes heterochromatin formation to protect cells from G-quadruplex DNA-mediated stress

Affiliations

ATRX promotes heterochromatin formation to protect cells from G-quadruplex DNA-mediated stress

Yu-Ching Teng et al. Nat Commun. .

Abstract

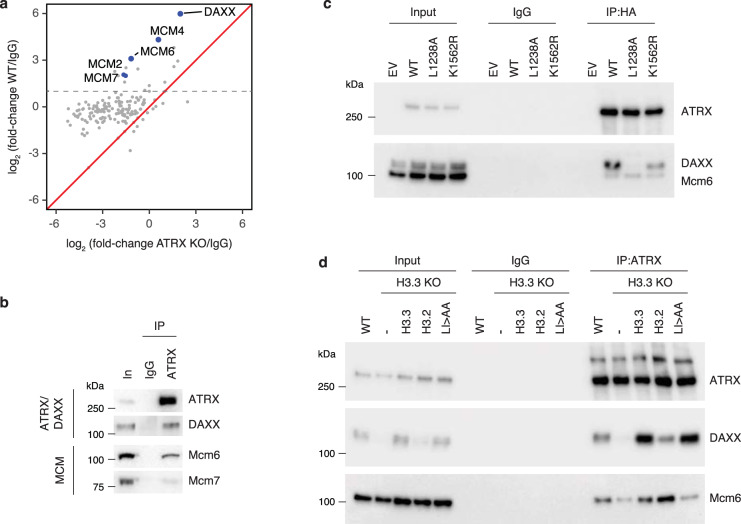
ATRX is a tumor suppressor that has been associated with protection from DNA replication stress, purportedly through resolution of difficult-to-replicate G-quadruplex (G4) DNA structures. While several studies demonstrate that loss of ATRX sensitizes cells to chemical stabilizers of G4 structures, the molecular function of ATRX at G4 regions during replication remains unknown. Here, we demonstrate that ATRX associates with a number of the MCM replication complex subunits and that loss of ATRX leads to G4 structure accumulation at newly synthesized DNA. We show that both the helicase domain of ATRX and its H3.3 chaperone function are required to protect cells from G4-induced replicative stress. Furthermore, these activities are upstream of heterochromatin formation mediated by the histone methyltransferase, ESET, which is the critical molecular event that protects cells from G4-mediated stress. In support, tumors carrying mutations in either ATRX or ESET show increased mutation burden at G4-enriched DNA sequences. Overall, our study provides new insights into mechanisms by which ATRX promotes genome stability with important implications for understanding impacts of its loss on human disease.


Conflict of interest statement

The authors declare no competing interests.

Figures

Fig. 1
Fig. 1. ATRX associates with G4 structures in vivo.
a Genome browser representations of ATRX, ATRX-GFP, H3.3, and H3K9me3 ChIP-seq at predicted G4 regions in ESCs. Data represented as read density in reads per kilobase per million mapped reads (RPKM) normalized to an external standard for each data set. Gray boxes indicate predicted G4 regions. b ChIP-seq analysis of ATRX enrichment in ESCs. Pie chart represents the percentage of ATRX-enriched regions containing G4 consensus motifs (169/435, 39%). c ATRX ChIP-seq average profiles in ESCs at ATRX-enriched regions containing G4 consensus motifs (G4) compared with ATRX-enriched regions that do not contain a G4 consensus motif (non-G4). d Schematic of ESCs synchronization protocol. Cells are incubated with thymidine for 14 h, washed, and treated in medium with nocodazole for 7 h. After washing, mitotic cells are released in medium and incubated with EdU in prior cell fixation for downstream experiments. Cells in G1, early S, and late S phase were analyzed 1, 2, and 8 h after release, respectively. e Representative images demonstrating ATRX and G4 co-localization by proximity ligation assay (PLA) in synchronized ESCs. Green—PLA (ATRX-G4). Red—EdU-labeling, indicative of newly synthesized DNA. Blue—DAPI nuclear stain. Scale bar equals 10 μm (n = 1 independent experiment). f Quantification of signal intensity from ATRX-G4 PLA foci in G1 (n = 47), early S (n = 53), and late S (n = 34) phases of ESCs. Quantification of PLA data are presented as box-and-whisker plots marking a horizontal median line. The bottom and the top of the boxes correspond to the 25 and 75th percentiles, and the internal band is the 50th percentile (median). The plot whiskers show down to the minimum and up to the maximum value. One-way ANOVA, p = 0.2554 (G1 vs. early S), p = 0.2760 (G1 vs. late S), and p = 0.9905 (early S vs. late S).
Fig. 2
Fig. 2. ATRX associates with the MCM DNA helicase.
a Proteomic analysis of ATRX-interacting proteins. Mass spectrometry data represented a scatter plot of the log2 abundance ratios of ATRX-enriched proteins compared to IgG control in both wild-type and ATRX KO HeLa cells. Gray dotted line indicates a fold-change >2 in ATRX-enriched proteins compared to IgG control. (n = 1 independent experiment). b Co-immunoprecipitation from wild-type ESC nuclear extracts showing ATRX interaction with DAXX, Mcm6 and Mcm7. c Co-immunoprecipitation from ATRX KO addback ESC nuclear extracts showing HA-tagged ATRX interaction with DAXX and Mcm6. K1562R—ATRX mutation in helicase domain; L1238A—ATRX mutation in DAXX-binding motif. d Co-immunoprecipitation from H3.3 KO addback ESC nuclear extracts showing ATRX interaction with DAXX and Mcm6. H3.3 LI/AA—H3.3 deposition mutant. For (bd), data are representative of experiments performed at least 3 times. For all immunoblots, source data are provided as a Source Data file.
Fig. 3
Fig. 3. ATRX prevents the accumulation of G4 structures at sites of DNA synthesis.
a Representative images demonstrating EdU and G4 co-localization by proximity ligation assay (PLA) in synchronized ESCs at early S phase. Green—PLA (EdU-G4). Blue—DAPI nuclear stain. Scale bar equals 10 μm (n = 2 independent experiments). b Quantification of signal intensity from EdU-G4 PLA foci in wild-type (n = 48), ATRX KO (n = 35) (p = 2 × 10−10) and DAXX KO (n = 52) (p = 1 × 10−10) ESCs. The bottom and the top of the boxes correspond to the 25th and 75th percentiles, and the internal band is the 50th percentile (median). The plot whiskers show down to the minimum and up to the maximum value. Statistical significance determined by a One-way ANOVA test. ***p < 0.001. c Genome browser representations of ATRX, ATRX-GFP ChIP-seq, and BG4 CUT&Tag at observed G4 regions in ESCs. df CUT&Tag analysis of G4 enrichment in ESCs. d Venn diagram showing the unique and overlaps between wild-type and ATRX KO ESCs. e, f Pie chart of genomic region annotation in wild-type (e) and ATRX KO ESCs (f). g Box plots representing EdU-seq read counts of early S phase in wild-type, ATRX KO (p = 8.9 × 10−11) and DAXX KO (p = 1.6 × 10−6) ESCs at observed G4 regions that are only identified in ATRX KO (n = 6301). Data are representative of two independent experiments. The bottom and the top of the boxes correspond to the 25 and 75th percentiles, and the internal band is the 50th percentile (median). The plot whiskers correspond to 1.5 interquartile range. Statistical significance determined by Wilcoxon–Mann–Whitney test. ***p < 0.001.
Fig. 4
Fig. 4. ATRX requires its helicase and chaperone activity to protect from G4-induced stress.
a Cell viability of wild-type, ATRX KO, DAXX KO, and HIRA KO ESCs treated with PDS for 5 days. IC50: wild-type—0.804 μM, ATRX KO—0.396 μM, DAXX KO—0.384 μM, and HIRA KO—0.909 μM. b Cell viability of ATRX KO ESCs exogenously expressing either wild-type or mutant ATRX constructs treated with 2 μM PDS for 5 days. K1612N and K1562R—ATRX mutations in helicase domain; L1238A—ATRX mutation in DAXX-binding motif. c Cell viability of H3.3 KO ESCs exogenously expressing either wild-type or mutant H3.3 (L126A I130A, LI/AA) or H3.2 constructs treated with 1 μM PDS for 5 days. For both panels, mock-treated cells at day 0 were taken as 100% survival. Data represented as mean ± SD (n = 3). Statistical significance determined by a Two-way ANOVA test. **p < 0.01; ***p < 0.001. p = 7.2 × 10−5 (vector vs. WT in b), and p = 1.4 × 10−5 (H3.3 KO vs. H3.3 addback in c).
Fig. 5
Fig. 5. ATRX maintains closed chromatin states at G4 structures.
a Genome browser representations of ATRX, ATRX-GFP, H3.3 ChIP-seq and ATAC-seq at predicted G4 regions in ESCs. Box plots representing ATAC-seq read counts at ATRX-enriched G4 and non-G4 regions in wild-type ESCs compared to (b) ATRX KO (p = 5.6 × 10−4), (c) DAXX KO (p = 1.7 × 10−4), and (d) H3.3 KO (p = 4.4 × 10−5) ESCs. e Box plots representing ATAC-seq read counts at ATRX-enriched G4 and non-G4 regions in ATRX KO ESCs exogenously expressing either wild-type (p = 0.003) or mutant ATRX (L1238A p = 0.47; K1562R p = 0.57) constructs. f Box plots representing ATAC-seq read counts at ATRX-enriched G4 and non-G4 regions in H3.3 KO ESCs exogenously expressing either wild-type H3.2 (p = 0.68), H3.3 (p = 0.047), or mutant (p = 0.87) H3.3 constructs. Data are representative of two independent experiments. The bottom and the top of the boxes correspond to the 25th and 75th percentiles, and the internal band is the 50th percentile (median). The plot whiskers correspond to 1.5 interquartile range. Statistical significance determined by Wilcoxon–Mann–Whitney test compared to ATRX KO (e) and H3.3 KO in (f). *p < 0.05; **p < 0.01; ***p < 0.001. ns not significant.
Fig. 6
Fig. 6. ATRX/DAXX/H3.3 are key factors for H3K9me3 maintenance at G4 regions.
a Genome browser representations of ATRX, ATRX-GFP, and H3K9me3 ChIP-seq at predicted G4 regions in ESCs. Box plots representing ChIP-seq read counts for H3K9me3 at ATRX-enriched G4 and non-G4 regions in wild-type ESCs compared to (b) ATRX KO (p = 4.8 × 10−4), (c) DAXX KO (p = 3.1 × 107) and (d) H3.3 KO (p = 2.1 × 10−8) cells. Data are representative of two independent experiments. The bottom and the top of the boxes correspond to the 25 and 75th percentiles, and the internal band is the 50th percentile (median). The plot whiskers correspond to 1.5 interquartile range. Statistical significance determined by Wilcoxon–Mann–Whitney test. ***p < 0.001. e ChIP-qPCR of H3K9me3 at ATRX-enriched G4 regions (n = 7) in ATRX KO ESCs exogenously expressing either wild-type or mutant ATRX constructs. f ChIP-qPCR of H3K9me3 at ATRX-enriched G4 regions (n = 7) in H3.3 KO ESCs exogenously expressing either wild-type H3.2, H3.3, or mutant H3.3 constructs. Data represent mean ± SD. Statistical significance determined by one-way ANOVA compared to ATRX KO + ATRX in (e) and H3.3 KO + H3.3 in (f). **p < 0.01; ***p < 0.001. p = 2.9 × 10−4 (vector vs. ATRX addback in e), p = 1.8 × 10−3 (ATRX addback vs. L1238A in e), and p = 3.8 × 10−4 (ATRX addback vs. K1562R in e). p = 4.9 × 10−4 (H3.3 KO vs. H3.3 addback in f), p = 6.6 × 10–3 (H3.2 addback vs. H3.3 addback in f), and p = 5.6 × 10−4 (H3.3 LIAA vs. H3.3 addback in f).
Fig. 7
Fig. 7. ESET facilitates heterochromatin at G4 regions and protects cells from G4-mediated stress.
a Genome browser representations of ATRX, ATRX-GFP, H3.3-H3K9me3 reChIP-seq, H3.3 ChIP-seq, and ATAC-seq at predicted G4 regions in ESCs. Box plots representing (b) H3.3-H3K9me3 reChIP-seq (p = 5.0 × 10−6), (c) H3.3 ChIP-seq (p = 0.47), and (d) ATAC-seq (p = 0.12) at ATRX-enriched G4 and non-G4 regions in wild-type ESCs compared to ESET KO ESCs. The bottom and the top of the boxes correspond to the 25 and 75th percentiles, and the internal band is the 50th percentile (median). The plot whiskers correspond to 1.5 interquartile range. Statistical significance determined by Wilcoxon–Mann–Whitney test. ***p < 0.001; ns: not significant. e Cell viability of wild-type and ESET KO ESCs treated with 1 μM of PDS for 3 days. Mock-treated cells at day 0 were taken as 100% survival. Data represented as mean ± SD (n = 9). Statistical significance determined by Mann–Whitney U test. ***p < 0.001. p = 9 × 10−10 (WT vs. ESET KO in e).
Fig. 8
Fig. 8. Mutations at G4 regions are highly correlated with mutations in ATRX or ESET in human tumors.
a, b Red line shows standardized number of mutations at G4 regions in ATRX (n = 684) (a) or ESET (n = 312) (b) mutant tumors. Histograms show the mutation density at observed G4 regions in an iteratively (n = 504) and randomly selected patient cohort of the same size. p value calculated based on the null distribution as described in methods. c, d Analysis of single-nucleotide mutations and insertion-deletion (INDEL) mutations in the ATRX (c) or ESET (d) mutant tumors compared with the shuffled patient cohort described above. Mutations per donor from the shuffled cohort are displayed as a violin plot in which the width of the shaded area represents the proportion of data located there.
Fig. 9
Fig. 9. ATRX is a critical chromatin remodeler at G-quadruplex regions during DNA replication.
When the replicative MCM helicase complex encounters G4 DNA, ATRX resolves G4 DNA through its helicase activity and H3.3 deposition activity to facilitate MCM progression. These activities are ultimately upstream of ESET-mediated heterochromatin formation to protect cells from G4-mediated replicative stress. Thus, ATRX/DAXX/H3.3 and ESET cooperate to prevent physical G-quadruplex stress and maintain genome stability.

References

    1. Dyer, M. A., Qadeer, Z. A., Valle-Garcia, D. & Bernstein, E. ATRX and DAXX: mechanisms and Mutations. Cold Spring Harb. Perspect. Med. 7, a026567 (2017). - PMC - PubMed
    1. Law MJ, et al. ATR-X syndrome protein targets tandem repeats and influences allele-specific expression in a size-dependent manner. Cell. 2010;143:367–378. doi: 10.1016/j.cell.2010.09.023. - DOI - PubMed
    1. Sadic D, et al. Atrx promotes heterochromatin formation at retrotransposons. EMBO Rep. 2015;16:836–850. doi: 10.15252/embr.201439937. - DOI - PMC - PubMed
    1. He Q, et al. The Daxx/Atrx Complex Protects Tandem Repetitive Elements during DNA Hypomethylation by Promoting H3K9 Trimethylation. Cell Stem Cell. 2015;17:273–286. doi: 10.1016/j.stem.2015.07.022. - DOI - PMC - PubMed
    1. Voon HPJ, et al. ATRX plays a key role in maintaining silencing at interstitial heterochromatic loci and imprinted genes. Cell Rep. 2015;11:405–418. doi: 10.1016/j.celrep.2015.03.036. - DOI - PMC - PubMed

Publication types

MeSH terms