. 2021 Jun 23;12(1):3885.
doi: 10.1038/s41467-021-24198-2.

Promoter G-quadruplexes and transcription factors cooperate to shape the cell type-specific transcriptome

Affiliations

Promoter G-quadruplexes and transcription factors cooperate to shape the cell type-specific transcriptome

Sara Lago et al. Nat Commun. .

Abstract

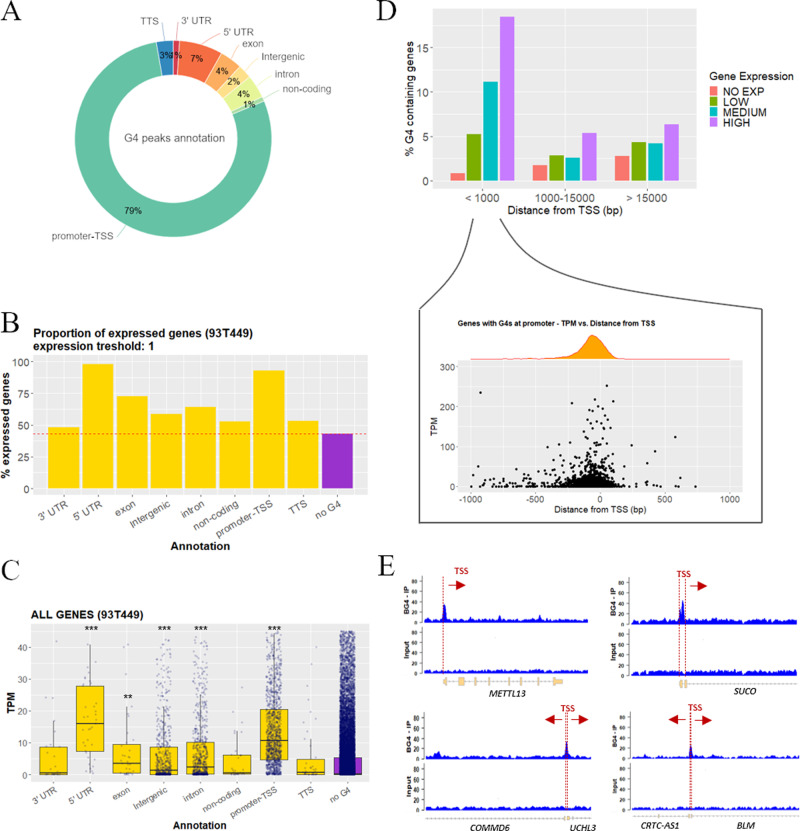
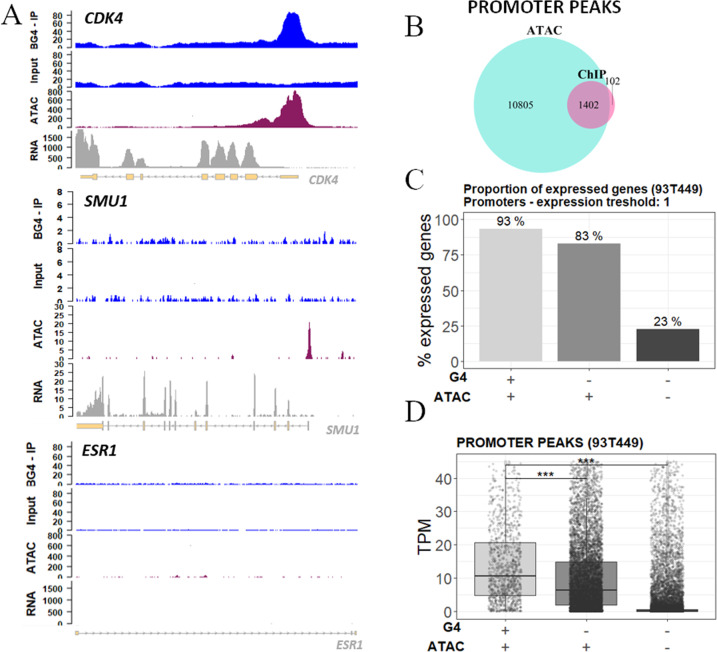
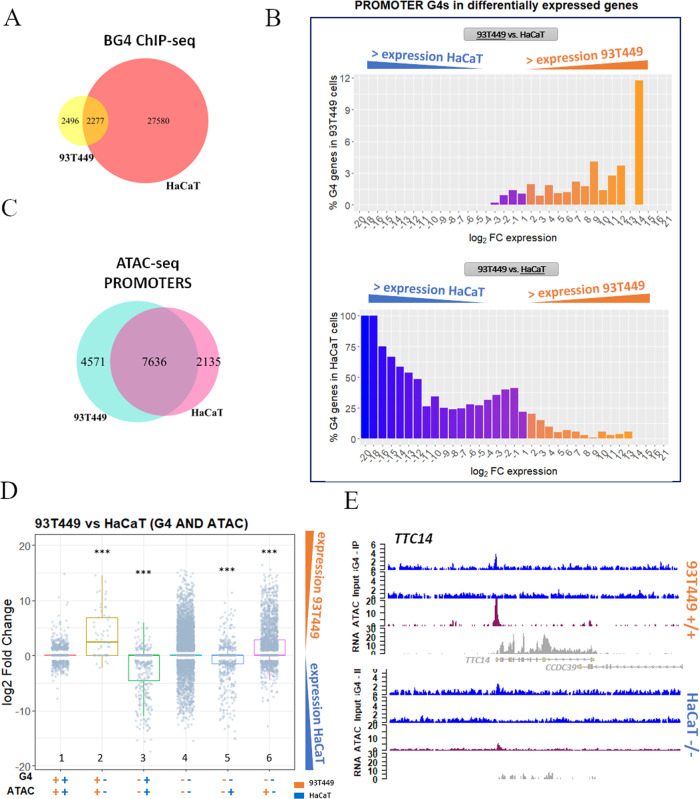
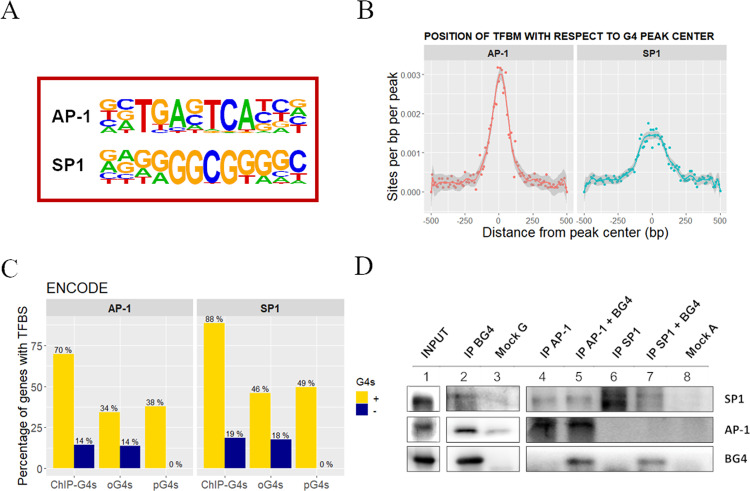
Cell identity is maintained by activation of cell-specific gene programs, regulated by epigenetic marks, transcription factors and chromatin organization. DNA G-quadruplex (G4)-folded regions in cells were reported to be associated with either increased or decreased transcriptional activity. By G4-ChIP-seq/RNA-seq analysis on liposarcoma cells we confirmed that G4s in promoters are invariably associated with high transcription levels in open chromatin. Comparing G4 presence, location and transcript levels in liposarcoma cells to available data on keratinocytes, we showed that the same promoter sequences of the same genes in the two cell lines had different G4-folding state: high transcript levels consistently associated with G4-folding. Transcription factors AP-1 and SP1, whose binding sites were the most significantly represented in G4-folded sequences, coimmunoprecipitated with their G4-folded promoters. Thus, G4s and their associated transcription factors cooperate to determine cell-specific transcriptional programs, making G4s to strongly emerge as new epigenetic regulators of the transcription machinery.


Conflict of interest statement

The authors declare no competing interests.

Figures

Fig. 1
Fig. 1. Genomic position of G4s and association to gene expression.
A Percentage distribution of G4 peaks in functional genomic regions according to Homer gene annotation. Percentages are normalized over the genomic abundance of each functional region. B Percentage proportion of expressed genes among the G4-containing genes (yellow). G4-depleted genes (no G4, violet) are reported as reference. One transcript per gene was considered as threshold. C Gene expression distribution expressed in transcripts per million (TPM) of all the G4-containing genes (yellow). Genes were grouped according to the functional annotation of the immunoprecipitated G4 region. G4-depleted genes (no G4, violet) are reported as reference. The box plots central line represents the median, the bottom, and upper bounds of the box represent the 25th and 75th percentile, respectively, and the whiskers represent the lowest and highest score, excluding outliers. The significance level of each gene category was calculated by two-sided T test (CI 95%) with respect to the no G4 group. ***p value < 0.001, **p value < 0.01, the absence of asterisks indicates that the difference is not statistically significant. Exact p values are the following: 5′UTR p = 3.3e−14, exon p = 0.0032, intergenic p = 1.2e−9, intron p < 2.22e−16, promoter-TSS p < 2.22e−16. Numerosity of each category is: 3′UTR n = 29, 5′UTR n = 49, exon n = 44, intergenic n = 729, intron n = 808, noncoding n = 36, promoter-TSS n = 1434, TTS n = 47, no G4 n = 23662. D Upper panel: percentage of G4-containing genes, in genes grouped according to their expression level (no expression, low, medium, or high) and their distance from the TSS of the closest gene (<1000 bp, between 1000–15,000 and >15,000 bp). Lower panel: detailed view of gene expression level (TPM) and density distribution of genes with folded G4s within 1000 bp from TSS in function of the G4 distance from the TSS. E Genomic view of representative regions showing the G4-ChIP peak position with respect to the TSS: G4-ChIP peaks in two gene promoters with noncoding upstream regions are displayed in the upper panels (METTL13 and SUCO); G4-ChIP peaks embedded in the coding regions of two adjacent genes with opposite transcription direction are shown in the lower panels (COMMD6 and UCHL3—left; CRTC-AS1 and BLM—right). Source data for each panel are provided or referenced in the Source data file.
Fig. 2
Fig. 2. Relationship between G4s and open chromatin.
A Genomic view showing input and G4 IP samples (blue tracks), ATAC-seq (purple track), and RNA-seq (gray track) peaks in the promoter of representative genes: CDK4 (upper panel), SMU1 (mid panel), and ESR1 as negative control gene (lower panel). B Venn diagram displaying the intersection between peak regions corresponding to IP G4s (light blue) and open chromatin regions (violet) mapped by ATAC-seq in promoters. C Percentage proportion of expressed genes grouped according to the presence of G4s and open chromatin signal in their promoter region. One transcript per gene was considered as expression threshold. D Expression distribution of all genes grouped according to the presence of ChIP-seq G4s and ATAC-seq signals in their promoter region. Gene expression is reported as TPM (transcript per million). In C and D, the presence and absence of G4 and ATAC-seq signals are indicated below the graphs. The box plots central line represents the median, the bottom, and upper bounds of the box represent the 25th and 75th percentile, respectively, and the whiskers represent the lowest and highest score, excluding outliers. The significance level of each category was calculated by two-sided T test (CI 95%) with respect to the G4:ATAC −/− group. ***p value < 0.001. Exact p values are <2.22e−16 for both G4:ATAC +/+ and −/+ categories. Numerosity of each category is the following: G4:ATAC +/+ n = 1351, −/+ n = 8893, −/− n = 16204. Source data for each panel are provided or referenced in the Source data file.
Fig. 3
Fig. 3. Detection of G4s foci upon transcription perturbation treatments.
A Representative fields of view showing G4 foci formation detected by immunofluorescence in control non-treated (CTRL), entinostat (2 and 4 μM) and actinomycin D (0.5 and 1 μM) treated 93T449 cells. Nuclear staining (blue), BG4 (green), and the merged channels are reported. Scale bars = 20 μm. The shown fields belong to one of two independent biological replicates. B Quantification of BG4 nuclear staining detected by immunofluorescence in control non-treated and entinostat (2 and 4 μM)—upper panel—or actinomycin D (0.5 and 1 μM) treated—lower panel. BG4 integrated fluorescence intensity within nuclei normalized by the corresponding nuclear area (μm2) is reported. The central line for each condition represents the mean ± standard deviation. Statistical significance was calculated by unpaired two-sided T test (CI 95%) with: ****p value < 0.0001, ***p value < 0.001, *p value < 0.01. Exact p values are the following: actinomycine D 0.5 μM p = 0.0214, actinomycine D 1 μM p = 0.0002, entinostat 2 μM p < 0.0001, entinostat 4 μM p < 0.0001. The number of quantified cells for each condition are the following: ctrl n = 150, entinostat 2 μM n = 147, entinostat 4 μM n = 104, actinomycin D 0.5 μM n = 74, actinomycin D 1 μM n = 128. Source data for each panel are provided or referenced in the Source data file.
Fig. 4
Fig. 4. Comparison of 93T449 and HaCaT cell lines.
A Venn diagram showing the intersection between G4 peaks found in 93T449 (yellow) and HaCaT (salmon) cell lines. B Percentage of genes containing at least one G4 in their promoter in 93T449 (upper panel) or HaCaT (lower panel) cells, in function of their differential expression in the two cell lines expressed as log2 fold change (FC). Orange and blue-violet bars in both panels correspond to genes that have higher expression in 93T449 cells and HaCaT cells, respectively. C Venn diagram showing the intersection between the ATAC-seq peaks found in promoters of 93T449 (light blue) and HaCaT (pink) cell lines. D Differential gene expression comparison of the same genes in 93T449 and HaCaT cells, based on the presence of G4s and open chromatin combinations. Orange and blue symbols indicate data for 93T449 and HaCaT cells, respectively. The presence (+) or absence (−) of G4s or ATAC signals are reported. Bars indicate gene expression distribution of the differentially expressed genes in 93T449 vs HaCaT cells evaluated by two-sided T test in comparison to the G4:ATAC ++/++ condition (CI 95%, ***p value < 0.001). Exact p values are the following: +−/+− p = 2.3e−16, −+/−+ p < 2.22e−16, −−/−+ p = 3e−8, −−/+− p = 4e−7. The box plots central line represents the median, the bottom, and upper bounds of the box represent the 25th and 75th percentile, respectively, and the whiskers represent the lowest and highest score, excluding outliers. G4:ATAC ++/++ n = 1098, +−/+− n = 61, −+/−+ n = 435, −−/−− n = 14,717, −−/−+ n = 649, −−/+− n = 2315. E Genomic view showing representative regions of 93T449 and HaCaT cell lines gene expression (RNA-seq track, gray) with respect to the presence of G4 peaks (ChIP-seq, blue) and open chromatin (ATAC-seq, purple). In particular, TTC14 gene is displayed, which shows both G4 and ATAC signals in 93T449 cells, while it shows limited accessibility and no G4 in HaCaT cells. These differences are reflected in the corresponding RNA amount, which is much lower in HaCaT cells. Source data for each panel are provided or referenced in the Source data file.
Fig. 5
Fig. 5. Identification of TFs binding to BG4-IP regions in 93T449 cells.
A Consensus sequences of TFBSs that are significantly enriched in BG4 ChIP peaks, as calculated by Homer software. AP-1: p value 1e−490, SP1: p value 1e−172. B Position and frequency of TFBSs with respect to the BG4 ChIP peak center. Data points for each TFBS occurrence are reported and fitted according to a nonparametric spline regression curve, the gray area surrounding the curve represents the confidence interval as measure of the regression likelihood. C Percentage of genes with (yellow) and without (darkblue) ChIP-G4s, oG4s, and pG4s containing validated TFBS for AP-1 and SP1, according to ENCODE database. D Western blot showing co-immunoprecipitation of G4s and the two TFs SP1 and AP-1. The INPUT lane 1 corresponds to the total fraction of the sheared chromatin used as starting material. G4s were immunoprecipitated by BG4 antibody (IP BG4), and AP-1 and SP1 were detected by immunoblotting (lane 2). AP-1 (lanes 4 and 5) and SP1 (lanes 6 and 7) TFs were immunoprecipitated from the sheared chromatin with or without previous incubation in the presence of BG4 antibody. Mock G (lane 3) and A (lane 8) are the negative controls immunoprecipitated in the absence of primary antibody using protein-G- or protein-A-coated beads, respectively. The shown blots belong to one of at least two independent biological replicates performed for each sample. Source data for each panel are provided or referenced in the Source data file.

References

    1. Lightfoot HL, Hagen T, Tatum NJ, Hall J. The diverse structural landscape of quadruplexes. FEBS Lett. 2019;593:2083–2102. doi: 10.1002/1873-3468.13547. - DOI - PubMed
    1. Chariker, J. H., Miller, D. M. & Rouchka, E. C. Computational analysis of G-quadruplex forming sequences across chromosomes reveals high density patterns near the terminal ends. PLoS ONE11, e0165101 (2016). - PMC - PubMed
    1. Huppert JL, Balasubramanian S. Prevalence of quadruplexes in the human genome. Nucleic Acids Res. 2005;33:2908–2916. doi: 10.1093/nar/gki609. - DOI - PMC - PubMed
    1. Todd AK, Johnston M, Neidle S. Highly prevalent putative quadruplex sequence motifs in human DNA. Nucleic Acids Res. 2005;33:2901–2907. doi: 10.1093/nar/gki553. - DOI - PMC - PubMed
    1. Huppert JL, Balasubramanian S. G-quadruplexes in promoters throughout the human genome. Nucleic Acids Res. 2007;35:406–413. doi: 10.1093/nar/gkl1057. - DOI - PMC - PubMed

Publication types