Randomized Controlled Trial
. 2021 Jul;595(7866):272-277.
doi: 10.1038/s41586-021-03663-4. Epub 2021 Jun 23.

Caloric restriction disrupts the microbiota and colonization resistance

Affiliations
Randomized Controlled Trial

Caloric restriction disrupts the microbiota and colonization resistance

Reiner Jumpertz von Schwartzenberg et al. Nature. 2021 Jul.

Abstract

Diet is a major factor that shapes the gut microbiome1, but the consequences of diet-induced changes in the microbiome for host pathophysiology remain poorly understood. We conducted a randomized human intervention study using a very-low-calorie diet (NCT01105143). Although metabolic health was improved, severe calorie restriction led to a decrease in bacterial abundance and restructuring of the gut microbiome. Transplantation of post-diet microbiota to mice decreased their body weight and adiposity relative to mice that received pre-diet microbiota. Weight loss was associated with impaired nutrient absorption and enrichment in Clostridioides difficile, which was consistent with a decrease in bile acids and was sufficient to replicate metabolic phenotypes in mice in a toxin-dependent manner. These results emphasize the importance of diet-microbiome interactions in modulating host energy balance and the need to understand the role of diet in the interplay between pathogenic and beneficial symbionts.


Conflict of interest statement

Competing interests

PJT is on the scientific advisory boards for Kaleido, Pendulum, Seres, and SNIPRbiome; there is no direct overlap between the current study and these consulting duties. All other authors have no relevant declarations.

Figures

Extended Data Figure 1.
Extended Data Figure 1.. MMS diet intervention study.
a, CONSORT diagram describing enrollment, allocation, and data analysis. b, Per timepoint group sizes and timing of data collection. Participants in the diet group underwent 2 months of a very-low calorie liquid diet followed by an additional month of a conventional low-calorie diet. During the 4th month, they were instructed to maintain weight stable. During all diet periods individuals were counseled by clinical nutritionists. Timepoints with data collection are shown for both diet and control participants. Daily consumption of macronutrients measured by c, mass and e, percentage of daily energy intake in diet group (nbaseline=34, nVLCD=34, nCONVD=30, nMAINT=32 participants). d, Total daily caloric intake during diet phases (nintervention as in panels c and e, control group nbaseline=30, nCONVD=22, nMAINT=24 participants) f, Decreases in relative body fat are observed in the intervention group (nbaseline=40, nCONVD=36, nMAINT=33 participants) relative to the control group (nbaseline=40, nCONVD=24, nMAINT=26 participants). g, Diet leads to improvement in glucose tolerance as measured by oral glucose tolerance test within and between diet (nbaseline=40, nCONVD=36, nMAINT=35 participants) and control (nbaseline=40, nCONVD=25, nMAINT=26 participants) groups. Statistical testing performed by LMM with Tukey’s two-sided all-pair comparison. In boxplots, the median is represented by the center line with the box representing the 1st and 3rd quartiles, whiskers extend 1.5x the interquartile range with outliers individually plotted.
Extended Data Figure 2.
Extended Data Figure 2.. Reproducible and reversible shifts are observed in the gut microbiota as a result of caloric restriction in both 16S rRNA amplicon and shotgun metagenomic sequencing data.
a, Concentration of fecal DNA reveals decreased microbiota abundances in response to VLCD contrasting within diet (nbaseline=21, nVLCD=16, nCONVD=17, nMAINT=7 participants) and between control (nbaseline=19, nCONVD=5, nMAINT=7 participants) groups. Microbiotas determined by 16S rRNA gene sequencing revert to a state more closely resembling baseline samples after VLCD (n=19–33/group/timepoint as listed in Supplementary Table 3) by both b, Bray-Curtis Dissimilarity and c, Jensen Shannon divergence (also P<0.001 R2=0.031 ADONIS with Participant ID as stratum). d, Reproducible shifts in community membership are observed across individuals on the second principal coordinate in response to diet followed by reversion during conventional diet and maintenance (Unweighted UniFrac). Each series of connected points represents a single individual in the study with the number representing the timepoint of the study in months. e, Genera whose abundances are altered by VLCD demonstrate rapid reversion during the conventional diet (30 most important genera by GINI coefficient displayed, Random Forest, *FDR Q<0.1 ALDEx2). f, Shannon diversity is significantly decreased after conventional diet (P=0.047, n=29, mean difference = 0.149 [0.002 – 0.296 95%CI], paired Welch’s two-sided t-test). g, Microbiotas revert to a state more closely resembling baseline samples after VLCD, as measured through species-level metagenomic assignments (P=0.012, n=15–29/group/timepoint as listed in Supplementary Table 3, two-sided Wilcoxon signed rank test). h, Metagenomic species whose abundances are altered by VLCD demonstrate rapid reversion during the conventional diet and maintenance phases (30 most important genera by GINI coefficient displayed. i, Volcano plot of differentially abundant KEGG orthologies (KOs) by contrast in metagenome data. VLCD demonstrates the largest effect size with apparent reversion when contrasted against CONVD (conventional diet). Effects of CONVD compared to baseline, and cross-group comparisons yield minimal significant results. Statistical analysis was conducted with Limma. j, Branched chain amino acids leucine and isoleucine are significantly reduced during VLCD (nintervention=18, ncontrol=10 participants/timepoint, Wilcoxon signed-rank test). k, The butanoyl-CoA:acetoacetate CoA-transferase alpha subunit, an enzyme catalyzing the final step in the production of butyrate, is increased in relative abundance (RPKG reads per kilobase per genome equivalent; FDR Q=0.032 Limma; Supplementary Table 4). l, Normalizing relative abundance of butanoyl-CoA:acetoacetate CoA-transferase with qPCR quantification of 16S rRNA gene copies to infer the absolute number of genome equivalents (GE) in the sample demonstrates a decrease in the absolute abundance of the enzyme family (P=0.017, LMM with Tukey two-sided all-pair comparison). Sample size in number of participants for panels k and l are nbaseline=29, nVLCD=24, nCONVD=29, nMAINT=28. In boxplots, the median is represented by the center line with the box representing the 1st and 3rd quartiles, whiskers extend 1.5x the interquartile range with outliers individually plotted.
Extended Data Figure 3.
Extended Data Figure 3.. Diet-dependent changes in the microbiome are maintained following transplantation to germ-free mice.
a, Distribution of weight loss in diet intervention participants identifies the 5 individuals that lost the most weight for transplantation to GF C57BL/6J mice. b, Experiment design and microbiota sampling times. c, Differential 16S rRNA amplicon sequence variant (ASV) abundances in human donors and recipient mice demonstrates 58 candidate effectors of the weight loss phenotype (ZIBR FDR Q<0.1, Supplementary Data Table 6). Note: taxonomy assigned using SILVA 123 with Peptoclostridium difficile synonymous for C. difficile. d, Functional differences between pre- and post-diet recipient communities by enrichment of KEGG functional pathways based on inferred gene content from amplicon sequencing (PICRUSt, Supplementary Data Table 7). Contrasting groups predicts altered amino acid, carbohydrate, and SCFA metabolic function. Central nodes represent KEGG pathways significantly enriched by their constituent significant differentially abundant KEGG orthologies shown with fold change (color) and FDR value (size) indicated (FDR Q<0.1, LMM). e, Detection of C. difficile and TcdA/TcdB by endpoint PCR, ELISA, and selective and differential culture demonstrates active toxin production in post-diet mice at sacrifice.
Extended Data Figure 4.
Extended Data Figure 4.. Replication microbiome transplantation experiments.
a, Replication of top 5 weight losers during conventional diet demonstrates significant differences in body weight between pre- and post-diet mice (Fig. 2b) without significant differences in b, body fat and c, food consumption. (npre-diet=7, npost-diet=8 mice, LMM). Each point in panel c represents the measurement for a single mouse at a single day. d, Transplantation of pooled fecal samples from top 5 weight losers during VLCD reveals significantly more weight loss in post-diet recipient mice (LMM). e, A trend in reduced body fat and f, OGTT are observed in post-diet recipient mice (P=0.18 and P=0.43 respectively, two-sided Mann-Whitney U test). npre-diet=5, npost-diet=6 mice in panels d-f. g, Food intake is not significantly different between pre- and post-diet recipient mice over time and between groups (P=0.70, LMM npost-diet=6, npre-diet=5 mice measured over 16 timepoints as identified in panel d). h, Transplantation of pooled fecal samples from the median 4 weight losers reveals a small but significant effect on weight gain in recipient mice (LMM, npre-diet=13, npost-diet=12 mice/timepoint) with i, associated reduction in body fat as measured by epididymal fat pad weight (P=0.036, one-tailed Welch’s t-test). j, No significant differences are observed in oral glucose tolerance tests in this cohort (area under the curve, P=0.650, two-sided Mann-Whitney U test). Error bars represent mean±SEM where relevant. TcdA/B ELISA demonstrates a lack of stable C. difficile colonization in k, CONVD and l, VLCD replication experiments (ELISA reactions shown for individual animals at days 4 and 20 post colonization respectively). Linear mixed effects models (LMM) with participant as random effect and Tukey two-sided all-pair comparison unless otherwise noted. In boxplots, the median is represented by the center line with the box representing the 1st and 3rd quartiles, whiskers extend 1.5x the interquartile range with outliers individually plotted.
Extended Data Figure 5.
Extended Data Figure 5.. Characterization of C. difficile JBZPo1.
a, JBZPo1 was assembled with 255-fold coverage (Illumina MiSeq 250) into 120 contigs (inner grey track, N50=87,201bp) with an average GC content of 28.6% (green-purple center track showing GC content), and 3,777 CDS (outer red and blue tracks displaying + and - strands respectively). b, C. difficile pathogenicity locus (PaLoc) encodes both toxin A (tcdA) and B (tcdB). c, The binary toxin (cdt) locus (CdtLoc) does not encode intact binary toxin. (d) Phylogenetic tree of 717 C. difficile genomes and associated virulence factor carriage places JBZPo1 flanked by Ribotype 014–20 strains and separate from the hypervirulent epidemic NAP1/B1/027 strains (ex. R20291).
Extended Data Figure 6.
Extended Data Figure 6.. Extended data relating to C. difficile sufficiency experiments.
a, Experimental design relating to JBZPo1 transplantation experiment (Fig. 3b). b, Establishment of colonization with C. difficile JBZPo1 does not lead to dehydration as determined by hydration ratio (hydration ratio = [total body water - free water] / lean mass; P=0.59, two-sided Mann-Whitney U test). In panel b, the median is represented by the center line with the box representing the 1st and 3rd quartiles, whiskers extend 1.5x the interquartile range with outliers individually plotted. c, Body composition analysis revealed a significantly difference between humanized vehicle control and C. difficile mice at sacrifice (P<0.001, LMM with Tukey’s two-sided all-pair comparison, n=6/group) suggesting that C. difficile led to increased adiposity. d, Quantification of JBZPo1 in recipient mice (P=0.003–0.006, n=6 mice/group/timepoint except n=5 mice at 8 days in humanized control due to missing sample, two-sided Mann-Whitney U test). Error bars represent the mean±SEM. e, Cecal contents ELISA of recipient mice confirmed production of TcdA/TcdB in only JBZPo1 recipient mice at sacrifice. f, Blinded pathological analysis reveals minor neutrophil infiltration with reactive changes (two-sided Mann-Whitney U test, n=6 mice/group).
Extended Data Figure 7.
Extended Data Figure 7.. Diet-induced microbiota shifts influence C. difficile-associated weight loss and Toxin B expression.
a, Experimental design. b, Weight loss over time demonstrates a significant effect of Diet (n=7–8 mice/group/day as indicated in panel a, P=5.9e-5, estimate= −4.6 % [−6.6 - −2.7 95%CI] [VLCD], P=1.5e-7, estimate= −6.6 % [−8.5 - −4.6 95%CI] [CONVD]). c, Higher TcdB expression is observed in CONVD-colonized mice at 2 days post colonization versus baseline (P=0.003, n=7–8 mice/group as indicated in panel a, Kruskal-Wallis with two-sided Dunn’s Test). d, C. difficile carriage is not significantly different suggesting modulation of virulence, with the exception of 8 days post colonization in VLCD-recipient mice (P=0.017 CONVD vs baseline, n=7–8 mice/group as indicated in panel a, two-sided Mann-Whitney U test). Error bars represent the mean±sSEM in panels c and d. e, Concentrations of key bile acids in P50 in response to diet (n=1 participant/timepoint). Linear mixed effects models (LMM) with participant as random effect and Tukey two-sided all-pair comparison unless otherwise noted.
Extended Data Figure 8.
Extended Data Figure 8.. Extended Data relating to necessity of Toxins A and B in metabolic phenotypes.
a, Experimental design relating to C. difficile 630 toxin-deficient mutant transplantation experiment (Fig. 3g). b, Colonization with TcdA/B+ strains does not lead to dehydration in GF animals and increases hydration in humanized animals (P=0.06 and P=0.0016 respectively, Kruskal-Wallis with two-sided Dunn’s Test). c, Cecal C. difficile colonization level is not significantly different between strains (P=0.37 and P=0.11 for GF and humanized respectively, Kruskal-Wallis with two-sided Dunn’s Test), but is altered in mono-colonization versus humanized mice. d, Cecal contents ELISA confirms production of toxin in only C. difficile 630 Δerm mutants. e, dense neutrophil and lymphocyte infiltration along with moderate epithelial hyperplasia and goblet cell loss due to TcdA+ TcdB+ C. difficile irrespective of colonization background (Kruskal-Wallis test with two-sided Dunn’s post-hoc test). In panels b-e, n=5–6 mice/group as indicated in panel a.
Extended Data Figure 9.
Extended Data Figure 9.. Metabolomic profiling of top 5 weight losers subgroup supports A working model for the impact of caloric restriction on colonization resistance.
a, Branched chain amino acid and b, short-chain fatty acids are decreased during VLCD and CONVD relative to baseline in top 5 weight losers (n=5 individuals/timepoint). c, Significantly different bile acid levels in top 5 weight losers implicate altered bile acid profiles in permissibility to C. difficile (n=5 individuals/timepoint). Error bars represent mean±SEM where applicable. Statistical testing for panels a-c done via LMM with Tukey’s two-sided all-pair comparison. d, Working model for the complex interactions between caloric restriction, the gut microbiome, and C. difficile. We propose that caloric restriction decreases host production of primary bile acids, including cholic acid (CA), while also lowering total gut microbial colonization, and shifting gut microbial community structure. Together, these effects lead to the decreased production of the C. difficile-inhibitory deoxycholic acid (DCA) allowing for expansion of C. difficile which in turn disrupts host energy balance. Importantly, our data also supports C. difficile-independent mechanisms for weight loss due to the restructuring of the gut microbiome following caloric restriction. e, Representative culture plate showing presumptive C. difficile colonies with characteristic yellow appearance and filamentous edges.
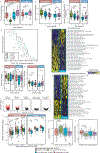
Figure 1.
Figure 1.. Very low-calorie diets alter microbiota composition and activity.
a, Diet participants lost significantly more weight over time versus controls over the combined 12-week intervention (0.84%/week [0.68–1.0 95%CI], P<2.2e-16, LMM, ncontrol=40, nintervention=40 participants). b, The VLCD decreases overall gut microbial colonization as demonstrated by qPCR-based quantification of 16S rRNA gene copies per gram wet weight (P<0.001, nintervention n=39, ncontrol n=35 participants, LMM). c, Richness of 16S rRNA gene sequence variants (ASVs) increases following the consumption of VLCD (P=0.010, nintervention=37, ncontrol=32 participants, negative binomial generalized LMM). d, Microbiome functional capacity, as measured through shotgun metagenomic sequencing, is altered by VLCD (Supplementary Table 4; FDR Q<0.1, Limma and mROAST). The tree demonstrates a functional hierarchy where inner nodes and outer tips represent pathways and modules respectively. (Inset) A heatmap of significantly different KEGG Orthologies (KOs) demonstrates their reversion when contrasted against the CONVD where minimal differences are observed relative to baseline (Extended Data Fig. 2i). e, Heat map of diet-induced changes to carbohydrate active enzymes (CAZymes, FDR Q<0.1 two-sided paired t-test VLCD vs baseline) demonstrates that changes revert in subsequent timepoints (Supplementary Table 5). f, Short-chain fatty acids acetate, butyrate, and valerate are significantly reduced during VLCD (nintervention=18, ncontrol=10 participants/timepoint, FDR Q-values<0.1, two-sided Wilcoxon signed-rank test, downward triangles represent a concentration <10 μg/g). Statistical analysis carried out using linear mixed effects models (LMM) with participant as random effect and Tukey all-pair two-sided comparison unless otherwise noted. In boxplots, the median is represented by the center line with the box representing the 1st and 3rd quartiles, whiskers extend 1.5x the interquartile range with outliers individually plotted.
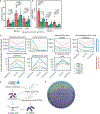
Figure 2.
Figure 2.. Weight loss and improved metabolic health are transmissible via the gut microbiome.
a, Principal coordinates analysis of unweighted UniFrac distances demonstrates that compositionally distinct communities were established comparing pre- and post-diet recipients across all timepoints with early temporal instability (Ptime=0.0001 R2=0.17, Pgroup=0.0001 R2=0.18, ADONIS). Each mouse is represented as a vector over time terminating at an arrow (day 21). b, Change in mouse weight over time demonstrates significant weight loss in post-diet as compared to GF and pre-diet recipients (12.2% [6.5–17.8 95%CI], P=0.0014 LMM). c, Decreased adiposity was observed in pre- versus post-diet recipients compared to GF controls (P=0.025). d, Pre-diet colonization has a significant effect on oral glucose tolerance as compared to GF controls (P=0.014). e, Food consumption did not differ between groups (P=0.63, n=4 time intervals normalized to nmice and interval length in days). f, Stool energy density (kCal/g dry mass) is increased in mice colonized with the post-diet microbiome (P=0.025 LMM, collected at days 1 [npre-diet=2 npost-diet=3 mice], 3 [npre-diet=2 npost-diet=4 mice], and 7 [npre-diet=3 npost-diet=4 mice]). Sample numbers for panels a-e are npre-diet=3, npost-diet=5 mice/timepoint). Data presented as mean±SEM where applicable and statistical analysis carried out using a Kruskal-Wallis test with Dunn’s two-sided post-hoc test unless otherwise noted.
Figure 3.
Figure 3.. Endogenous C. difficile is unrestricted by the post-diet microbiota contributing to weight loss in a toxin-dependent manner.
a, C. difficile and tcdB are significantly higher in post-diet recipient mice by sequencing (centered log2-ratio) and qPCR (P=0.0016 and P=0.0032 respectively, LMM, npre-diet=3, npost-diet=5 mice). b, Addition of C. difficile JBZPo1 spores to a reference donor is sufficient to replicate weight loss versus human-microbiota vehicle control (P=0.013, estimate=3.4% [1.2–5.7 95%CI], LMM 2–24 days post-colonization n=6 mice/group, *P<0.05 two-sided Welch’s t-test at individual timepoints. c, Daily food consumption (P=0.61, LMM, n=6 mice/group measured over 13 intervals), and d, water consumption were not significantly different in C. difficile-colonized mice (P=0.08, LMM, n=6 mice/group measured over 14 intervals). e, Oral glucose tolerance shows improved response with C. difficile (P=0.012 two-sided Welch’s t-test of incremental AUC, n=6 mice/group). f, Colon tissue does not show gross evidence of colitis (representative images, n=6 mice/group, scoring in Extended Data Fig. 6f). g, C. difficile induced weight loss in both GF and humanized mice (LMM, n=5–6/group as in Extended Data Figure 8a). h, Food consumption is not different between genotypes (P=0.18, LMM), but i, water consumption is higher in toxin deficient recipient mice (P=0.035 2.3 mL [0.3–4.3 95%CI], LMM, n=5–6 mice/group/timepoint as in Extended Data Fig. 8a). j, Colonization with toxigenic C. difficile reduces body fat (P=0.03 GF, P=0.06 humanized, Kruskal-Wallis Test with Dunn’s two-sided post-hoc test, n=5–6/group as in Extended Data Figure 8a). k, Representative histology demonstrates neutrophil infiltration (Extended Data Fig. 8e). Statistical analysis carried out using linear mixed effects models (LMM) and Tukey two-sided all-pair comparison unless otherwise noted. Error bars represent mean+SEM. In boxplots, the median is represented by the center line with the box representing the 1st and 3rd quartiles, whiskers extend 1.5x the interquartile range with outliers individually plotted.
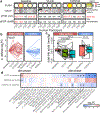
Figure 4.
Figure 4.. Caloric restriction is associated with an expansion of C. difficile and altered bile acid pools.
a, C. difficile presence in 5 individuals with the highest weight loss by fecal ELISA for C. difficile toxins (TcdA/B), selective and differential culture, and qPCR targeting the C. difficile 16S rRNA Gene (Cd.) and the toxin B gene (tcdB). Normalized optical density (OD) is shown for the ELISA with an OD>0.123 taken as a positive reaction. Culture plates are shown, imaged under long-wave UV, showing the presence of presumptive C. difficile colonies (representative indicated with red arrow: fluorescent colonies with ground-glass appearance and filamentous edges, representative plate shown under white light in Extended Data Fig. 9e). Quantitative PCR (qPCR) results are represented as the cycle of quantification (Cq) at which FAM-fluorescence was detected (NA=not assayed). b, C. difficile abundance, determined from metagenomic sequencing, is significantly increased during VLCD with no other significant contrasts (log2 fold difference=0.88±0.28 [mean±SE], P=0.025 LMM with Tukey’s two-sided all-pair comparison, nintervention=29, ncontrol=18 participants). c, Diet intervention significantly affects total bile acid pools in human participants (nintervention=20, ncontrol=10 participants, LMM with Tukey’s two-sided all-pair comparison). In panel c, the centerline represents the median with the limits representing the upper and lower quartiles and whiskers extending up to 1.5x the interquartile range with outliers shown as individual points. d, Differential bile acid pools in response to diet (n=20, FDR-corrected two-sided Wilcoxon signed-rank test, *FDR Q<0.1).

Comment in

  • The gut microbiome in feast and famine.
    Holscher HD. Holscher HD. Nat Rev Gastroenterol Hepatol. 2021 Nov;18(11):749-750. doi: 10.1038/s41575-021-00514-5. Nat Rev Gastroenterol Hepatol. 2021. PMID: 34429532 No abstract available.

References

    1. David LA et al. Diet rapidly and reproducibly alters the human gut microbiome. Nature 505, 559–563 (2014). - PMC - PubMed
    1. Johansson K, Neovius M & Hemmingsson E Effects of anti-obesity drugs, diet, and exercise on weight-loss maintenance after a very-low-calorie diet or low-calorie diet: a systematic review and meta-analysis of randomized controlled trials. Am. J. Clin. Nutr 99, 14–23 (2014). - PMC - PubMed
    1. Louis S, Tappu RM, Damms-Machado A, Huson DH & Bischoff SC Characterization of the Gut Microbial Community of Obese Patients Following a Weight-Loss Intervention Using Whole Metagenome Shotgun Sequencing. PLoS One 11, e0149564 (2016). - PMC - PubMed
    1. Heinsen F-A et al. Beneficial Effects of a Dietary Weight Loss Intervention on Human Gut Microbiome Diversity and Metabolism Are Not Sustained during Weight Maintenance. Obes. Facts 9, 379–391 (2016). - PMC - PubMed
    1. Spranger L et al. Thrifty energy phenotype predicts weight regain – results of a randomized controlled trial. Preprint at 10.1101/2021.03.25.21254300v1 (2021). - DOI

References for Methods

    1. Caporaso JG et al. Ultra-high-throughput microbial community analysis on the Illumina HiSeq and MiSeq platforms. ISME J. 6, 1621–1624 (2012). - PMC - PubMed
    1. Callahan BJ et al. DADA2: High-resolution sample inference from Illumina amplicon data. Nat. Methods 13, 581–583 (2016). - PMC - PubMed
    1. Wang Q, Garrity GM, Tiedje JM & Cole JR Naive Bayesian classifier for rapid assignment of rRNA sequences into the new bacterial taxonomy. Appl. Environ. Microbiol 73, 5261–5267 (2007). - PMC - PubMed
    1. Fernandes AD, Macklaim JM, Linn TG, Reid G & Gloor GB ANOVA-like differential expression (ALDEx) analysis for mixed population RNA-Seq. PLoS One 8, e67019 (2013). - PMC - PubMed
    1. Fernandes AD et al. Unifying the analysis of high-throughput sequencing datasets: characterizing RNA-seq, 16S rRNA gene sequencing and selective growth experiments by compositional data analysis. Microbiome 2, 15 (2014). - PMC - PubMed

Publication types

MeSH terms