. 2021 Jul;595(7868):591-595.
doi: 10.1038/s41586-021-03662-5. Epub 2021 Jun 23.

Phase separation drives aberrant chromatin looping and cancer development

Affiliations

Phase separation drives aberrant chromatin looping and cancer development

Jeong Hyun Ahn et al. Nature. 2021 Jul.

Abstract

The development of cancer is intimately associated with genetic abnormalities that target proteins with intrinsically disordered regions (IDRs). In human haematological malignancies, recurrent chromosomal translocation of nucleoporin (NUP98 or NUP214) generates an aberrant chimera that invariably retains the nucleoporin IDR-tandemly dispersed repeats of phenylalanine and glycine residues1,2. However, how unstructured IDRs contribute to oncogenesis remains unclear. Here we show that IDRs contained within NUP98-HOXA9, a homeodomain-containing transcription factor chimera recurrently detected in leukaemias1,2, are essential for establishing liquid-liquid phase separation (LLPS) puncta of chimera and for inducing leukaemic transformation. Notably, LLPS of NUP98-HOXA9 not only promotes chromatin occupancy of chimera transcription factors, but also is required for the formation of a broad 'super-enhancer'-like binding pattern typically seen at leukaemogenic genes, which potentiates transcriptional activation. An artificial HOX chimera, created by replacing the phenylalanine and glycine repeats of NUP98 with an unrelated LLPS-forming IDR of the FUS protein3,4, had similar enhancing effects on the genome-wide binding and target gene activation of the chimera. Deeply sequenced Hi-C revealed that phase-separated NUP98-HOXA9 induces CTCF-independent chromatin loops that are enriched at proto-oncogenes. Together, this report describes a proof-of-principle example in which cancer acquires mutation to establish oncogenic transcription factor condensates via phase separation, which simultaneously enhances their genomic targeting and induces organization of aberrant three-dimensional chromatin structure during tumourous transformation. As LLPS-competent molecules are frequently implicated in diseases1,2,4-7, this mechanism can potentially be generalized to many malignant and pathological settings.


Conflict of interest statement

Declaration of interests

The authors declare no competing interests.

Figures

Extended Data Figure 1|
Extended Data Figure 1|. Intrinsically disordered region (IDR) retained within the leukemia-related chimeric NUP98-HOXA9 forms phase-separated condensates in vitro and is essential for establishing phase-separated fusion protein assemblies in the nucleus.
a, Schematic showing the domain structure of full-length NUP98 (top), full-length HOXA9 (middle) and NUP98-HOXA9 chimera (bottom; with either GFP or 3XHA-3XFLAG tag fused to C-terminus). GLFG or non-GLFG (xFG) motif contents and other important domains are shown in the box. b, Immunoblotting of full-length (WT) or GLEBS-deleted NUP98-HOXA9, as detected by indicated antibodies, after stable transduction into primary murine hematopoietic stem/progenitor cells (HSPCs). c, Proliferation of murine HSPCs stably transduced with full-length (WT) or GLEBS-deleted NUP98-HOXA9, relative to empty vector-infected controls (n=3 stably transduced cell cultures per group). Data are presented as mean ± standard deviation (SD). d, Live cell fluorescence imaging (GFP; zoomed-in and zoomed-out views on the top and bottom) of 293 cells with stable transduction of GFP-tagged NUP98-HOXA9, either full-length (WT), GLEBS-deleted (also referred to as N-IDRWT/A9), or that with a DNA-binding-disrupting mutation in homeodomain (HDN51S) or a F→S mutation at FG-repeats (IDRFS, also referred to as N-IDRFS/A9) that substitutes Phe residues within FG-repeats to Ser. The right panel shows immunoblotting of normal NUP98 and the stably transduced NUP98-HOXA9, either full-length (WT) or GLEBS-deleted, as detected by a previously described antibody raised against GLEBS of NUP98, into 293 cells. Scale bar, 10μm. e, Schematic of the indicated N-IDR fusion domains with a varying number of FG-repeats. The IDR portion used for in vitro assay in Fig 1d is indicated by a red dotted line. f, SDS-PAGE images showing recombinant protein of N-IDR domain (see red label in panel e) with the indicated varying number of FG-repeats (His6×-tagged), purified with Ni-column and an additional size exclusion column purification step. The protein size is labeled above the recombinant protein. g, Anti-GFP immunoblotting for GFP-tagged NUP98-HOXA9 chimera with the indicated varying number of FG-repeats described in panel e after stable transduction into 293 cells. h, Live cell fluorescence for the N51S-mutated N-IDR/A9 (GFP-tagged) with either WT (top) or the F→S mutated IDR (bottom) in 293 stable expression lines before (left) and after (right) treatment of 10% of 1,6-hexanediol for one minute. The left panels show zoomed-in images of a representative cell from the right panels of zoomed-out images. Scale bar, 10 μm.
Extended Data Fig 2|
Extended Data Fig 2|. IDR harbored within the leukemia-related chimeric TF fusion is required for leukemic transformation of primary murine HSPCs.
a-b, Immunoblotting (panel a) and fixed cell immunostaining (panel b; anti-FLAG) of the LLPS-competent N-IDRWT/A9 and LLPS-incompetent N-IDRFS/A9 after stable transduction into 293 cells. The left side of panel b shows a zoomed-in view of the right side. Scale bar, 10μm. c, Venn diagram shows significant overlap between N-IDRWT/A9 and N-IDRFS/A9 interactomes detected by BioID. Examples of the detected interacting proteins are shown below. d-f, Immunostaining (panel d; anti-GFP), Wright-Giemsa staining (e) and FACS with the indicated surface marker (f) using murine HSPCs transformed by N-IDRWT/A9 (GFP or 3xHA-3xFLAG-tagged) one month post-transduction, which reveals a typical acute myeloid leukemia cell phenotype (cKit+, Cd34+, MacIhigh, CD19-, B220-). The insert in panel d shows a zoomed-in view of the representative cell. Scale bar, 5 μm. g, Haematoxylin-Eosin (H&E)-stained spleen section images for the indicated cohort at 10X magnification. White Pulp (WP) is outlined with white line for the sample from mice transplanted with empty vector (EV)-infected HSPCs (Top). Note that clear demarcation between WP and Red Pulp (RP), as observed in cohorts receiving either EV or the mutant forms of fusion (bottom panels), is lost in those with N-IDRWT/A9 and F-IDRWT/A9 (middle panels) due to an excessive expansion of transformed HPSCs that infiltrated into spleen leading to splenomegaly observed in panel i. h, Live cell fluorescence (GFP) imaging of 293 cells with stable expression of an artificial HOXA9 chimera created by replacing NUP98’s FG-repeats with IDR of an unrelated RNA-binding protein FUS, either WT or Y→S mutated (hereafter referred to as the F-IDRWT/A9 and F-IDRYS/A9 fusion, respectively), before and after treatment with 10% of 1,6-hexanediol for one minute. Scale bar, 10 μm. i, Representative image of spleen from mice seven months post-transplantation of murine HPSCs stably transduced with either F-IDRWT/A9 (left) or F-IDRYS/A9 (right).
Extended Data Fig 3|
Extended Data Fig 3|. ChIP-seq reveals binding patterns of NUP98-HOXA9 that carries either WT or an F→S mutated IDR.
a, Summary of the counts of ChIP-seq read tags for the indicated samples. b, Scatterplots showing correlation of global N-IDRWT/A9 (left) or N-IDRFS/A9 (right) ChIP-seq signals using either HA (x-axis) or GFP (y-axis) antibodies in two biological replicates of 293 stable cells. Coefficient of determination (R2) is determined by Pearson correlation. c, Total number of the called HA ChIP-seq peaks in stable 293 cells expressing HA-tagged N-IDRWT/A9 (left) or N-IDRFS/A9 (middle) or empty vector control (right). d-e, Pie chart showing distribution of the indicated annotation feature among the called N-IDRWT/A9 (d) or N-IDRFS/A9 (e) ChIP-seq peaks in 293 stable expression cells. f-g, Summary of the most enriched motifs identified within the called N-IDRWT/A9 (f) or N-IDRFS/A9 (g) ChIP-Seq peaks in 293 stable expression cells. h, Gene Ontology (GO) analysis of genes associated with broad super-enhancer-like peaks of N-IDRWT/A9 as identified in 293 stable cells.
Extended Data Fig 4|
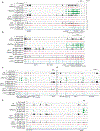
Extended Data Fig 4|. Dramatically enhanced chromatin occupancy, as well as a broad super-enhancer-like binding pattern typically seen at leukemia-related genomic loci, is characteristic for the LLPS-competent NUP98-HOXA9 (N-IDRWT/A9) and not its LLPS-incompetent IDR mutant (N-IDRFS/A9).
a-e, Integrative Genomics Viewer (IGV) views for the indicated ChIP-seq signal at the well-known leukemia-associated loci such as the HOXA (a), HOXB (b) and HOXD (c) gene clusters, MEIS1 (d) and MEIS2 (e). Samples from top to bottom are HA (tracks 1–3) and H3K27ac (tracks 4–6) ChIP-seq signals in the 293 cells stably expressed with either empty vector (tracks 1 and 4; EV as negative control for ChIP specificity) or the HA-tagged N-IDRWT/A9 (tracks 2 and 5) or N-IDRFS/A9 (tracks 3 and 6), GFP ChIP-seq signals (tracks 7–12) in the 293 cells stably expressed with GFP-tagged N-IDRWT/A9 (tracks 7–8 represent samples post-treatment of vehicle or 1,6-hexanediol, respectively), N-IDRFS/A9 (tracks 9–10 represent samples post-treatment of vehicle or 1,6-hexanediol, respectively), F-IDRWT/A9 (track 11) or F-IDRYS/A9 (track 12), as well as CTCF ChIP-seq in 293 cells with N-IDRWT/A9 (track 13) or N-IDRFS/A9 (track 14). HA and CTCF ChIP-seq signals were normalized to input signals, whereas GFP ChIP-seq, conducted in the spike-in controlled experiments, normalized to the spike-in Drosophila chromatin signals (those from antibody of a Drosophila specific histone, H2Av).
Extended Data Fig 5|
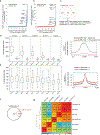
Extended Data Fig 5|. Formation of enhanced and broad super-enhancer-like binding patterns of leukemia-related chimera TFs requires an intact phase-separation-competent IDR.
a-b, Hockey-stick plot shows distribution of the input-normalized ChIP-seq signals of N-IDRWT/A9 (a) or H3K27ac (b) across all enhancers annotated by H3K27ac peaks (TSS +/−2.5kb regions were excluded) in 293 cells. Dotted line indicates the threshold level set by the ROSE algorithm to call super-enhancers. Relative rankings of super-enhancers associated with some example genes are shown. c, Venn diagram illustrates overlap among super-enhancers called based on N-IDRWT/A9 and H3K27ac ChIP-seq signals. d-e, The K-means clustered box plots of averaged ChIP-seq signals of the LLPS-competent N-IDRWT/A9 (panel d; WT) show a dramatic reduction in binding post-treatment of 293 stable cells with 1,6-Hexanediol (WT+H), relative to mock (WT+V); this is particularly significant for peak clusters 1–3 shown in the main Figure 2b. In contrast, N-IDRFS/A9 binding (panel e) shows insensitivity to the same treatment of 1,6-Hexanediol (FS+H) in comparison to mock (FS+V). On the right, averaged ChIP-seq signal distribution profiles are shown for N-IDRWT/A9 and N-IDRFS/A9 over a 10kb region in the indicated cluster as an example. f, Venn diagram to compare genes associated with the super-enhancer-like, broad N-IDRWT/A9 peaks after treatment of 1,6-Hexanediol (+H), relative to vehicle mock (+V). g, Hierarchical clustered heatmaps for the pairwise correlation of ChIP-Seq signals between each of the indicated sample. The coefficients were determined by Pearson correlation. HA and GFP represent HA and GFP ChIP-seq for chimera TFs, respectively; +H and +V represent treatment of 1,6-Hexanediol and vehicle mock, respectively.
Extended Data Fig 6|
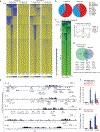
Extended Data Fig 6|. Similar to what was seen with NUP98 IDR (N-IDR) fusion, the phase-separation-promoting property harbored within an unrelated IDR of FUS (FIDR) is sufficient to induce the enhanced binding of chimeric TF.
a, The K-mean clustered heatmaps of NUP98 IDR fusion (N-IDRWT/A9 and N-IDRFS/A9; two panels on the left) and FUS IDR fusion (F-IDRWT/A9 and F-IDRYS/A9; two panels on the right) reveal a similarly enhanced binding for the LLPS-competent chimera that carries a WT form of IDR, relative to its LLPS-incompetent IDR mutant in 293 stable expression cells. Note that, albert to a less degree, the artificially created F-IDRWT/A9 fusion also displays a broad, super-enhancer-like binding pattern at same sites observed with N-IDRWT/A9 fusion. b, Pie chart showing distribution of the indicated genomic annotation features among the ChIP-Seq peaks of GFP-tagged F-IDRWT/A9 (left) or F-IDRYS/A9 (right) in the 293 stable expression cells. c, The K-mean clustered heatmaps (left) and its averaged ChIP-seq signal distribution profiles (right) of NUP98 IDR fusion (N-IDRWT/A9) in the transformed murine HPSCs. d, Venn diagram shows overlap between the annotated genes found in clusters 1–3 of ChIP-seq profiles of transformed murine HPSCs and 293 stable expression cells. Examples of the shared critical oncogenes are shown below. e, IGV views of N-IDRWT/A9 ChIP-seq signals (GFP-tagged) at the indicated loci in murine leukemia cells transformed by this chimera. f, ChIP-qPCR for binding of the GFP-tagged N-IDRWT/A9 or N-IDRFS/A9 at CCL15 (a negative control region), PBX3 and HOXA9 in 293 stable cells post-treatment with 1,6-Hexanediol for one minute (+H), relative to mock (+V). Data are presented as mean ± ±SD of three replicate experiments. *P < 0.05; **P < 0.01; ***P < 0.001; ****P < 0.0001; n.s., not significant. g, ChIP-qPCR for binding of the GFP-tagged F-IDRWT/A9 or F-IDRYS/A9 at CCL15 (a negative control region), PBX3 and HOXA9 in the 293 stable cells. Data are presented as mean ±SD of three replicate experiments. ***P < 0.001.
Extended Data Figure 7|
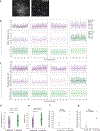
Extended Data Figure 7|. Single-molecule tracking (SMT) shows that phase-separation-competent N-IDRWT/A9 proteins behave with less dynamic characteristics, compared to phase- separation-incompetent N-IDRFS/A9.
a, Representative images of single-molecule particles identification in an N-IDRWT/A9-expressing cell, either the original captured image (left) or after processing to remove background (right). Scale bar represents 5 μm. b-c, Single particle tracks for mean speed (panel b) and mean displacement (c) of either N-IDRWT/A9 or N-IDRFS/A9 single molecules within the temporally registered reference frame binned into one-second intervals. d-e, Displacement (d) and mean velocity (e) of single particle tracks indicate that N-IDRWT/A9 with the LLPS-competent IDR (WT) is less mobile and navigates nuclear space at a slower rate than its LLPS-incompetent IDR mutant (FS). Dots indicate mean values in a single cell. Line indicates one standard deviation. f-g, The diffusion coefficient for chromatin-bound (f) and freely diffusing states (g) of N-IDRWT/A9 or N-IDRFS/A9, calculated based on SMT studies of its 293 stable expression cells.
Extended Data Fig 8|
Extended Data Fig 8|. A LLPS-competent IDR harbored within leukemia-related TF chimera is essential for potentiating transcriptional activation of the downstream oncogenic gene-expression program.
a, Fixed cell immunostaining for the 3xHA-3xFLAG-tagged N-IDRWT/A9 (left panels; anti-FLAG) and the indicated histone modification (middle panels) in 293 stable cells. Shown in the lower insert are enlarged images of an example region (white dotted box) where chimera is co-localized with H3K27ac (top) and not H3K9me3 (bottom). Scale bar, 10 μm. b, Pearson’s correlation coefficient values between N-IDRWT/A9 and the indicated histone marks. The red dotted line indicates the calculated average value of each plot. The calculated means (red dotted lines) were compared with an independent two-tailed Student’s T-test. c, RT-qPCR to assess the impact of phase separation in target gene expression in 293 cells. All of the tested HOX and MEIS2 genes are direct targets of both N-IDRWT/A9 and N-IDRFS/A9. cMYC is not a direct target gene serving as a negative control. Note that only LLPS-competent N-IDRWT/A9 induces significant upregulation of target genes whereas LLPS-incompetent N-IDRFS/A9 shows no or significantly decreased effect. Data are presented as mean ± ±SD of three replicate experiments. ***P < 0.001; ****P < 0.0001; n.s., not significant. d, Heatmap illustrating relative expression of the 374 genes that show significant upregulation post-transduction of F-IDRWT/A9, compared to empty vector (EV) and its IDR-mutant form (F-IDRYS/A9), in 293 cells. e, Venn diagrams show overlap of the significantly downregulated genes identified post-transduction of the indicated construct into mouse HPSCs. f, Gene Set Enrichment Analysis (GSEA) shows that, compared to N-IDRFS/A9, N-IDRWT/A9 is positively correlated with the indicated leukemia- or HSPC-related genesets (top) and negatively correlated with the indicated differentiation-related genesets (bottom). g, Venn diagrams show overlap of the significantly upregulated (left) or downregulated (right) genes identified post-transduction of the indicated construct into mouse HPSCs.
Extended Data Fig 9|
Extended Data Fig 9|. Hi-C mapping reveals that a phase-separation-competent IDR harbored within NUP98-HOXA9 is required for inducing formation of CTCF-independent chromatin loops at leukemia-relevant gene loci.
a, Matrix of Pearson correlation coefficients of loop counts among and between biological replicates of N-IDRWT/A9 (WT; n=4 replicates) or N-IDRFS/A9 (FS; n=4 replicates) conditions. Condition is denoted along the diagonal as WT or FS, followed by numbers indicating biological replicate for that condition. b, Example correlation plots of loop counts between biological replicates and conditions. c, All loops were partitioned into either WT or FS-specific loops and split into separate loop anchors. Loop anchors were then intersected with ChIP-seq peaks for N-IDR/A9 or CTCF. The percentage of observed (Obs.) overlaps for each feature is shown as a vertical blue line. The red line shows the expected (Exp.) distribution of overlaps as determined by randomly sampling loop anchors and calculating each feature’s overlap 1000 times. P-values were determined by summing the number of expected values greater than (or less than if the observed value was less than the mean) the observed value for that feature. d-g, 3C-qPCR assays measuring the change in crosslinking frequency of either an N-IDRWT/A9-specific loop at PBX3 locus (d-e) or a CTCF-dependent loop (f-g; at Chr17 [41604677 – 41883642]) after treatment of 293 stable cells with 10% of 1,6-hexanediol for one minute (+H) relative to mock (+V). The IGV view panels at d,f show the indicated ChIP-seq signals, with positions of the used 3C-PCR primers labeled under IGV tracks. PCR was performed using the same constant forward primer (C) paired with a differently numbered reverse primer (P1 to P4) at each locus tested. Panels e,g are plotted with signals of 3C-qPCR measuring the relative crosslinking frequency at PBX3 (d-e) or a Chr17 locus with CTCF loop (f-g) before (V) and after (H) treatment with 1,6-hexanediol. Signals in panel e are normalized to those of the N-IDRFS/A9-expressing cells (n =3 replicated experiments). ns, no significant.
Extended Data Fig 10|
Extended Data Fig 10|. Hi-C mapping reveals chromatin loops specific to cells with the LLPS-competent NUP98-HOXA9, compared to the LLPS-competent mutant, at leukemia-relevant gene loci.
Views for Hi-C mapping, RNA-seq, and ChIP-seq for CTCF, N-IDR/A9, and H3K27ac at the HOXB (a), EYA4 (b), and SKAP2-HOXA loci (c) in 293 stable cells expressing either N-IDRWT/A9 (WT) or N-IDRFS/A9 (FS). Hi-C mapping views (top panels) show results from the N-IDRWT/A9 or N-IDRFS/A9 expressing cells (lower and upper diagonal, respectively). Corresponding ChIP-seq and gene tracks are shown below each Hi-C plot. N-IDRWT/A9 loops are indicated with red arrows.
Extended Data Fig 11.
A model illustrating a critical requirement of LLPS-competent IDR harbored within NUP98-HOXA9 for enhancing chimeric TF binding to genomic targets and for promoting long-distance chromatin looping between leukemogenic gene promoter/enhancers, thereby inducing an oncogenic gene-expression program and leukemic development.
Figure 1.
Figure 1.. IDRs within chimeric TF oncoproteins establish phase-separated assemblies, inducing leukemogenesis.
a, Scheme for N-IDR/A9 and F-IDR/A9 chimera, with the F→S and Y→S mutations introduced to the NUP98 and FUS IDRs, respectively, shown in box. HD, homeodomain. b-c, Immunoblotting (b) and live-cell fluorescence (c) for GFP-tagged chimera carrying the WT or mutant IDR in 293 cells. 1,6-hex, 1,6-hexanediol. Scale bar, 10 μm. d-e, Differential interference contrast (DIC) and concurrent fluorescence imaging (bottom) of N-IDR recombinant proteins harboring the varying number of FG-repeats, prepared at the indicated concentration with either single protein species (d) or a mixture of the two (e). PEG, polyethylene glycol-3350. Scale bar, 10 μm. f, Live-cell imaging of GFP-tagged N-IDR/A9 with the indicated number of FG-repeats. Scale bar, 10 μm. g, Live-cell imaging (GFP) and concurrent phase-contrast imaging for N51S-mutated GFP-NUP98-HOXA9 with either WT (top) or F→S-mutated IDR (bottom). Arrows indicate droplet-like structures. Scale bar, 10μm. h, Coalescence of GFP-NUP98-HOXA9 condensates (N51S-mutated). Scale bar, 2 μm. i, Proliferation of murine HSPCs transduced with empty vector (EV) or the indicated chimera (n=3 independent biological replicates; data presented as mean ± SD). j, Kaplan-Meier survival plot of mice post-transplantation of HSPCs transduced with the indicated chimera (n=5 mice per group). k, Splenomegaly associated with N-IDRWT/A9-induced leukemias, three months post-transplantation of infected HSPCs into mice.
Figure 2.
Figure 2.. Phase separation dramatically enhances chromatin binding of NUP98-HOXA9, featured with broad, ‘super-enhancer’-like genomic occupancy.
a,d, Heatmaps for k-means clustering of ChIP-seq signals in 293 cells expressing HA-tagged (a; input-normalized) or GFP-tagged (a; spikein control normalized) N-IDR/A9 with either WT or F→S mutated IDRs. Cells in (d) were treated with 10% of 1,6-hexanediol (+H), compared to vehicle (+V), for one minute. Each row represents a peak called for WT samples (first column) (±5Kb from peak center). b,c, IGV tracks of the indicated ChIP-seq signals at HOXB (b) and PBX3 (c) in 293 cells. EV-transduced cells serve as a ChIP control.
Figure 3.
Figure 3.. Fusing an unrelated LLPS-competent IDR of FUS with HOXA9’s HD (F-IDR/A9), as well as altering the FG-repeats valency in NUP98-HOXA9, demonstrates a role for IDR and LLPS in promoting target oncogene activation and cancerous transformation.
a, ChIP-seq signal heatmaps showing N-IDR/A9 (HA-tagged; left) and F-IDR/A9 (GFP-tagged; right), either WT or IDR-mutated (FS or YS), in 293 cells. See also Extended Data Fig 6a. b, Venn diagram using direct targets of N-IDRWT/A9 or F-IDRWT/A9 in 293 cells, with a battery of leukemia-related oncogenes highlighted. c, ChIP-qPCR for binding of GFP-tagged N-IDR with the indicated number of FG-repeats at examined loci in 293 cells (n=3 independent samples; data presented as mean ± S.D.). CCL15 acts as a control. Statistics was performed with two-sided t-test. *P<0.05; **P<0.01; ***P<0.001; ****P<0.0001. d, Single-molecule imaging estimated the fraction of chromatin-bound N-IDRWT/A9 and N-IDRFS/A9 in 293 stable cells. Presented are values based on two-state kinetic modeling (individual standard deviations <0.0003). Black bar, averaged value. e, Heatmap of 303 genes upregulated in 293 cells post-transduction of N-IDRWT/A9, compared to EV and N-IDRFS/A9. f, Boxplots showing relative expression of 303 N-IDRWT/A9-activated genes in e among the indicated pairwise comparison of 293 cells. Boxes extend from the first quartile to third quartile values of dataset, with a line showing the median. The whiskers extend from the box edges to show the data range. Statistics was conducted with two-sided t-test. g, Venn diagram using genes upregulated in mouse HPSCs post-transduction of the indicated construct. h, RT-qPCR for oncogenes in 293 cells expressing chimera with the indicated number of FG-repeats (n=3 independent samples; data presented as mean ± S.D.). Expression was normalized to the 0×FG-repeat sample. Statistics was performed with two-sided t-test. *P<0.05; **P<0.01; ***P<0.001; ****P<0.0001; ns, not significant. i, Proliferation of murine HSPCs transduced with N-IDR fusion with the indicated number of FG-repeats (n= 3 independent replicates; data presented as mean ± SD).
Figure 4.
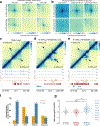
Figure 4.. Phase-separation-competent IDRs harbored within NUP98-HOXA9 induce CTCF-independent looping at oncogenes.
a, Aggregate peak analysis (APA) for all loops (n=6,615), WT-specific (n=232) and FS-specific (n=52) loops defined by Hi-C in 293 cells expressing N-IDRWT/A9 (top) or N-IDRFS/A9 (bottom). Pixel color represents the mean interaction counts per loop, plotted on a common scale. b, APA plots at 10 Kb resolution for interactions between the 500 strongest N-IDR/A9 binding sites in cells with N-IDRWT/A9 (top) or N-IDRFS/A9 (bottom). Paired interactions were categorized as inter-chromosomal (n=95,959), long (>=2Mb) intra-chromosomal (n=6,298), or short (<2Mb) intra-chromosomal (n=574). Pixel color represents the mean interaction counts per pair of loci interrogated. Color scale in each plot is adjusted to the maximum value. c-e, Non-differential static (c), N-IDRWT/A9-specific (d; “Gained in WT” at PBX3) and N-IDRFS/A9-specific loop (e; “Lost in WT”) detected by Hi-C (arrowheads in top panel) with 293 cells expressing N-IDRWT/A9 (below diagonal) or N-IDRFS/A9 (above diagonal). Bottom panels show CTCF (blue) and N-IDR/A9 (orange) ChIP-seq signals (gene tracks shown below) in same cells. Note that CTCF but not N-IDR/A9 is present at the loop anchors. f, Percentage of the indicated feature present either at all loops or WT-specific loops. Significance was determined by a permutation test as described in the Methods section. *P < 0.001. g, Relative expression of genes associated with WT-specific (n=77) and FS-specific loops (n=7) in 293 cells expressing N-IDRWT/A9 versus N-IDRFS/A9. *BH-adjusted P<0.05; *** Benjamini–Hochberg-adjusted P<0.00001.

Comment in

References

    1. Gough SM, Slape CI & Aplan PD NUP98 gene fusions and hematopoietic malignancies: common themes and new biologic insights. Blood 118, 6247–6257, doi: 10.1182/blood-2011-07-328880 (2011). - DOI - PMC - PubMed
    1. Mendes A & Fahrenkrog B NUP214 in Leukemia: It’s More than Transport. Cells 8, doi: 10.3390/cells8010076 (2019). - DOI - PMC - PubMed
    1. Murray DT et al. Structure of FUS Protein Fibrils and Its Relevance to Self-Assembly and Phase Separation of Low-Complexity Domains. Cell 171, 615–627.e616, doi: 10.1016/j.cell.2017.08.048 (2017). - DOI - PMC - PubMed
    1. Alberti S & Hyman AA Biomolecular condensates at the nexus of cellular stress, protein aggregation disease and ageing. Nat Rev Mol Cell Biol 22, 196–213, doi: 10.1038/s41580-020-00326-6 (2021). - DOI - PubMed
    1. Boija A, Klein IA & Young RA Biomolecular Condensates and Cancer. Cancer cell 39, 174–192, doi: 10.1016/j.ccell.2020.12.003 (2021). - DOI - PMC - PubMed

Publication types