. 2021 Jul;595(7868):585-590.
doi: 10.1038/s41586-021-03648-3. Epub 2021 Jun 23.

Clonal fitness inferred from time-series modelling of single-cell cancer genomes

Collaborators, Affiliations

Clonal fitness inferred from time-series modelling of single-cell cancer genomes

Sohrab Salehi et al. Nature. 2021 Jul.

Abstract

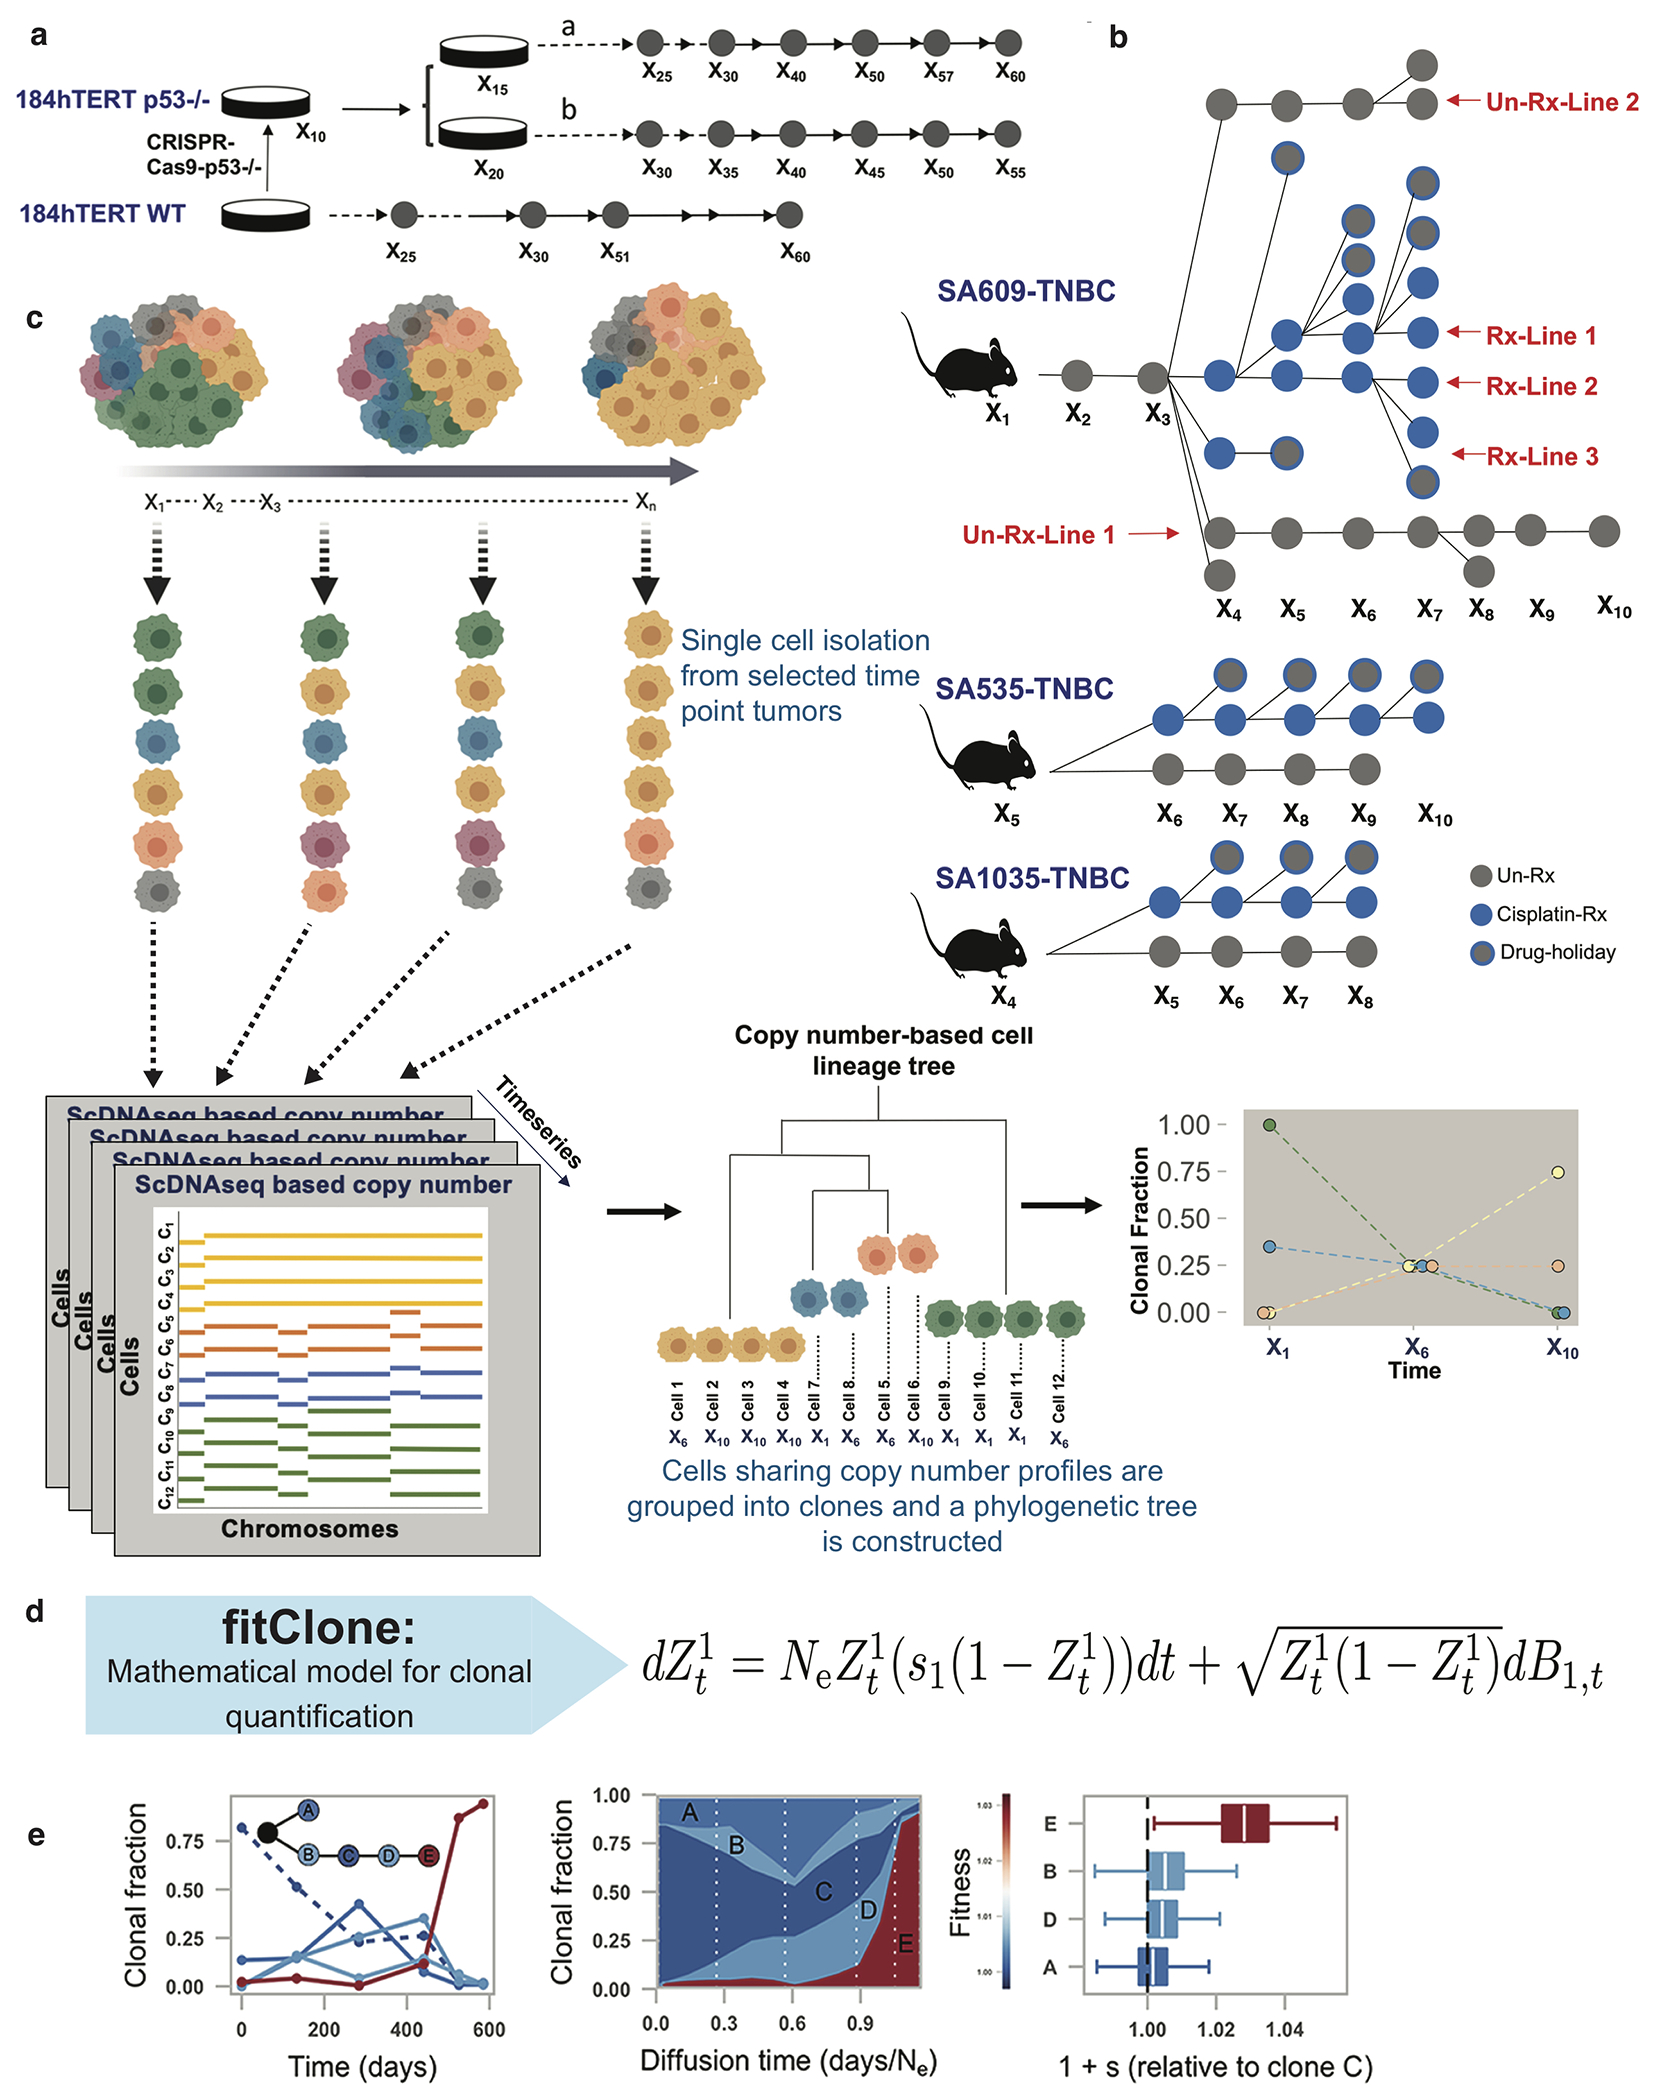
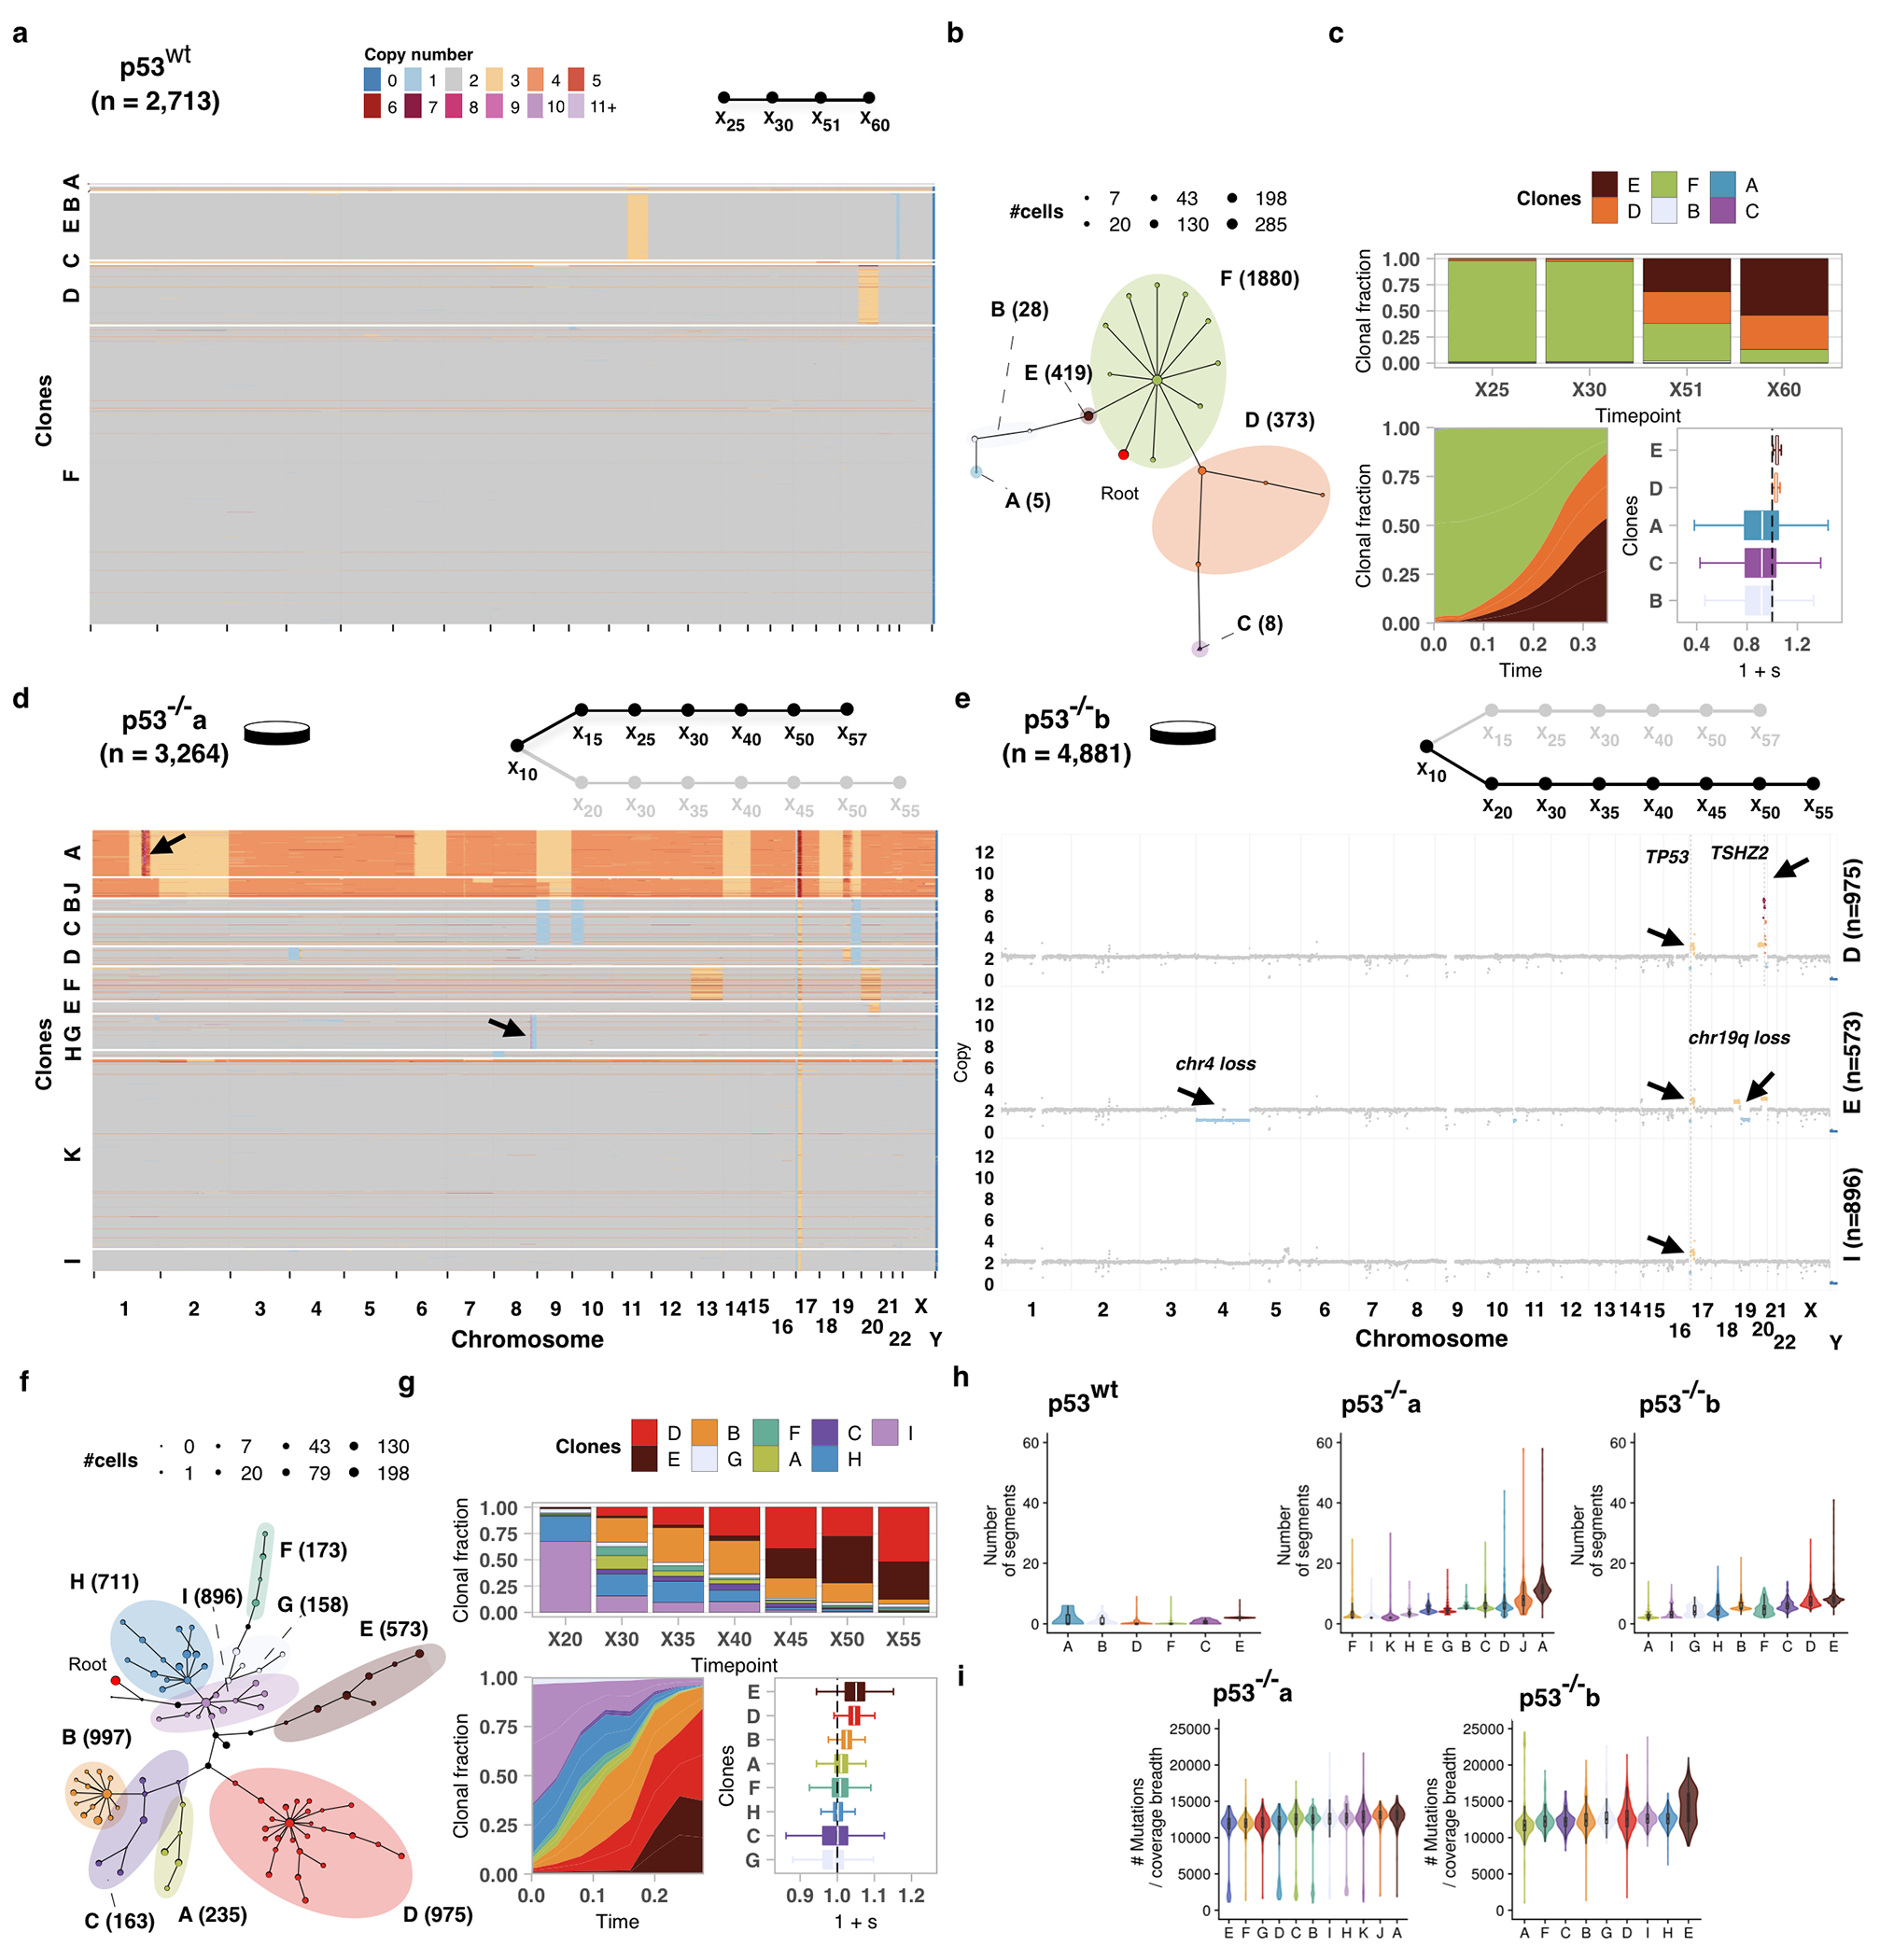
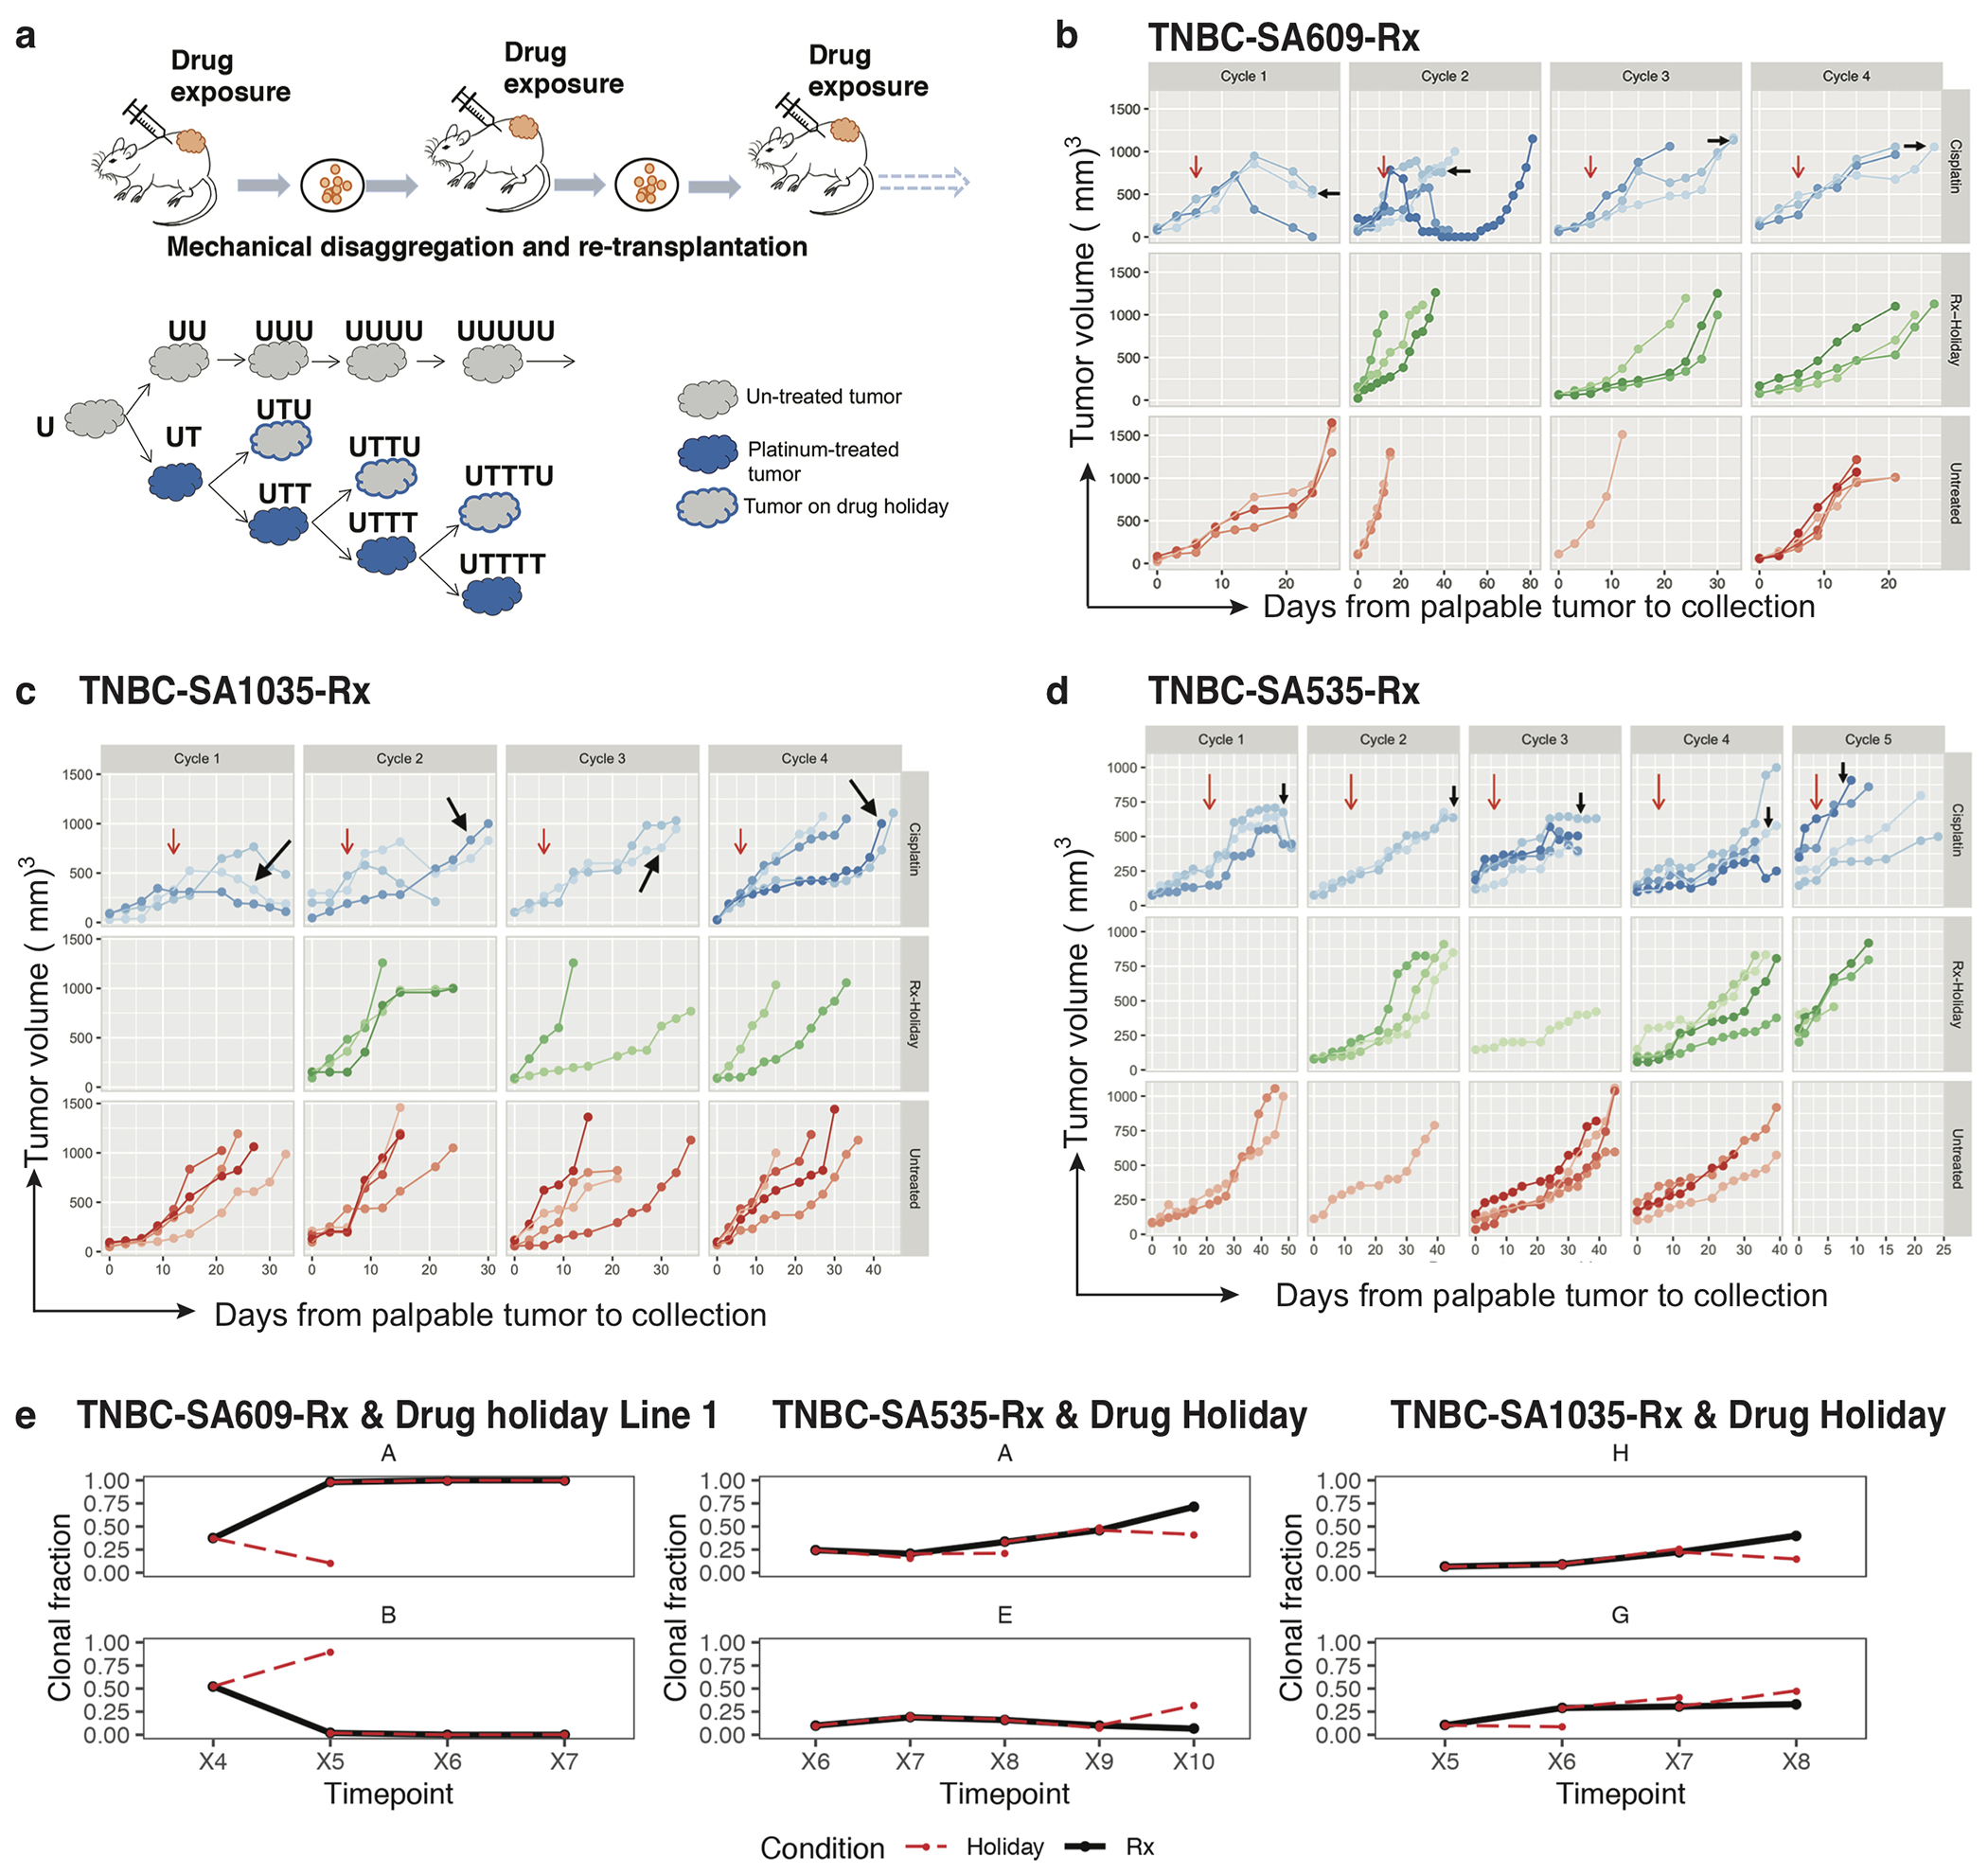
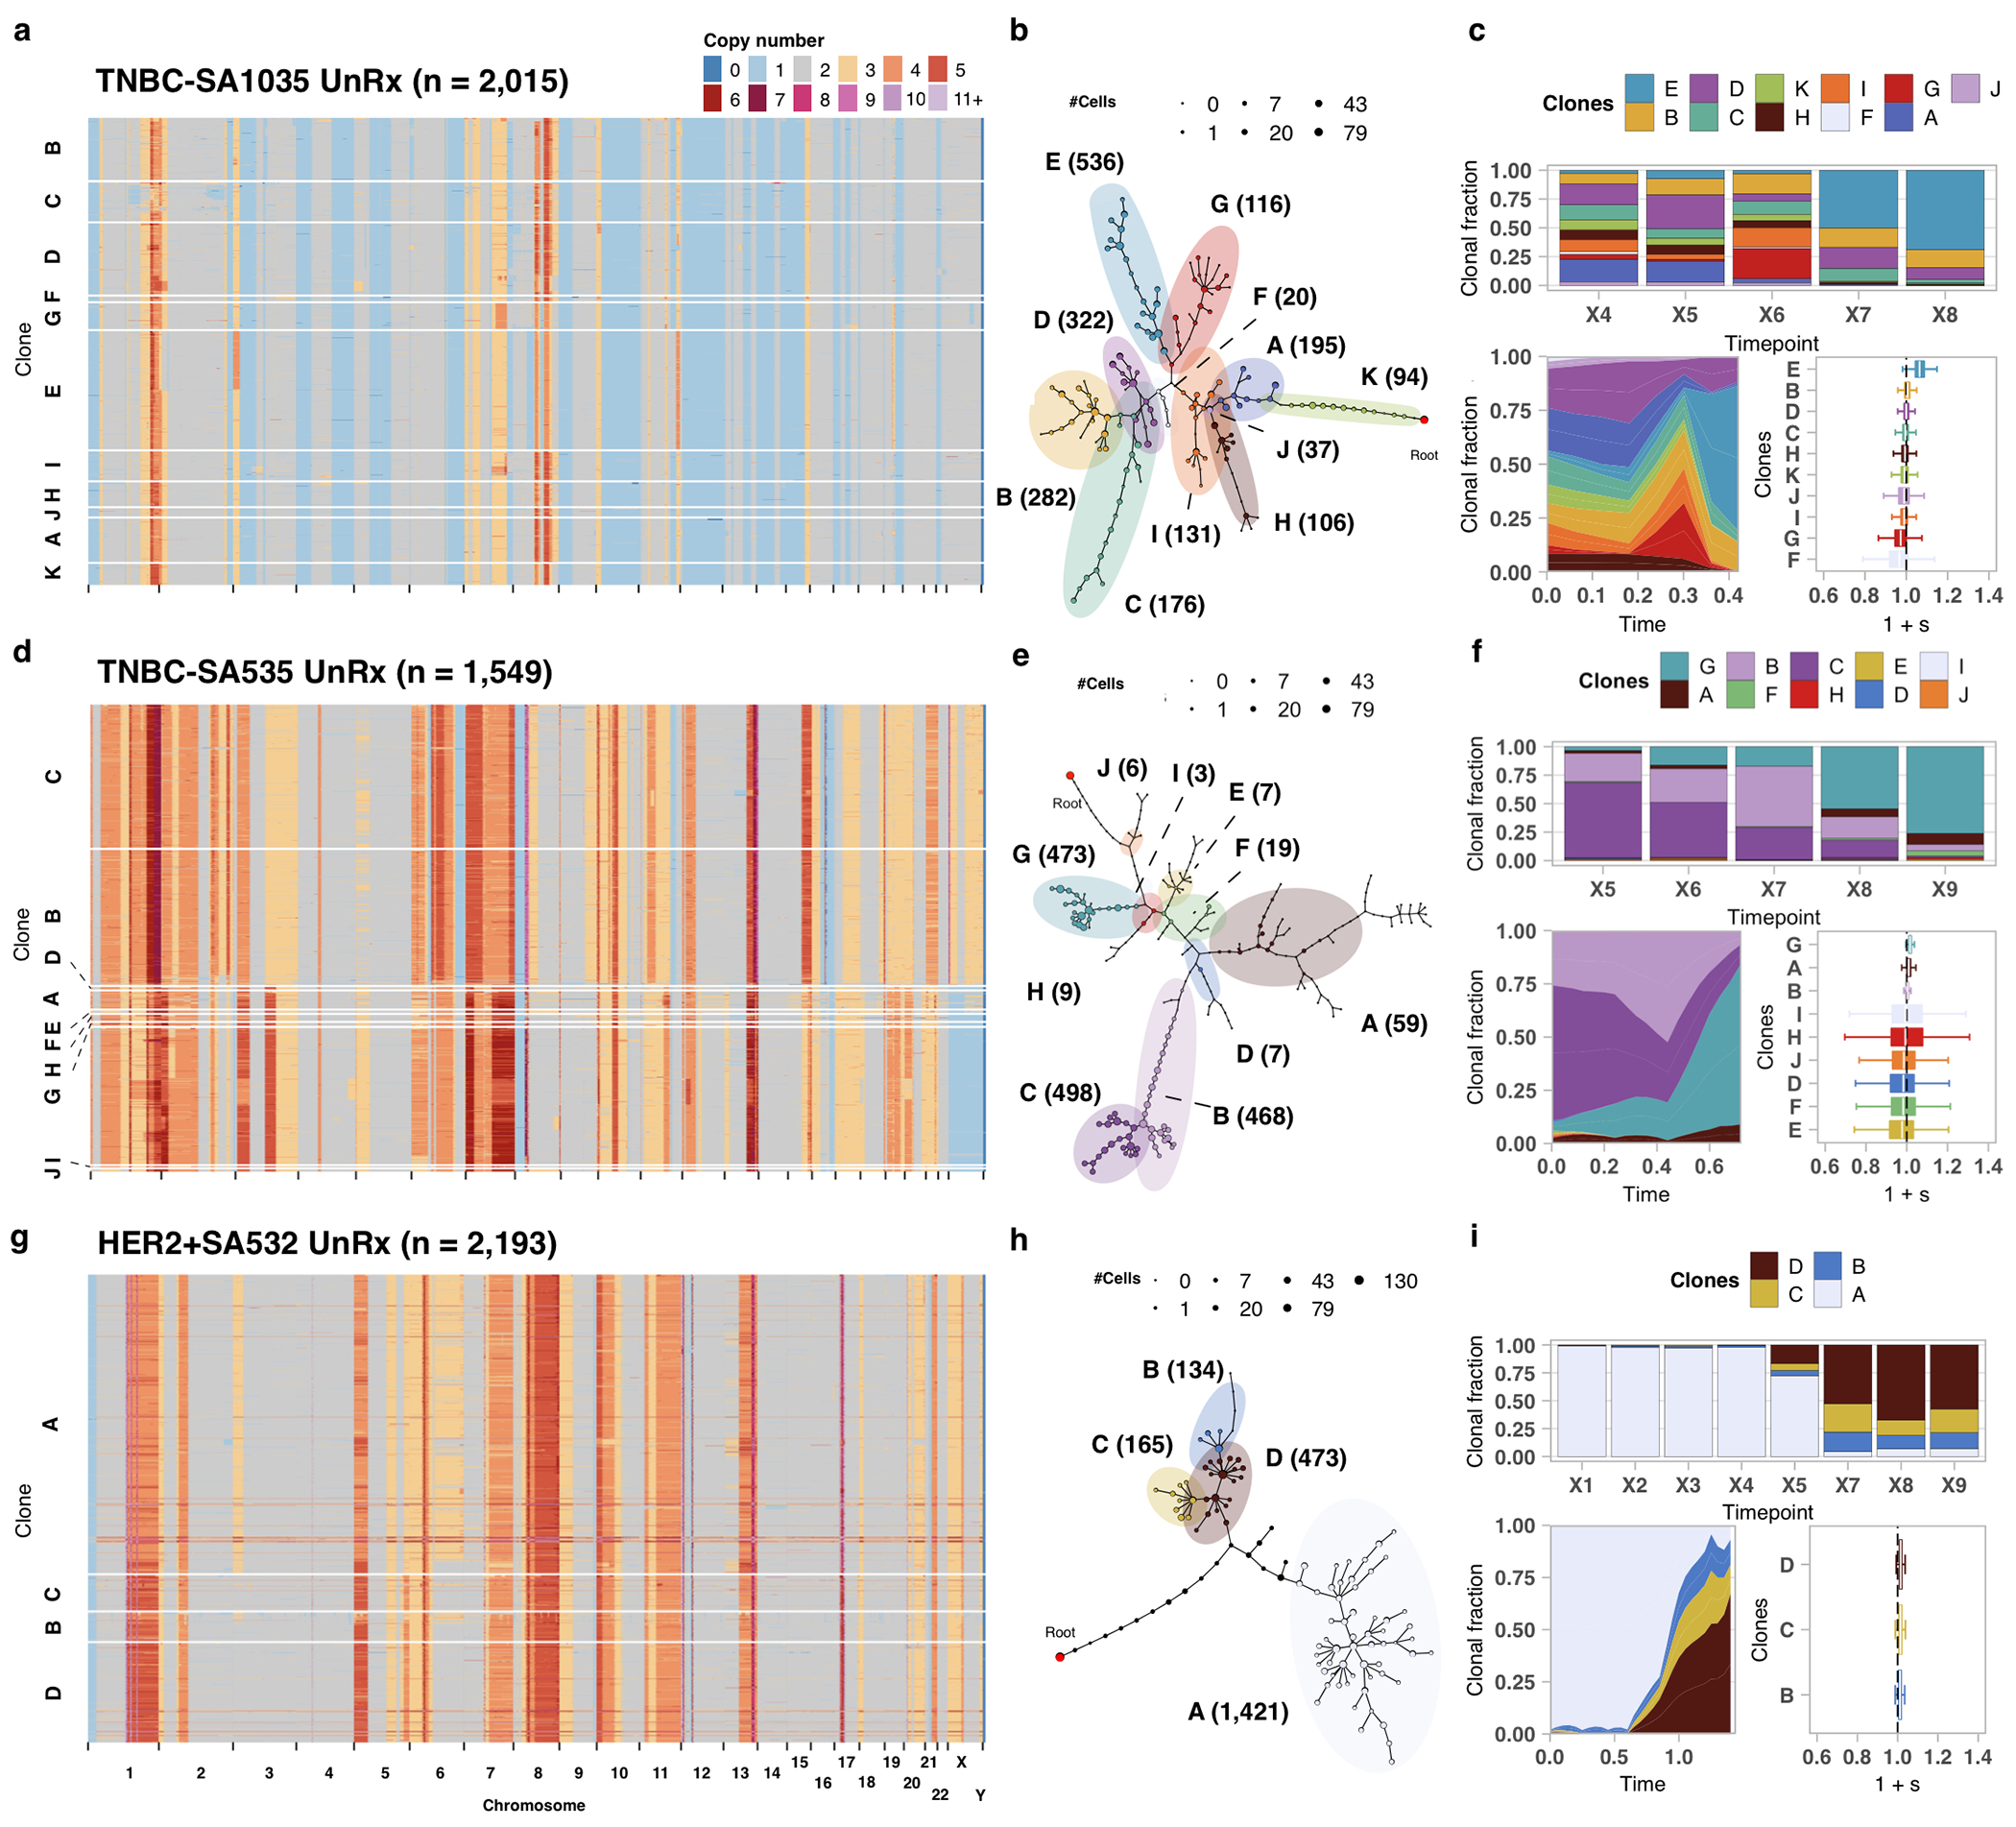
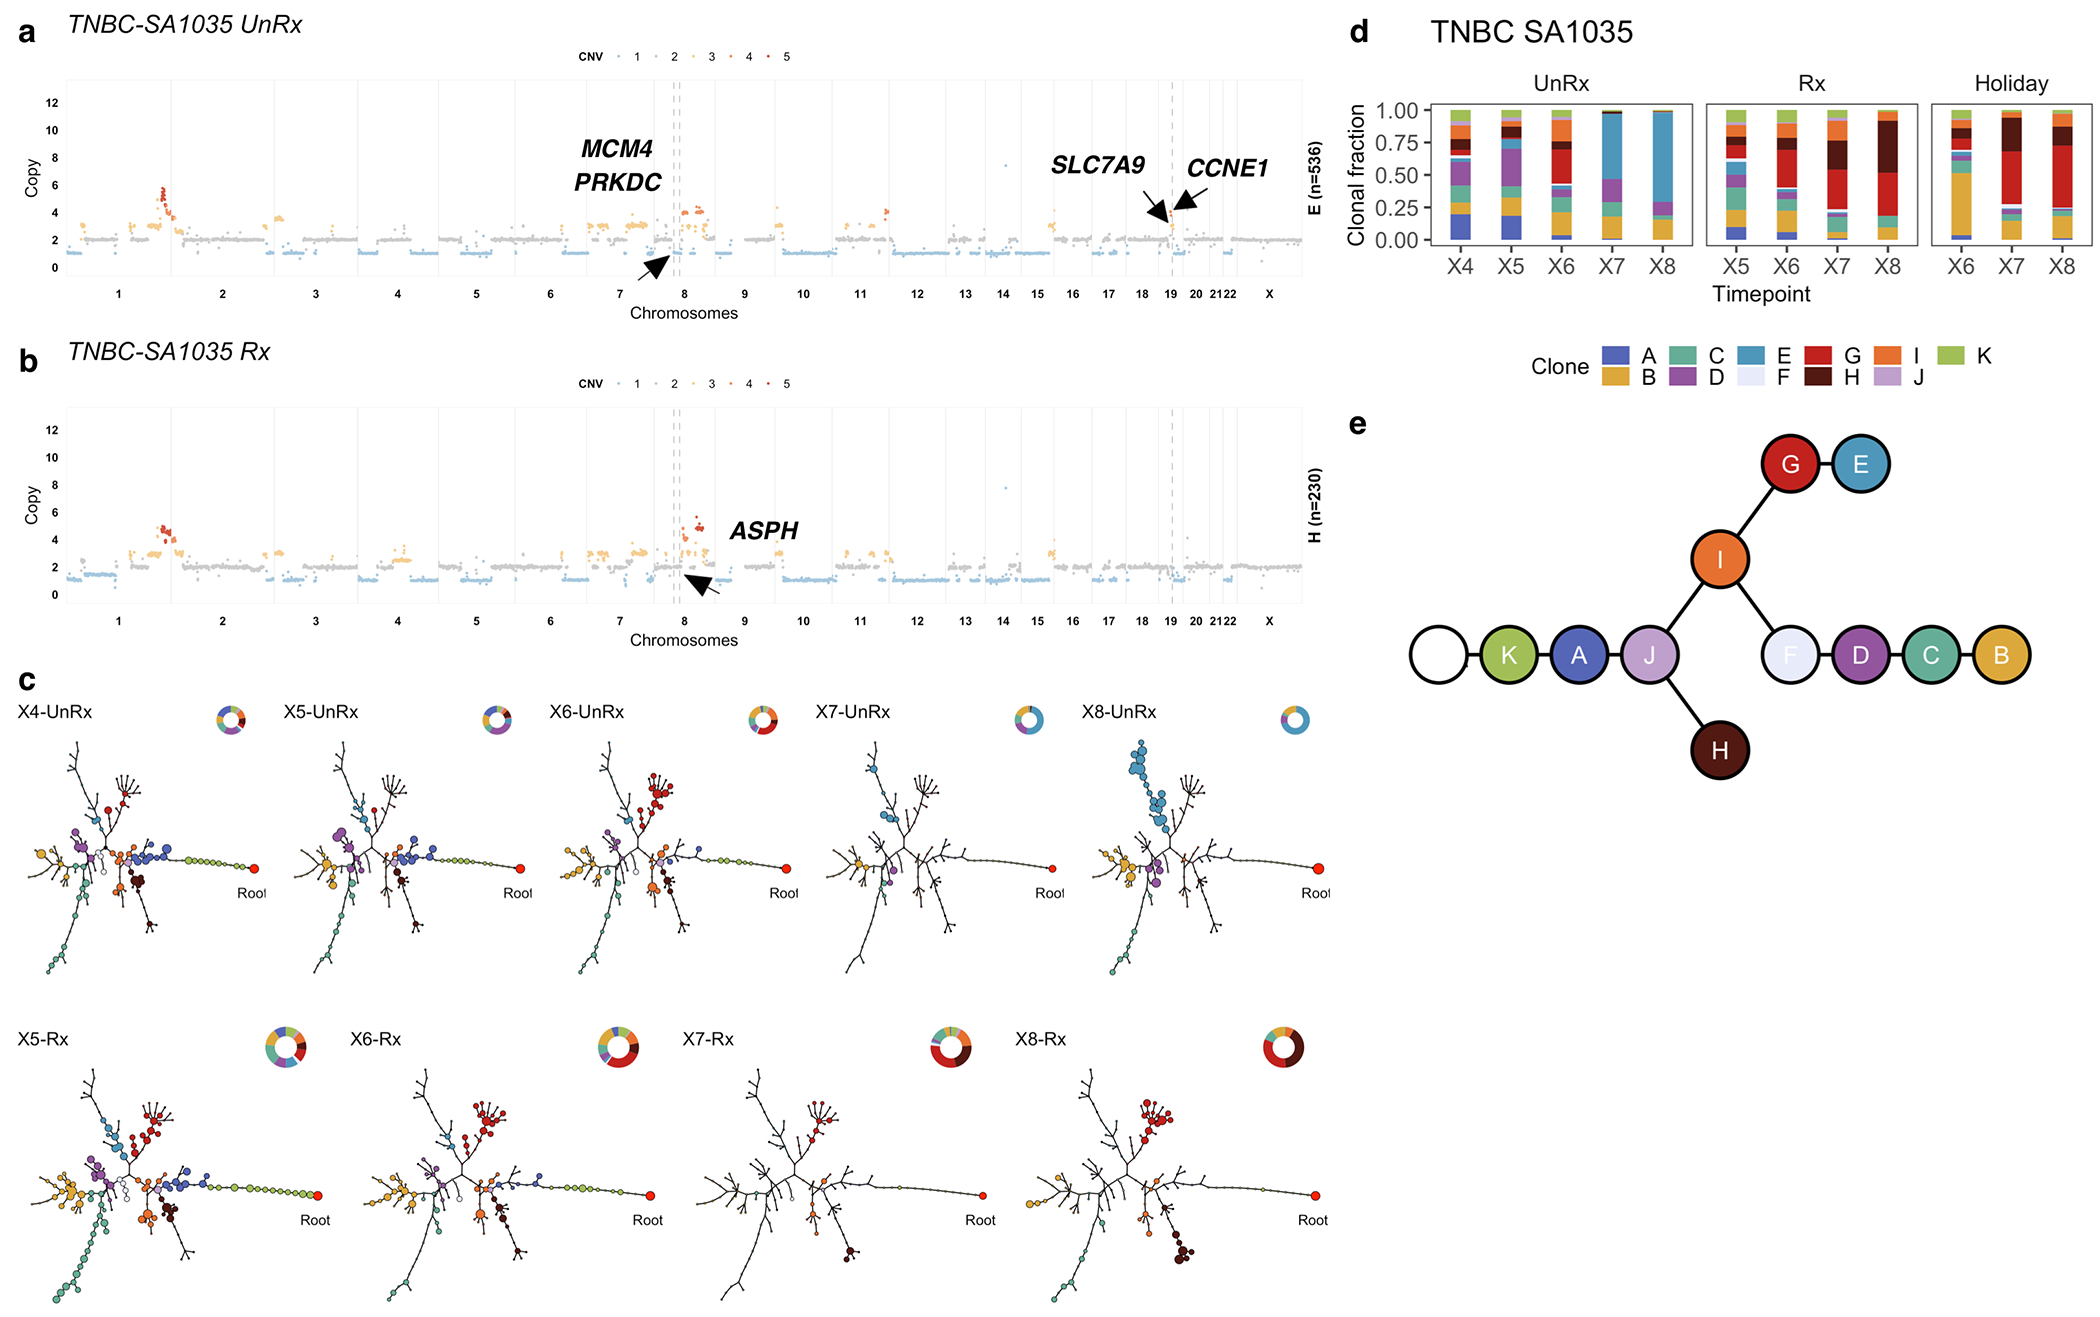
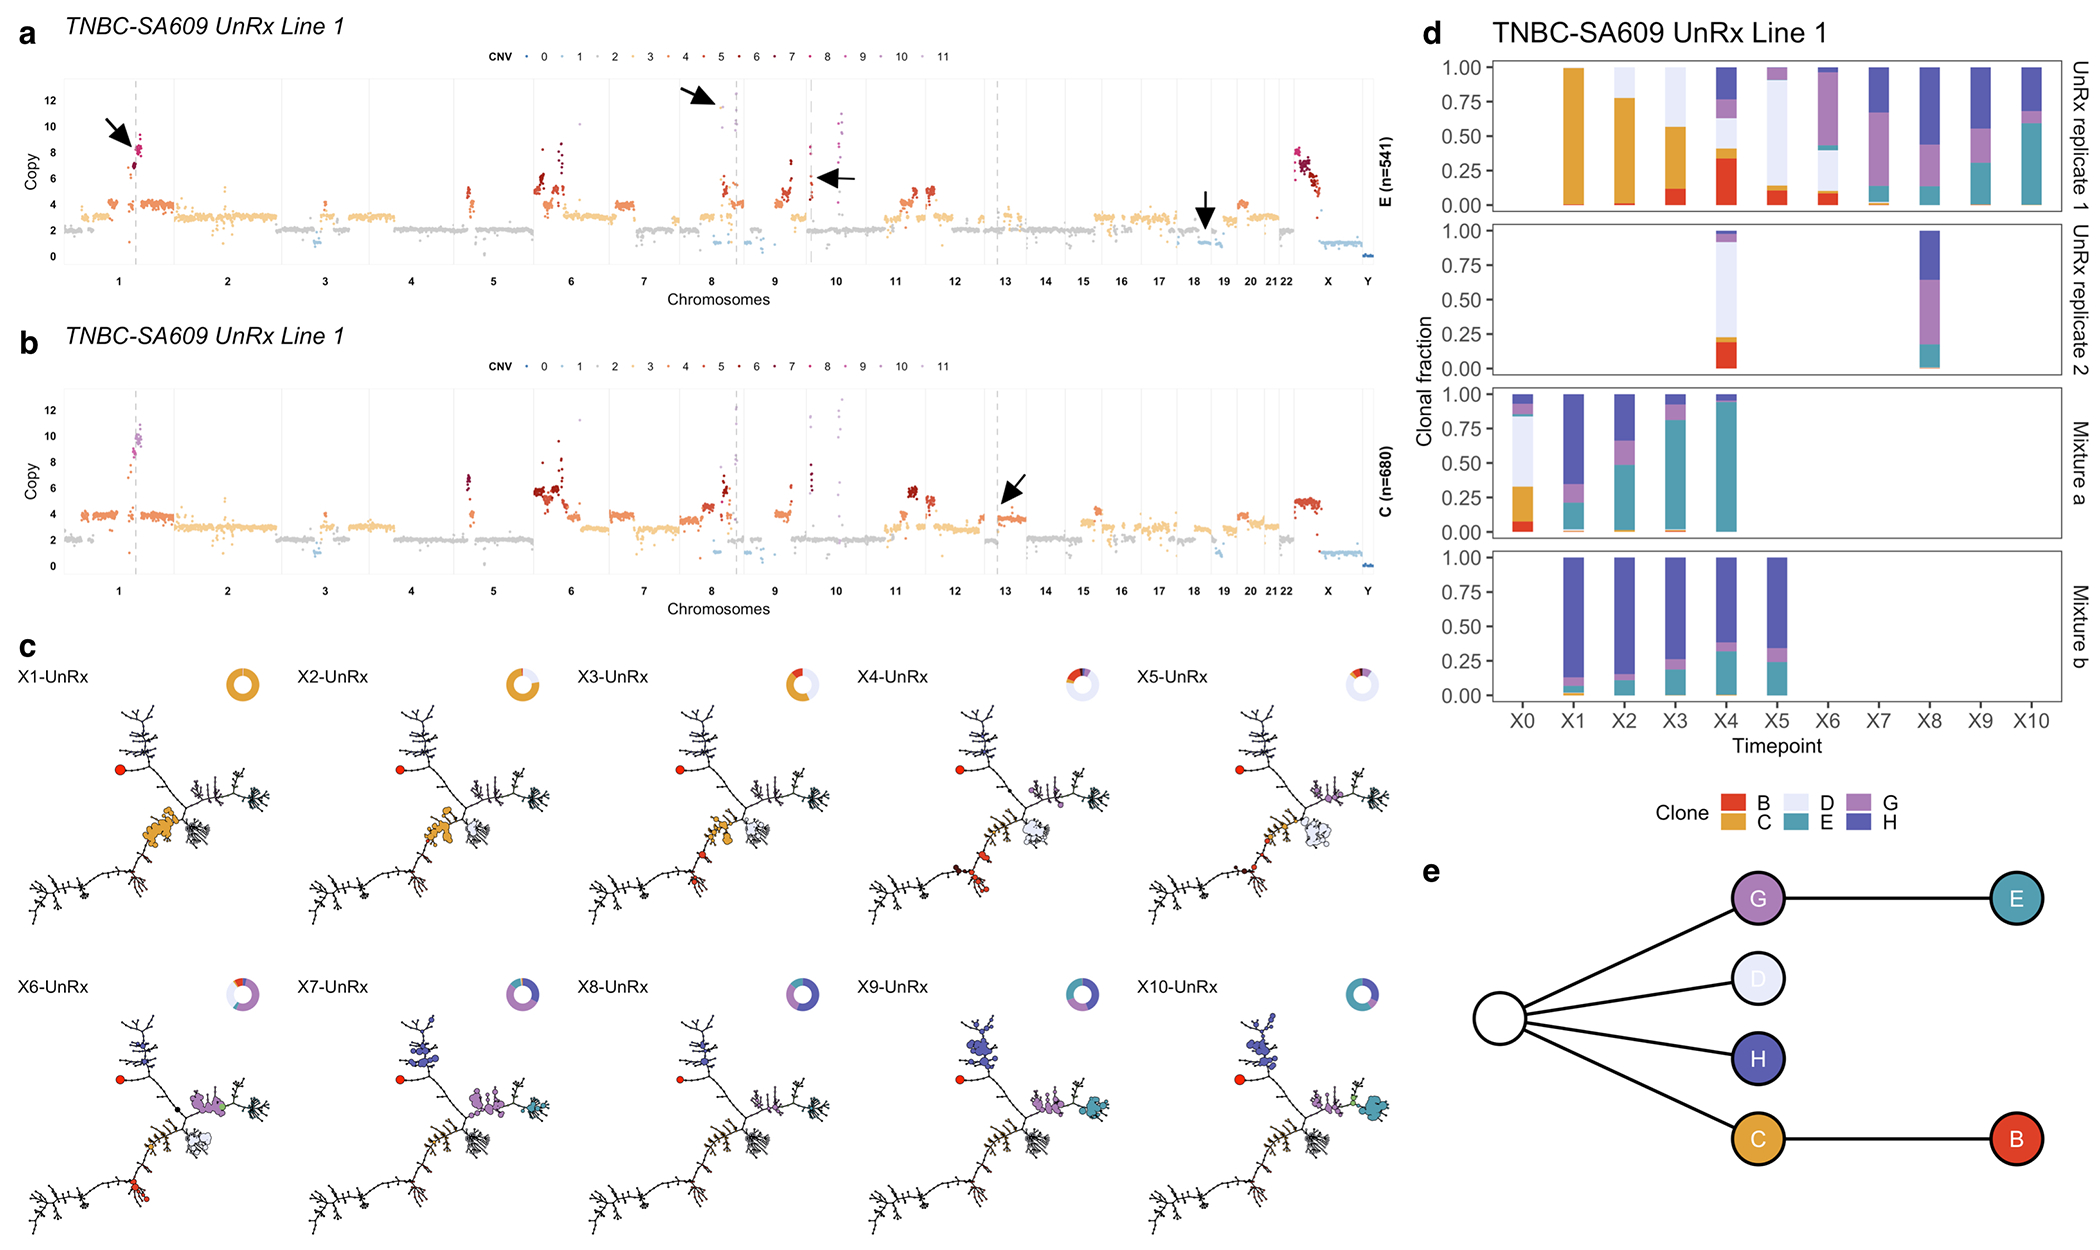
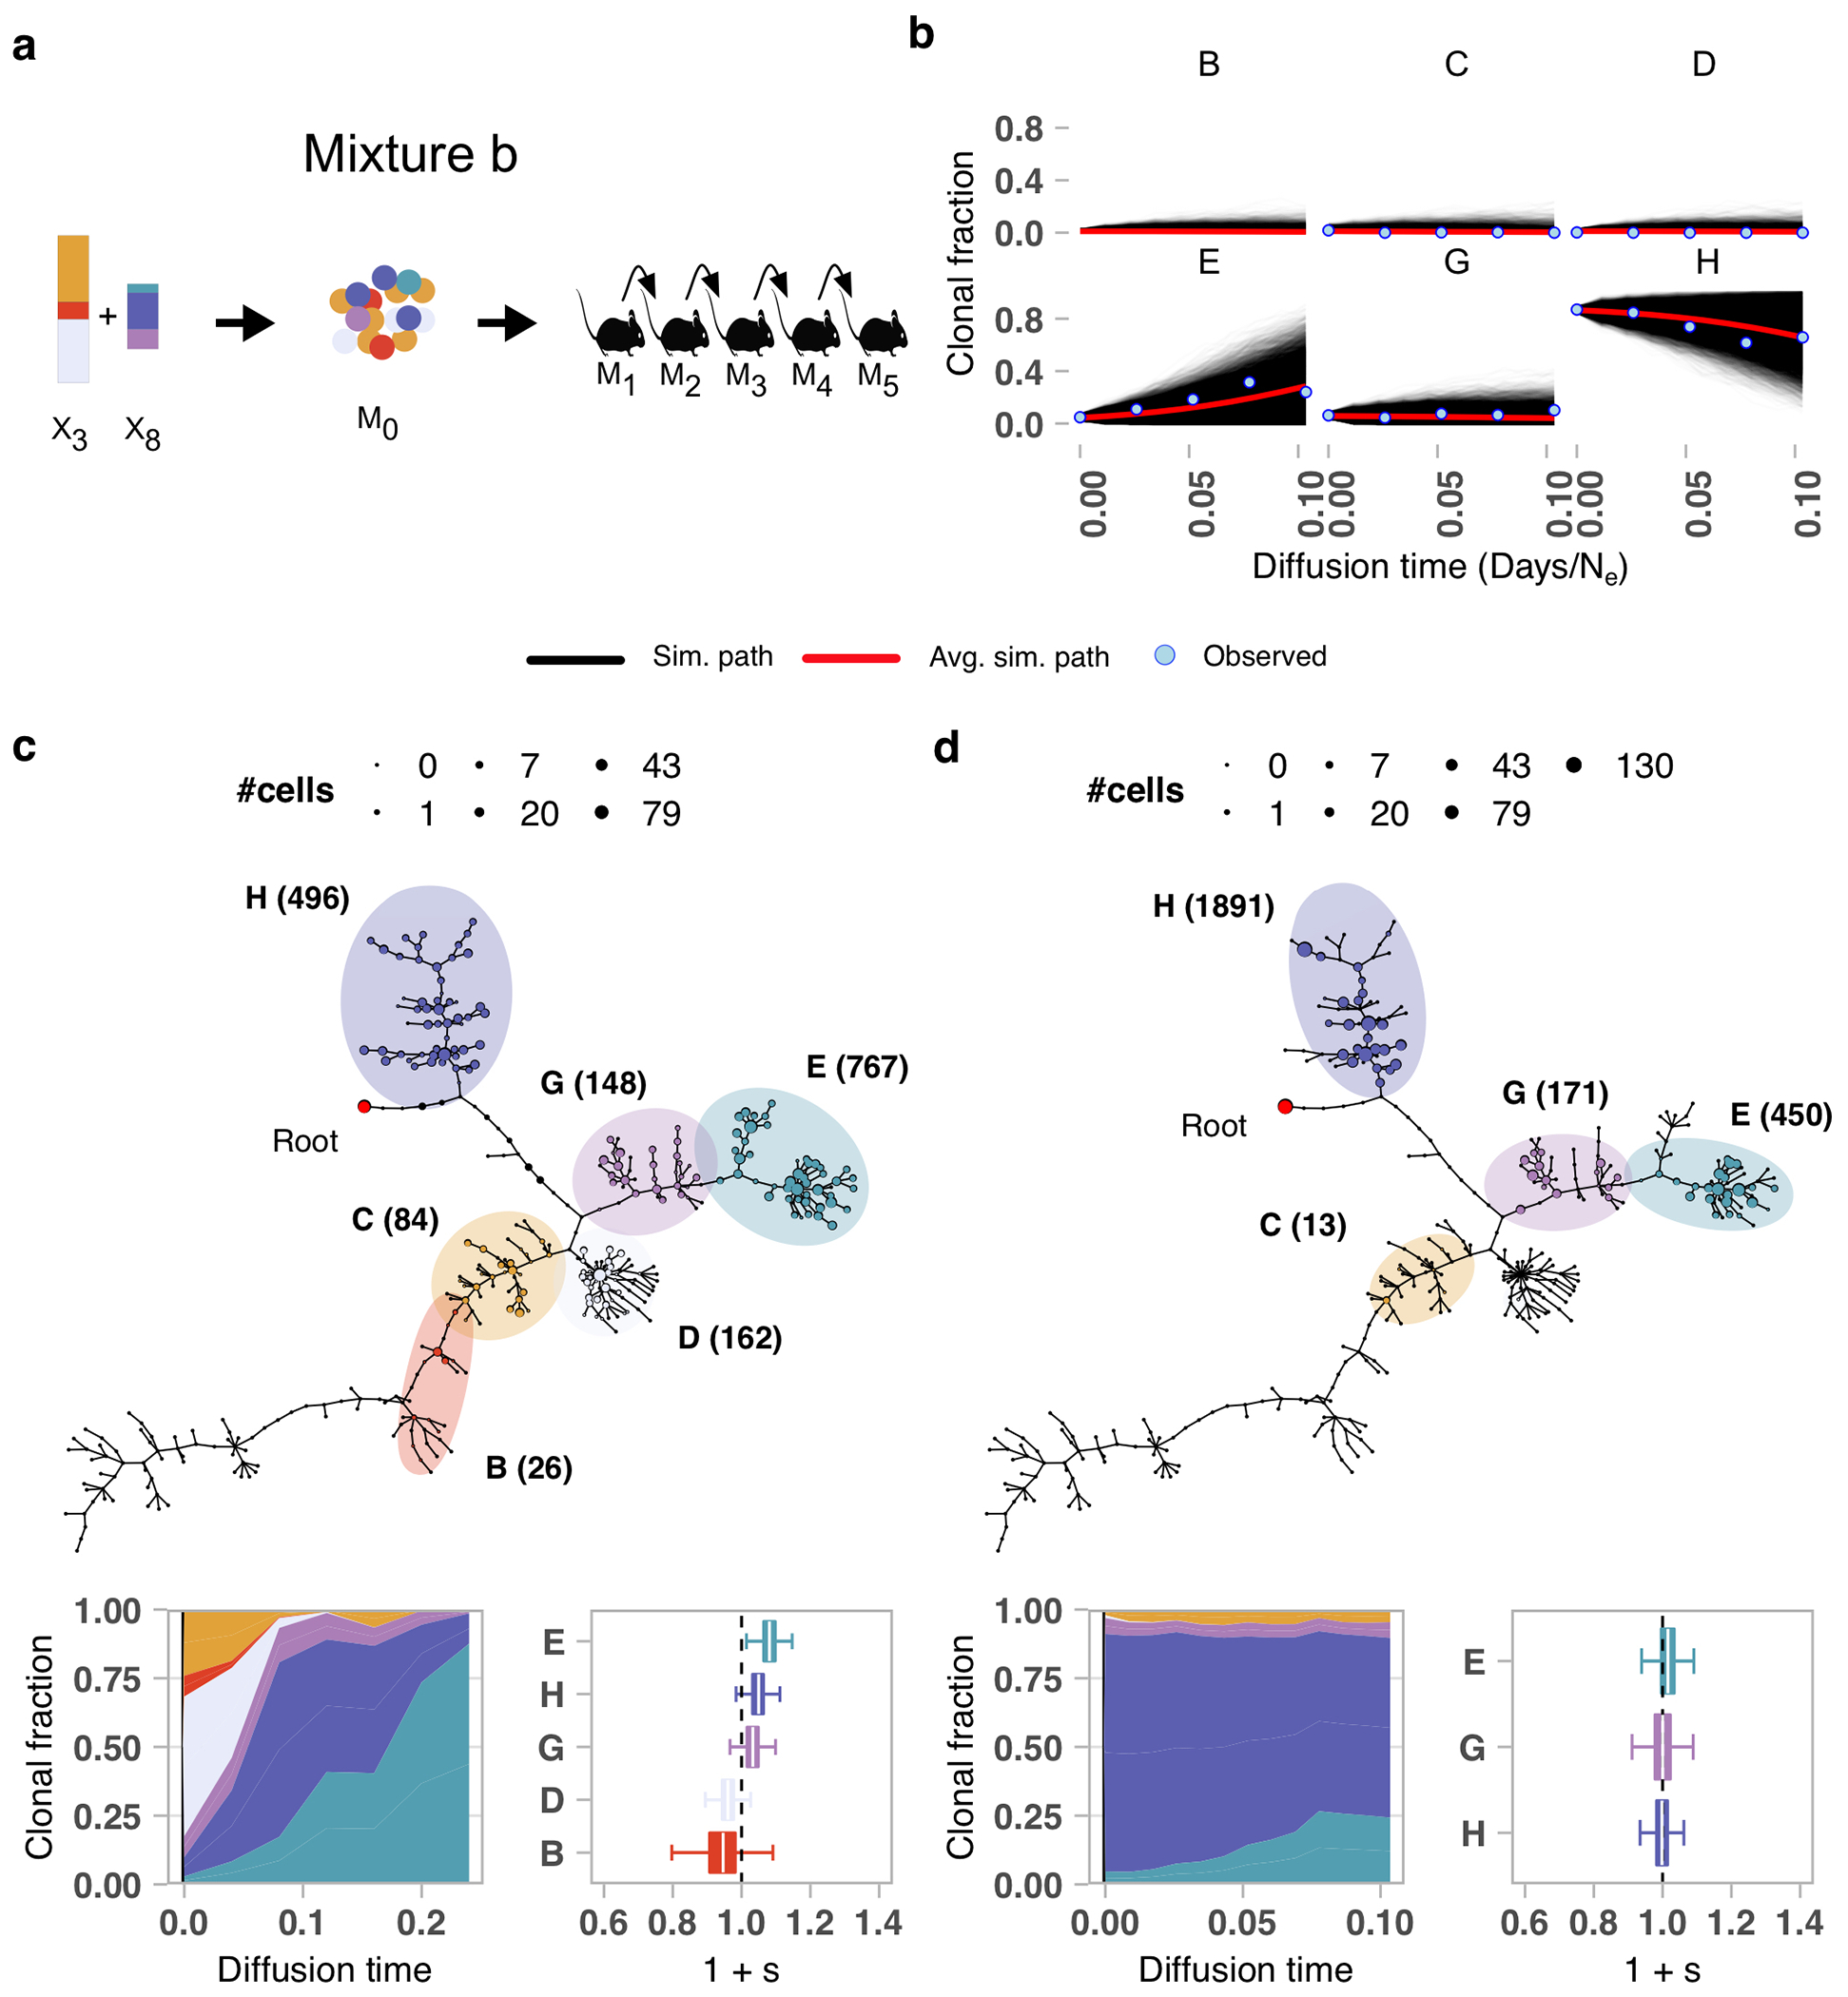
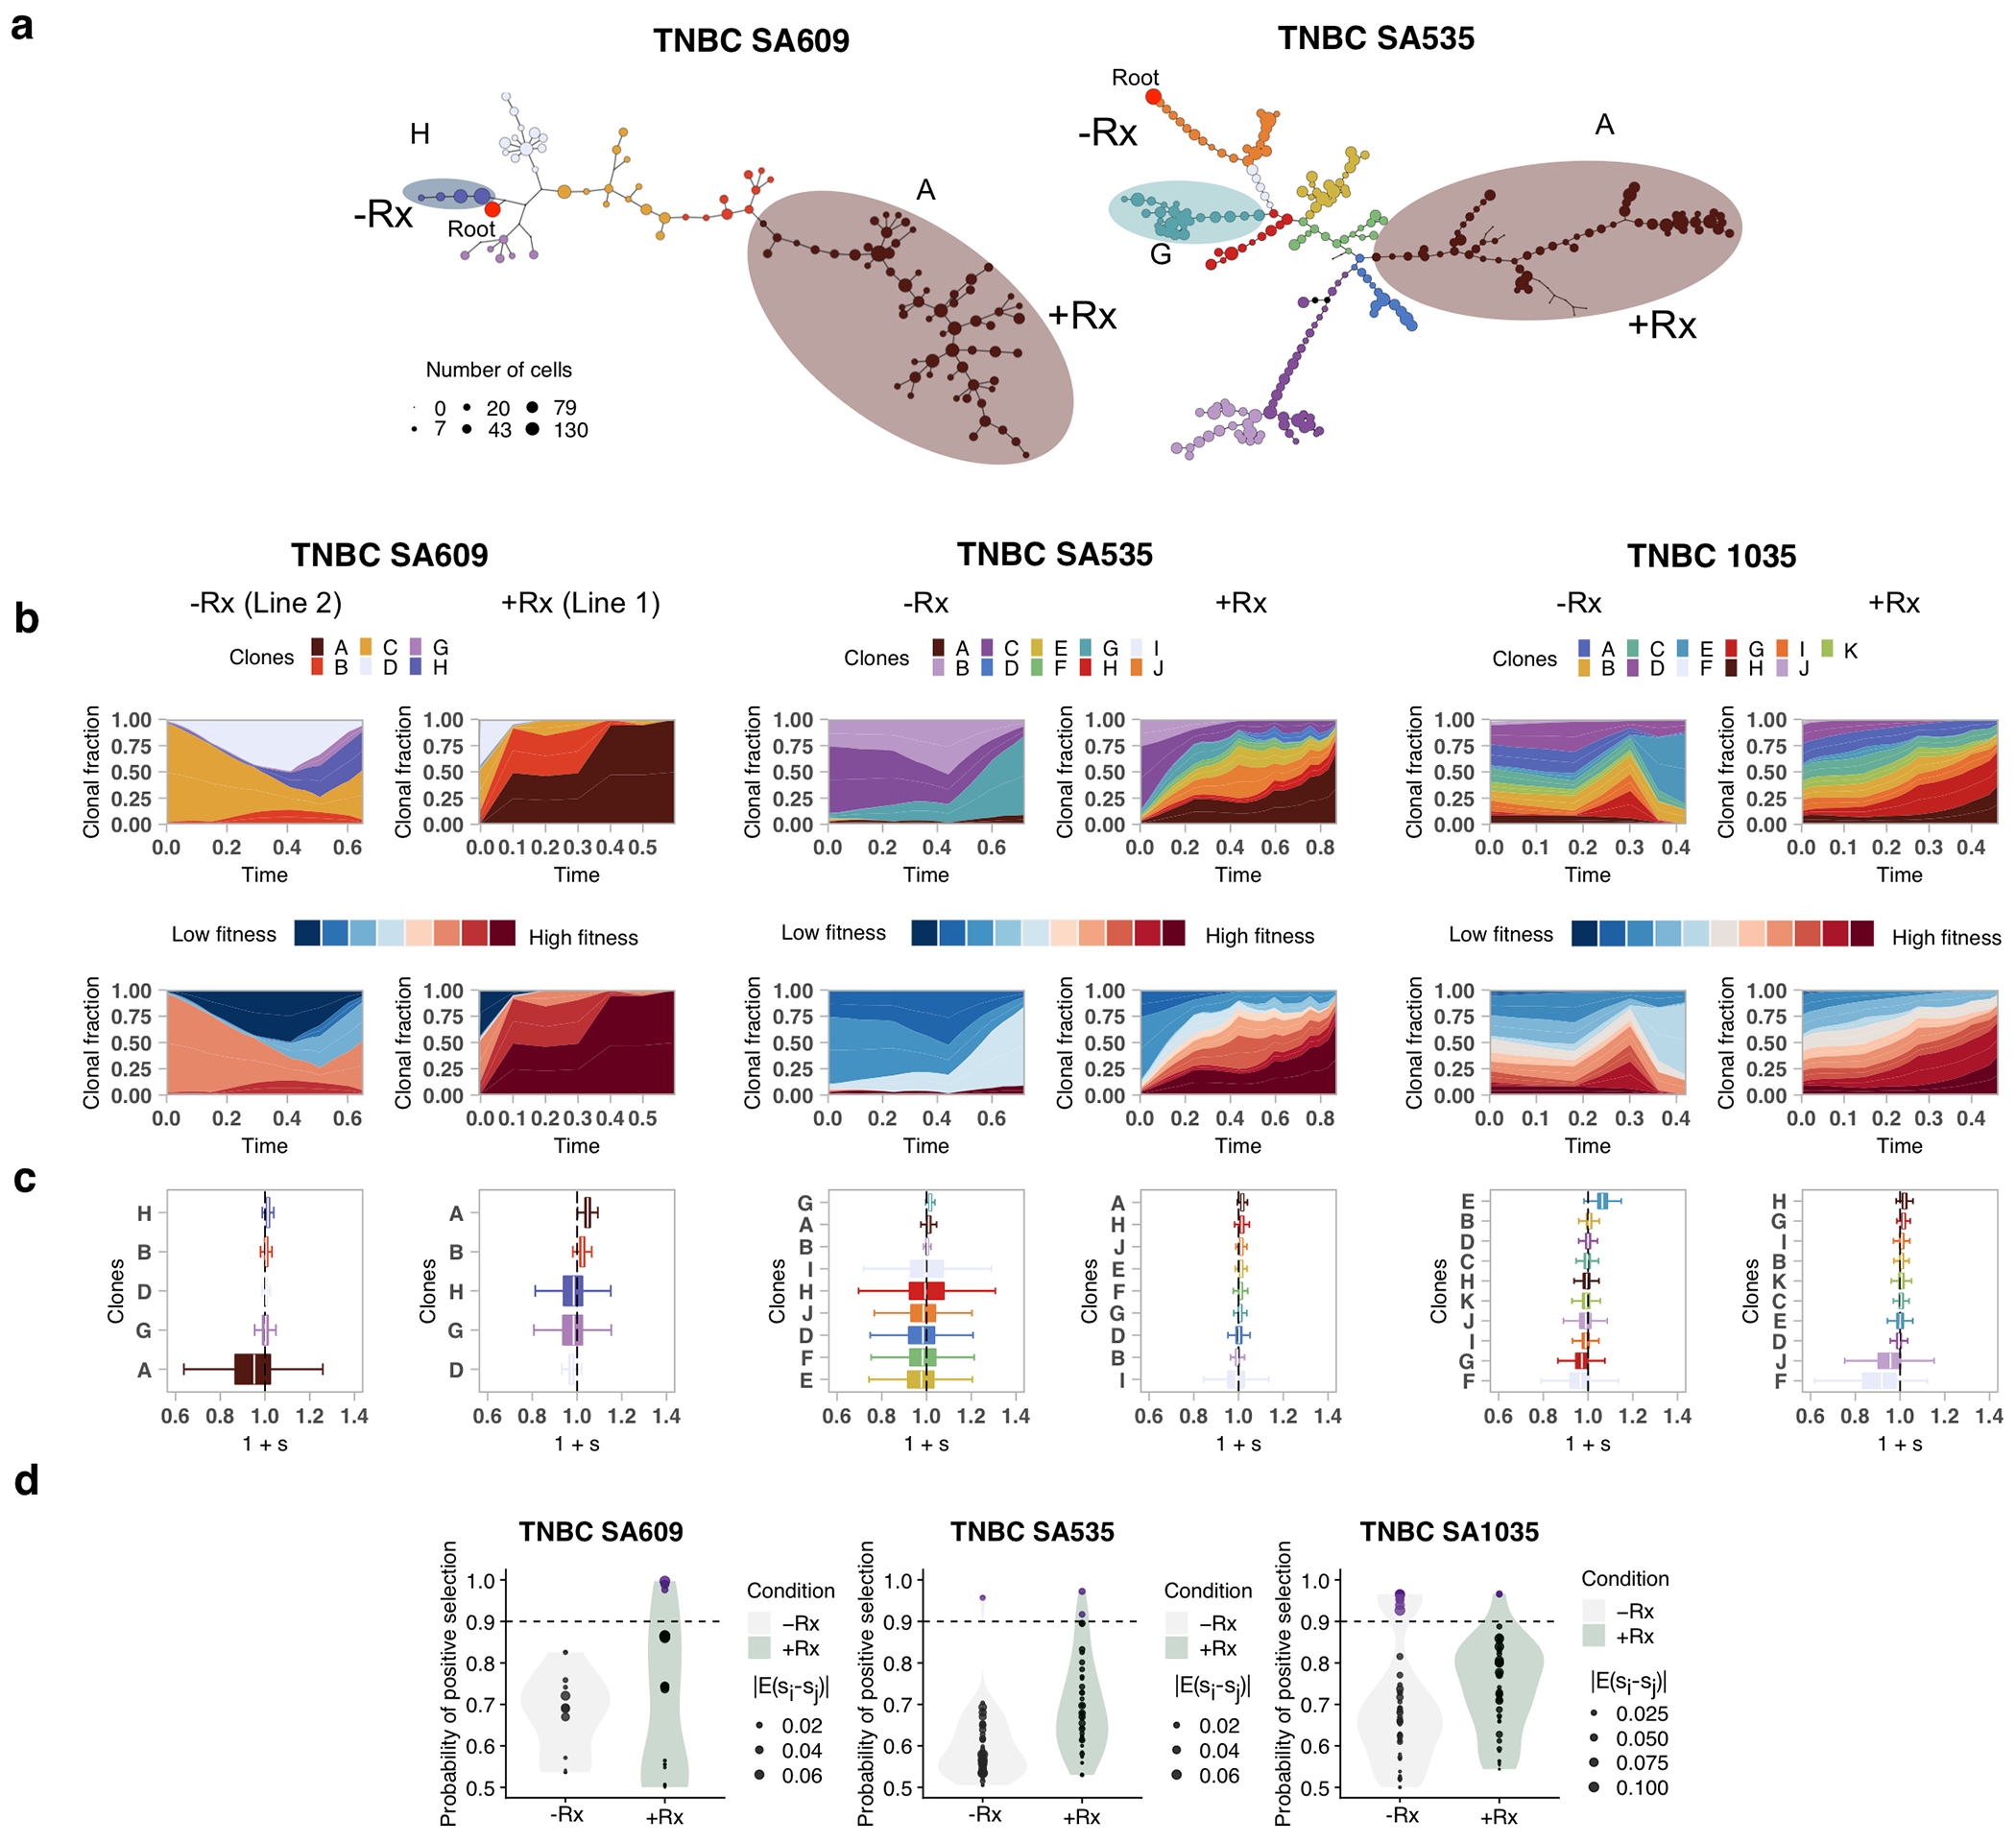
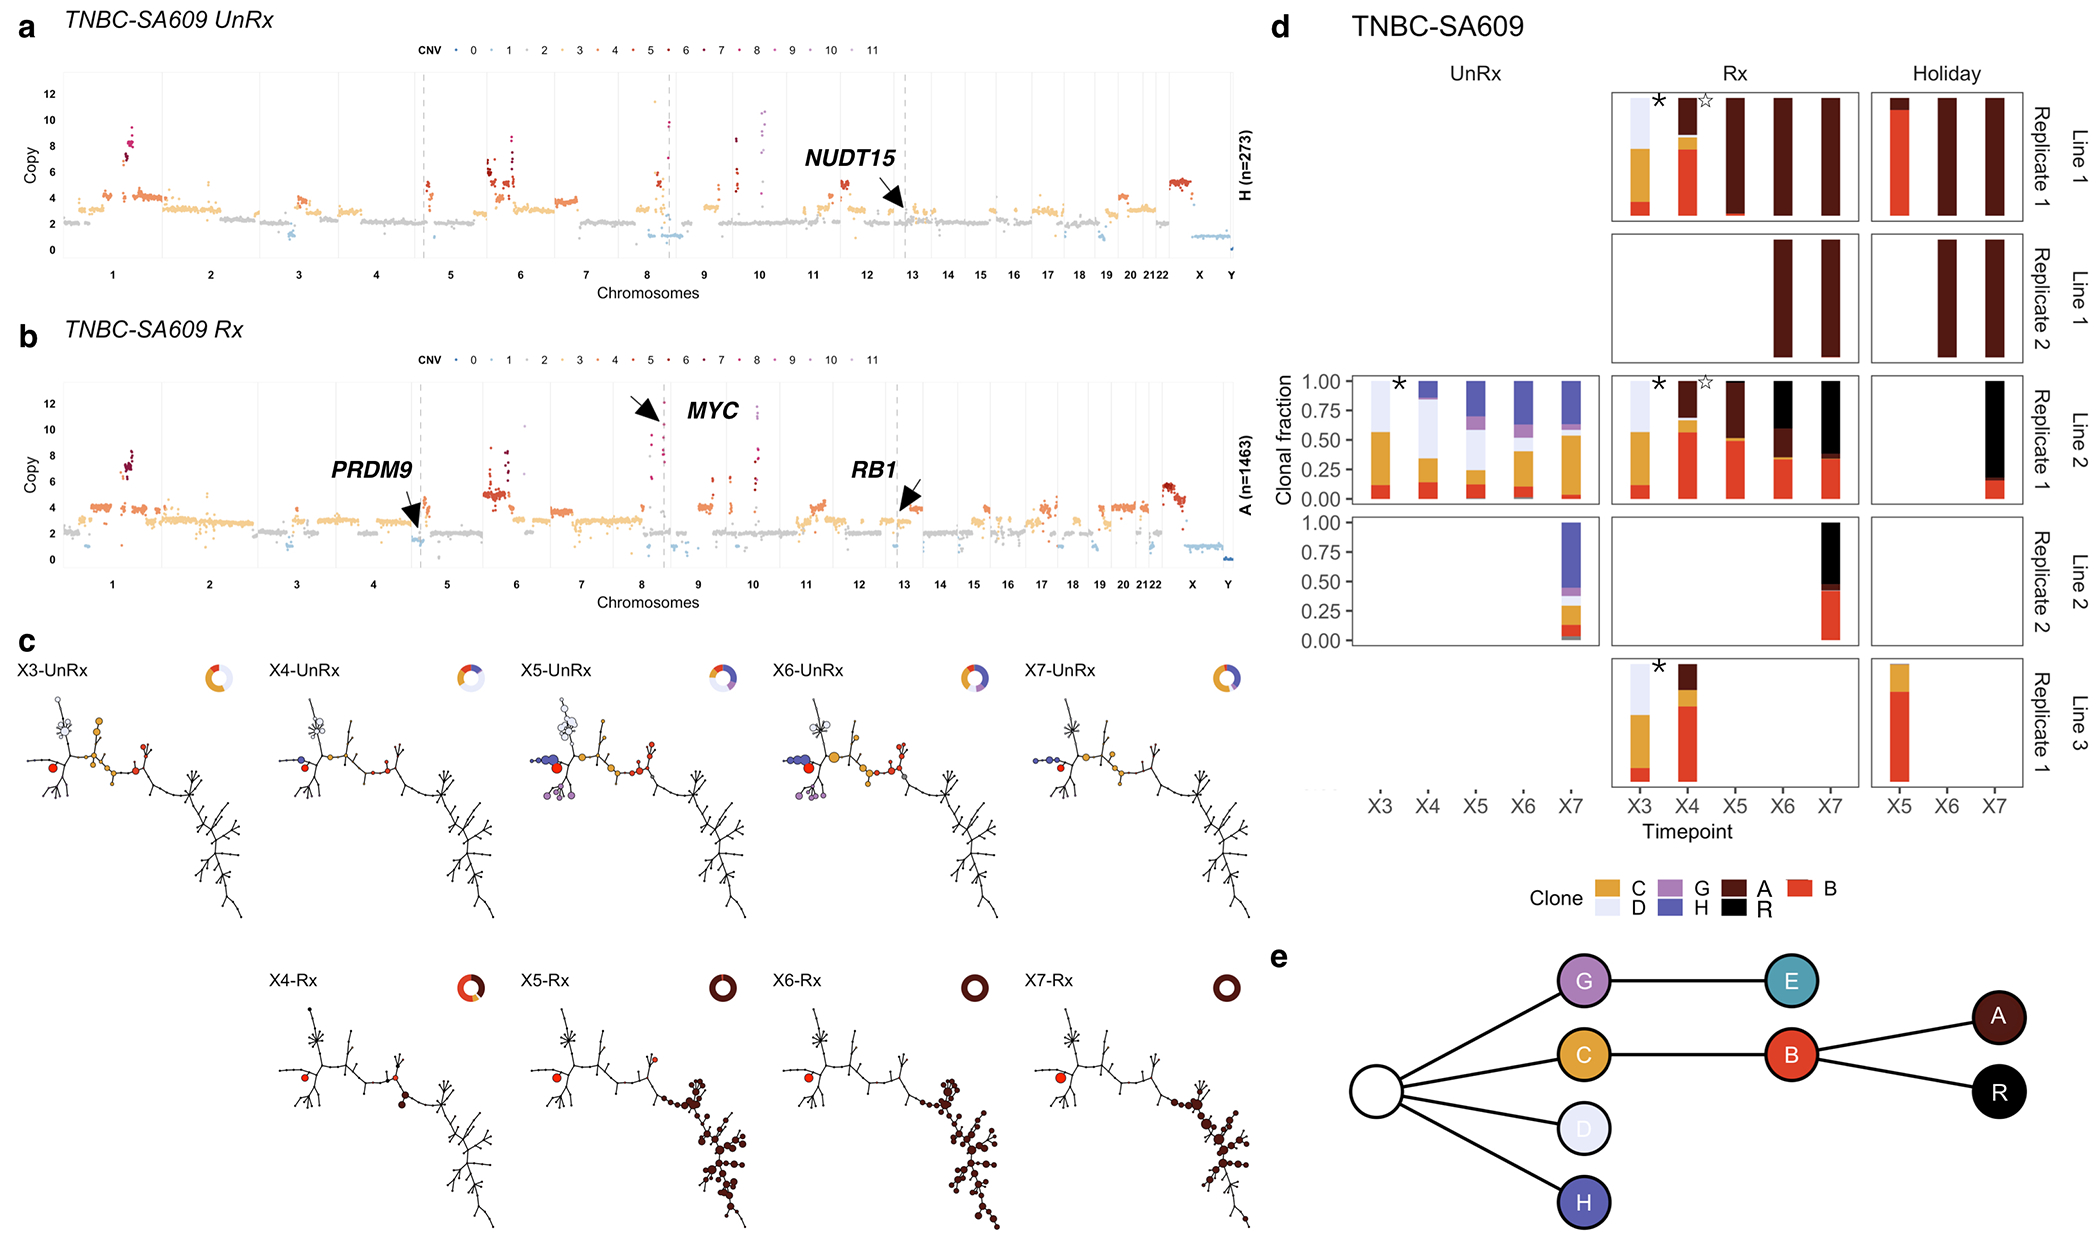
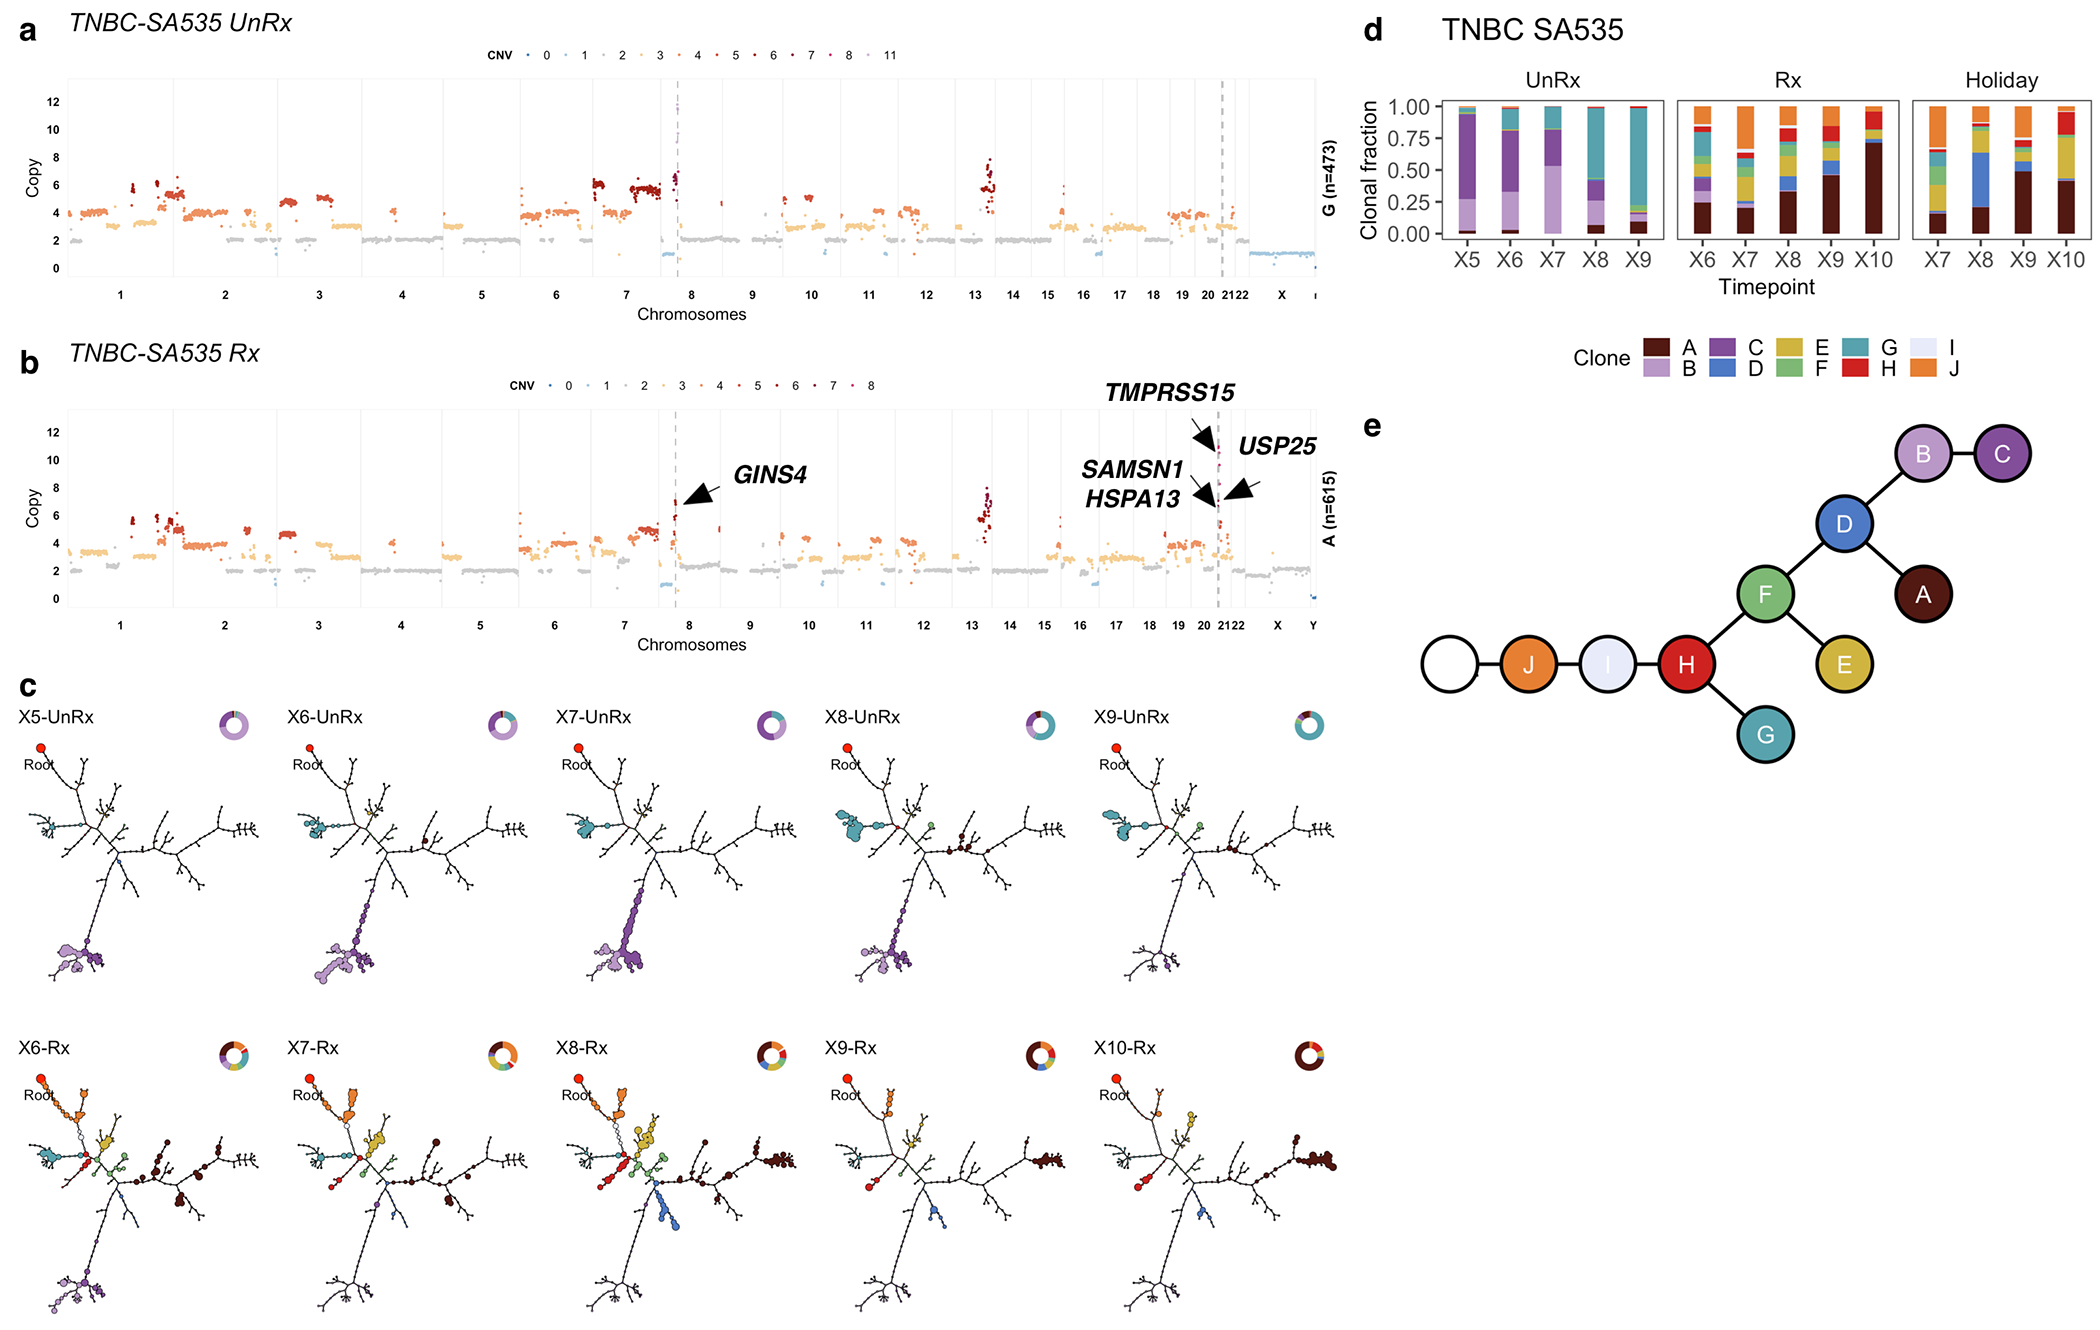
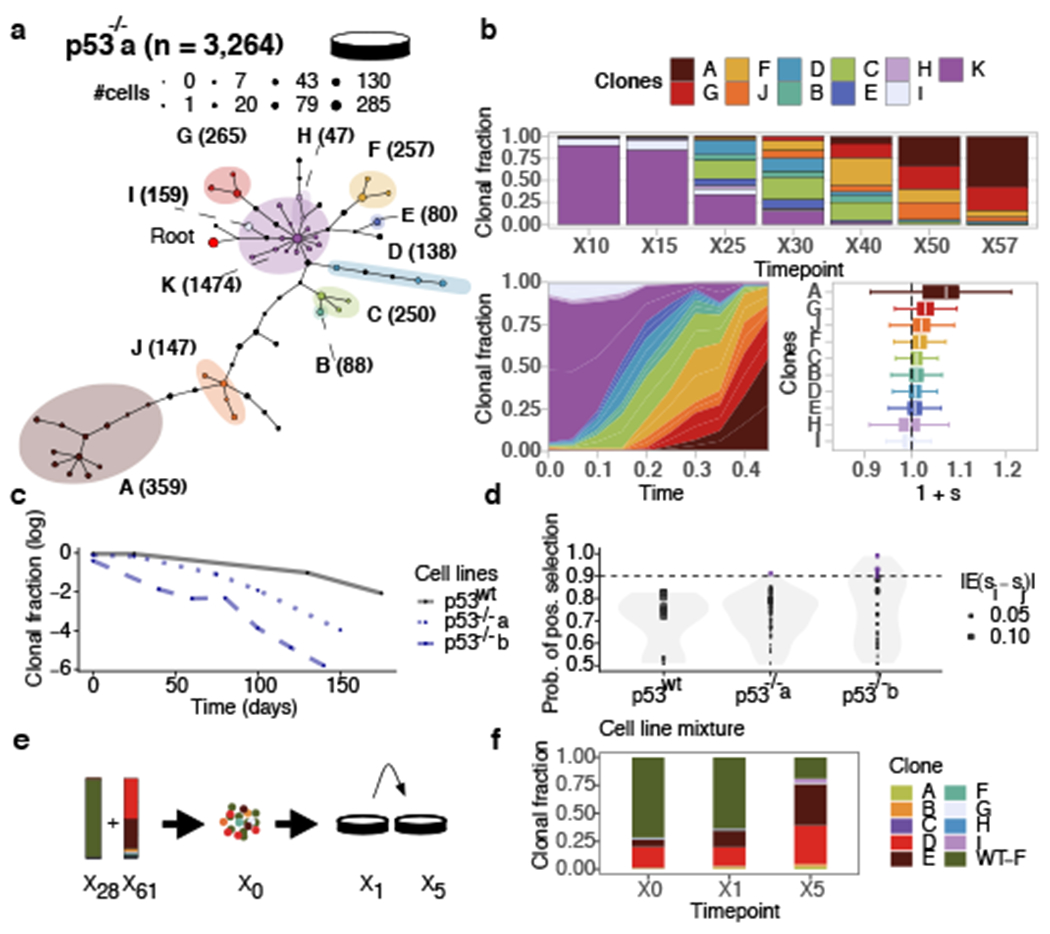
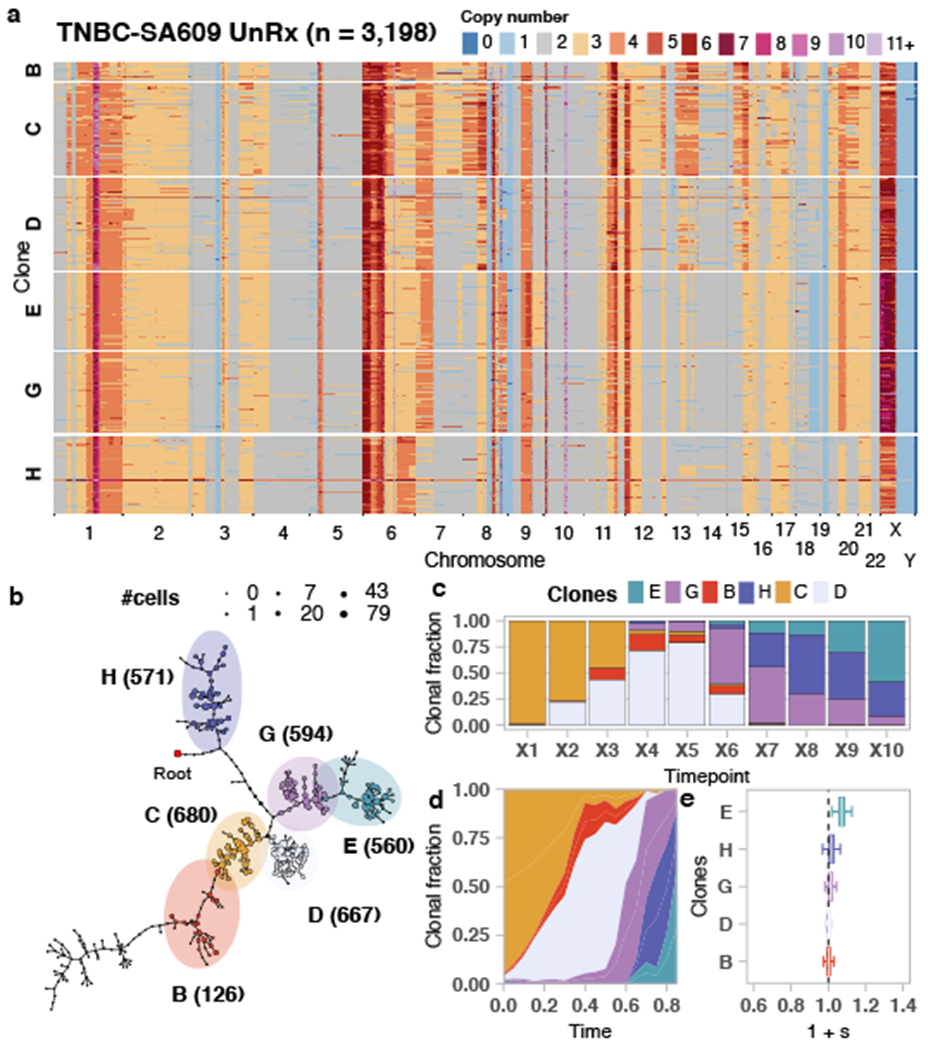
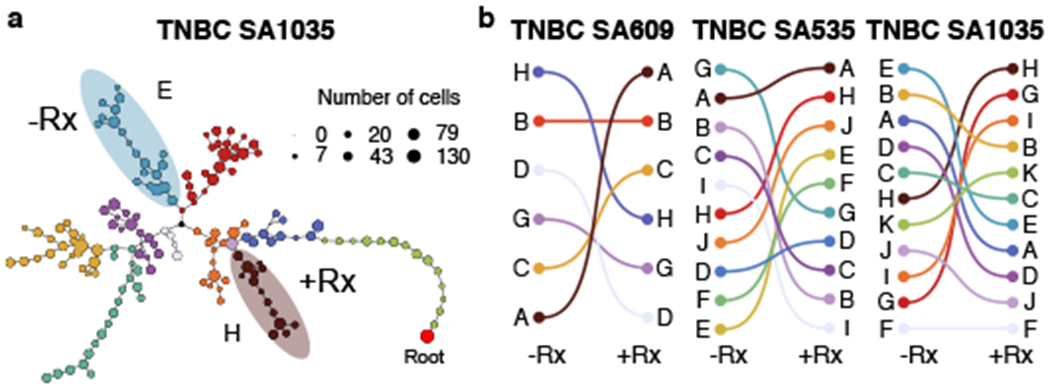
Progress in defining genomic fitness landscapes in cancer, especially those defined by copy number alterations (CNAs), has been impeded by lack of time-series single-cell sampling of polyclonal populations and temporal statistical models1-7. Here we generated 42,000 genomes from multi-year time-series single-cell whole-genome sequencing of breast epithelium and primary triple-negative breast cancer (TNBC) patient-derived xenografts (PDXs), revealing the nature of CNA-defined clonal fitness dynamics induced by TP53 mutation and cisplatin chemotherapy. Using a new Wright-Fisher population genetics model8,9 to infer clonal fitness, we found that TP53 mutation alters the fitness landscape, reproducibly distributing fitness over a larger number of clones associated with distinct CNAs. Furthermore, in TNBC PDX models with mutated TP53, inferred fitness coefficients from CNA-based genotypes accurately forecast experimentally enforced clonal competition dynamics. Drug treatment in three long-term serially passaged TNBC PDXs resulted in cisplatin-resistant clones emerging from low-fitness phylogenetic lineages in the untreated setting. Conversely, high-fitness clones from treatment-naive controls were eradicated, signalling an inversion of the fitness landscape. Finally, upon release of drug, selection pressure dynamics were reversed, indicating a fitness cost of treatment resistance. Together, our findings define clonal fitness linked to both CNA and therapeutic resistance in polyclonal tumours.


Conflict of interest statement

Competing Interests

SPS and SA are shareholders and consultants of Canexia Health Inc.

Figures

Extended Data Fig. 1
Schematic overview of experimental design for quantitatively modeling clone-specific fitness. Timeseries sampling from in vitro a) and PDX b) systems. Grey circles represent un-treated, blue represents Cisplatin treated and grey with a blue outline denotes drug-holiday samples. c) Clonal dynamics of cell populations observed over time. Whole genome single cell sequencing of timeseries samples gives copy number (left) that in turn is used to infer a phylogenetic tree (middle), and clonal fractions over time (right). d) fitClone: mathematical modeling of fitness with diffusion approximation to the K-type Wright-Fisher model. e) fitClone inputs of clonal dynamics measured over time series (left), and inferred trajectories (middle) and posterior distributions of fitness coefficients (right). Boxplots are as defined in Fig. 1b.
Extended Data Fig. 2
Impact of p53 mutation on fitness in 184hTERT cells. a) Heatmap representation of copy number profiles of 2,713 p53wt cells, grouped in 6 phylogenetic clades. b) Phylogeny of cells over the timeseries p53wt where nodes are groups of cells (scaled in size by number) with shared copy number genotype and edges represent distinct genomic breakpoints. Shaded areas represent clones. Tree root is denoted by the red circle. c) Observed clonal fractions over time, inferred trajectories and quantiles of the posterior distributions over selection coefficients of fitClone model fits to p53wt with respect to the reference Clone F. d) Analogous to a but for p53−/−a (n=3,264 cells p53−/−a cells). e) Clonal genotypes of three representative clones for p53−/−b showing high level amplification of TSHZ2 in Clone D, Chr4 loss in Clone E. Reference diploid Clone I is shown for comparison. f, g) Analogous to b, c but for p53−/−b (n=4,881 p53−/−b cells; reference Clone I). h) Number of segments per clone in hTERT WT and p53−/−a and p53−/−b branches. i) Number of mutations in p53−/−a and p53−/−b branches. Boxplots are as defined in Fig. 1b.
Extended Data Fig. 3
PDXs tumour growth and clonal dynamics with cisplatin. a) Experimental design of cisplatin treatment in PDX. The solid blue colour representing cisplatin treated tumours (UT,UTT,UTTT,UTTTT); blue outlined in grey as drug holiday (UTU,UTTU,UTTTU); grey as untreated series. b-d) Tumour response curves in TNBC-SA609, TNBC-SA535 and TNBC-SA1035 treated with Cisplatin (blue), in drug Holiday (green) and untreated (red) where each tumour replicate is shown in a different shade. The vertical axis on the right denotes the status of tumours and on the left denotes the tumour volumes. The top horizontal axis represents number of cisplatin cycles and at the bottom days from palpable tumours to collection. The red arrows indicate the start of treatment and the black arrows indicate the tumour sampled for scDNAseq. The bottom horizontal axis shows the tumour passage number. Each line in the big box is an individual tumour showing the growth over time. e) (top) Clonal trajectories of the clone with the highest inferred selection coefficient in the treatment regime (solid black line) and the drug holiday counterpart (dashed red line) at each timepoint, in the three TNBC PDX timeseries; (bottom) As the top row, but for a clone that grows back in the holiday regime.
Extended Data Fig. 4
Comparison of fitness landscapes of breast cancer PDX models. a) Heatmap representation of copy number profiles of 2,015 cells from TNBC-SA1035, grouped in 11 phylogenetic clades. b) Phylogeny for TNBC-SA1035. c) Observed clonal fractions, inferred fitClone trajectories and quantiles of the selection coefficients with respect to the reference Clone A for the TNBC-SA1035 UnRx model. d-f) Analogous to a-c but for TNBC+SA535 (n=1,549 cells; reference Clone C). g-i) Analogous to a-c but for HER2+SA532 (n=2,193 cells; reference Clone A). Boxplots are as defined in Fig. 1b.
Extended Data Fig. 5
Impact of pharmacologic perturbation with cisplatin on fitness landscapes in TNBC-SA1035. a) Copy number genotype of Clone E from the untreated timeseries. b) Copy number genotype of clone H from treated timeseries (arrows indicate differences to Clone E). c) Evolution in absence of treatment and as a function of drug treatment. For each sample, the phylogeny with clonal abundance from DLP+ is shown, reflecting selection. d) The observed clonal abundances and e) the summarised clonal phylogenetic tree.
Extended Data Fig. 6
Tumour evolution in absence of pharmacologic perturbation in TNBC-SA609 line 1. a) Copy number genotype of Clone E and b) copy number genotype of Clone C, the reference clone (arrows indicate differences to Clone E). c) Evolution in absence of treatment. For each sample, the phylogeny with clonal abundance from DLP+ is shown, reflecting selection. d) The observed clonal abundances and e) the summarised clonal phylogenetic tree.
Extended Data Fig. 7
Mixture experiment in TNBC-SA609 PDX Line 1. a) Clonal proportions of TNBC-SA609 Line 1 X3 and X8 used to generate the initial mixture M0 and subsequent serial passaging, yielding 5 samples for mixture experiment b. b) Forward simulations from the original timeseries and starting population proportions in the initial experimental mixture b. Simulated trajectories are shown superimposed with mean simulation (red line) and observed clonal fractions (blue dots). The observation time is adjusted to match the simulation diffusion time. c) Summary phylogenetic tree, inferred trajectories and fitness coefficients (relative to reference Clone C) for mixture a. d) As in c but for mixture b (relative to reference Clone C). Boxplots are as defined in Fig. 1b.
Extended Data Fig. 8
Fitness landscape reversal in early Cisplatin treatment in TNBC PDX models. In each column, the left and right sub-panels are from the untreated and treated branches respectively. a) Phylogenetic trees annotated with fittest clones in -Rx and Rx. b) Inferred trajectories, first coloured by clonal assignment, and then coloured by fitness rank, and c) quantiles of selection coefficients of fitClone model fits to each branch with respect to the reference Clone C in TNBC-SA609, Clone C in TNBC-SA535, and Clone A in TNBC-SA1035. e) Distribution over the probability of positive selection over pairs of clones for each series. Boxplots are as defined in Fig. 1b.
Extended Data Fig. 9
Impact of pharmacologic perturbation with cisplatin on fitness landscapes in TNBC-SA609. a) Copy number genotype of Clone H from untreated timeseries. b) Copy number genotype of Clone A from the treated timeseries (arrows indicate differences to Clone H). c) Evolution in absence of treatment (top) and as a function of treatment (bottom). For each sample, the phylogeny with clonal abundance from DLP+ is shown, reflecting selection. d) The observed clonal abundances. Starred timepoints are identical and reproduced to denote the identical starting point. e) Summarised clonal phylogenetic tree.
Extended Data Fig. 10
Impact of pharmacologic perturbation with cisplatin on fitness landscapes in TNBC-SA535. a) Copy number genotype of clone G from untreated timeseries. b) Copy number genotype of clone A from treated timeseries (arrows indicate differences to clone E). c) Evolution in absence of treatment and as a function of drug treatment. For each sample, the phylogeny with clonal abundance from DLP+ is shown, reflecting selection. d) The observed clonal abundances and e) the summarised clonal phylogenetic tree.
Figure 1
Figure 1
Replicate branch of p53 mutant cells and engineered mixture experiment. a) Phylogeny of 3,264 p53−/−a cells, grouped in 11 phylogenetic clades over the timeseries where nodes are groups of cells (scaled in size by number) with shared copy number genotype and edges represent distinct genomic breakpoints. Shaded areas represent clones. Tree root is denoted by the red circle. b) Observed clonal fractions over time, inferred trajectories and quantiles of the posterior distributions over selection coefficients of fitClone model fits to p53−/−a with respect to the reference Clone K. In the box plots, the white line represents the median of the distribution, box edges show 1.5× the interquartile range and whiskers extend to 25th and 75th percentiles. c) Clonal fraction of the diploid reference over time. d) Distribution over the probability of positive selection (PPS) over pairs of clones computed as max(P(si > Sj), 1 – P(si > sj)). Purple dots denote PPS over 0.9. e) Mixture experiment of 75% TP53wt (timepoint X28) and 25% TP53−/−b (timepoint X61). f) Observed clonal fractions in the mixture series with diploid, p53wt shown as (WT-F).
Figure 2
Figure 2
Fitness landscapes of untreated TNBC-SA609 UnRx PDX. a) Heatmap representation of copy number profiles of 3,198 cells from TNBC-SA609, grouped in 6 phylogenetic clades. b) Phylogeny for TNBC-SA609. c) observed clonal fractions, d) inferred fitClone trajectories and e) quantiles of the selection coefficients with respect to the reference Clone C. Boxplots are as defined in Fig. 1b.
Figure 3
Figure 3
Positive selection in TNBC PDX untreated. a) Distribution over the PPS over pairs of clones, analogous to Fig. 1d. b) Clonal proportions of TNBC-SA609 Line 1 at X3 and X8 used to generate the initial mixture M0 and subsequent serial passaging, yielding 4 samples. c) Forward simulations from the original timeseries and starting population proportions in the initial experimental mixture a. Simulated trajectories are shown superimposed with mean simulation (red line) and observed clonal fractions (blue dots). The observation time is adjusted to match the simulation diffusion time.
Figure 4
Figure 4
Fitness landscape reversal in early Cisplatin treatment in TNBC PDX models. a) Phylogenetic tree for the TNBC-SA1035 annotated with fittest clones in −Rx and Rx. b) Inversion of the fitness landscape. Clones are ranked according to their median selection coefficients in untreated and treated conditions, with the top-ranked clones highest.

Comment in

References

    1. Gerstung M et al.The evolutionary history of 2,658 cancers. en. Nature 578, 122–128 (2020). - PMC - PubMed
    1. Williams MJ et al.Quantification of subclonal selection in cancer from bulk sequencing data. en. Nat. Genet 50, 895–903 (2018). - PMC - PubMed
    1. Salichos L, Meyerson W, Warrell J & Gerstein M Estimating growth patterns and driver effects in tumor evolution from individual samples. Nature communications 11, 1–14 (2020). - PMC - PubMed
    1. Shah SP et al.The clonal and mutational evolution spectrum of primary triple-negative breast cancers. Nature 486, 395–399 (2012). - PMC - PubMed
    1. Li Y et al.Patterns of somatic structural variation in human cancer genomes. en. Nature 578, 112–121 (2020). - PMC - PubMed

Publication types