. 2021 Jul;595(7867):438-443.
doi: 10.1038/s41586-021-03674-1. Epub 2021 Jun 23.

A transcriptional switch governs fibroblast activation in heart disease

Affiliations

A transcriptional switch governs fibroblast activation in heart disease

Michael Alexanian et al. Nature. 2021 Jul.

Abstract

In diseased organs, stress-activated signalling cascades alter chromatin, thereby triggering maladaptive cell state transitions. Fibroblast activation is a common stress response in tissues that worsens lung, liver, kidney and heart disease, yet its mechanistic basis remains unclear1,2. Pharmacological inhibition of bromodomain and extra-terminal domain (BET) proteins alleviates cardiac dysfunction3-7, providing a tool to interrogate and modulate cardiac cell states as a potential therapeutic approach. Here we use single-cell epigenomic analyses of hearts dynamically exposed to BET inhibitors to reveal a reversible transcriptional switch that underlies the activation of fibroblasts. Resident cardiac fibroblasts demonstrated robust toggling between the quiescent and activated state in a manner directly correlating with BET inhibitor exposure and cardiac function. Single-cell chromatin accessibility revealed previously undescribed DNA elements, the accessibility of which dynamically correlated with cardiac performance. Among the most dynamic elements was an enhancer that regulated the transcription factor MEOX1, which was specifically expressed in activated fibroblasts, occupied putative regulatory elements of a broad fibrotic gene program and was required for TGFβ-induced fibroblast activation. Selective CRISPR inhibition of the single most dynamic cis-element within the enhancer blocked TGFβ-induced Meox1 activation. We identify MEOX1 as a central regulator of fibroblast activation associated with cardiac dysfunction and demonstrate its upregulation after activation of human lung, liver and kidney fibroblasts. The plasticity and specificity of BET-dependent regulation of MEOX1 in tissue fibroblasts provide previously unknown trans- and cis-targets for treating fibrotic disease.


Figures

Extended Data Figure 1:
Extended Data Figure 1:. Single cell transcriptional landscape of non-cardiomyocytes in heart failure during intermittent exposure to BET bromodomain inhibition
a. Venn diagram showing overlap of TAC-induced and JQ1-suppressed genes (Log2FC>0.5; adj. p value<0.05: FDR, Benjamini-Hochberg) between bulk RNA-Seq from undissociated LV tissue and extracted CMs. b. Heatmap showing the top 5 markers per cluster in the scRNAseq. Total cells n=35,551 in 9 clusters. c. UMAP plots showing cluster identity of all cells (n=35,551) and expression of Dcn, Postn,Ctgf, Lyz2 and Fabp4. d,e UMAP plot colored by sample identity of myeloid (d, n=7,986) and endothelial (e, n=10,672) cells.
Extended Data Figure 2:
Extended Data Figure 2:. Reversible effect of JQ1 exposure on the transcriptional signature of baseline and stressed fibroblasts
a. Expression of known fibroblast stress-related genes shown as UMAP feature plot in fibroblasts (total cells n = 13,937). b. Expression by sample of known fibroblast stress-related genes shown as violin plot in fibroblasts (y axis is normalized UMI levels). c. Dot plot showing expression (avg.exp.scale) and cell percentage of top differentially expressed (DE) marker genes between samples. d. Percentages of the 260 genes upregulated in fibroblasts in TAC vs. Sham that are significantly downregulated in TAC JQ1 vs. TAC (blue bar) and upregulated in TAC JQ1 withdrawn vs. TAC JQ1 (yellow bar). e. Percentages of the 194 genes significantly downregulated in TAC vs. Sham that are significantly upregulated in TAC JQ1 vs. TAC (blue bar) and downregulated in TAC JQ1 withdrawn vs TAC JQ1 (yellow bar). f. Violin plot showing normalized expression score across fibroblast samples of the 194 genes significantly downregulated in TAC vs. Sham and associated TOP GO terms (Fisher exact test).
Extended Data Figure 3:
Extended Data Figure 3:. Fibroblast subclusters associated to stress-related gene programs are depleted in Sham and TAC JQ1 cells
a. UMAP plot of fibroblasts colored by sample identity, n = 13,937. b. UMAP plot of fibroblast subclusters colored by cluster identity. Tree diagram showing cluster relationship is shown to the right. Total cells n = 13,937. c. Histograms showing percentage of each sample in each fibroblast cluster. d. Heatmap showing the top 10 markers per fibroblast cluster in the scRNAseq. Total cells n = 13,937 in 9 clusters. e. Periostin (Postn) expression in fibroblasts by clusters as violin plot (y axis is normalized UMI levels). f. Comparative GO term analysis (Fisher exact test) between fibroblast clusters for fibroblast stress-related biological processes (top GO terms when analyzing the genes driving fibroblast cluster 2,3 and 5).
Extended Data Figure 4:
Extended Data Figure 4:. Defining a catalog of cell population–enriched distal elements in fibroblasts, myeloid and endothelial cells using scATACseq
a. Schematic highlighting the approach to integrate scRNAseq with scATACseq. See extended methods for details. b. Total scATACseq proximal and distal peaks identified in all cells. c. scATACseq tSNE plot showing clusters and cell number of fibroblasts, myeloid and endothelial cells after integration with scRNAseq. d. Venn diagrams showing sample replicate convergence of cell-enriched distal elements found with scATACseq.
Extended Data Figure 5:
Extended Data Figure 5:. scATAC defines chromatin accessibility in heart failure during intermittent exposure to BET bromodomain inhibition
a. Chromatin accessibility at distal elements between samples in fibroblasts, myeloid and endothelial cells. Boxplots show 25th, 50th, and 75th percentile, with whiskers extending to the furthest value no further than 1.5 times the interquartile range (IQR). The 10% most extreme points were trimmed for better visualization (these never included points within the whiskers of the boxplot). Numbers above boxplots show significant p values, statistical significance (Two-sided Wilcoxon rank-sum test) is shown for: Sham vs. TAC; Sham vs. TAC JQ1; TAC vs. TAC JQ1 and TAC JQ1 vs. TAC JQ1 withdrawn. b. Dynamic accessibility (mean with 95% confidence interval) of distal elements in fibroblasts (n=4394), myeloid (n=1325) and endothelial (n=1626) cells clustered by trend across samples. Accessibility trend and top GO terms (binomial test) associated to clusters 2,6,9,11,12 and 14 are shown for fibroblasts. For myeloid and endothelial cells, only top GO terms (binomial test) associated to cluster 2 are shown. c. Enrichment scores for TF motif accessibility in distal elements between samples for the ten most expressed TFs in TAC in fibroblasts, myeloid and endothelial cells.
Extended Data Figure 6:
Extended Data Figure 6:. Nascent transcription in TGFβ-treated cells identifies stress-responsive distal and gene elements
a. Schematic of isolation and immortalization of mouse adult cardiac fibroblasts. b. Expression by qPCR of canonical markers of activated fibroblasts in Unstim and TGFβ-treated cells. Unpaired t-test (Two-tailed). c. Pearson correlation of the two independent biological replicates of PROseq in Unstim and TGFβ-treated cells. d,e. Heatmap of PROSeq coverage of differentially transcribed distal regions (d) and protein coding genes (e) between Unstim and TGFβ-treated fibroblasts. Wald test with Benjamini/Hochberg correction. Signal for replicate 1 & 2 is shown. Top associated GO terms are shown for panel e (Fisher exact test). f. PROseq tag density (± 5kb gene body) in Unstim and TGFβ-treated cells in the genes differentially transcribed in Unstim vs. TGFβ. Top panel: genes upregulated with TGFβ; Bottom panel: genes downregulated with TGFβ. g. PROseq tag density (± 5kb gene body) in Unstim and TGFβ-treated cells in the set of genes upregulated (left, n=260) or downregulated (right, n=194) in TAC vs. Sham in fibroblasts in vivo. h. Co-Accessibility (CoAc) change in fibroblasts of Postn peak 10/11 elements with the promoters of genes within 1Mb of the peak. Change in CoAc with the Postn promoter is in red. N = 27 genes within 1mb. Boxplots show 25th, 50th, and 75th percentile, with whiskers extending to the furthest value no further than 1.5 times the interquartile range (IQR). i. Postn expression measured by qPCR in Unstim and TGFβ-treated in the CRISPRi control line. Unpaired t-test (Two-tailed). j. Postn Peak8, 10/11 and 19 eRNA expression measured by qPCR in Unstim and TGFβ-treated fibroblasts in a CRISPRi control line and lines targeting either Peak8, Peak10/11 or Peak19. Values are normalized to CRISPRi control line in the Unstim condition. One-way ANOVA followed by Sidak’s correction, statistical significance is shown between Unstim samples and TGFβ-treated samples. k. ChIP qPCR data showing enrichment over chromatin input of H3K9me3 in Control and Postn Peak10/11 CRISPRi lines. Unstim condition (left) and TGFβ-treated condition (right). Regions amplifying Peak10, Peak11 and Postn promoters are shown. One-way ANOVA followed by Sidak’s correction, statistical significance is shown between Control and Postn Peak10/11 CRISPRi lines. b,i-k, Numbers above histograms show significant p-val. Data are shown as means ± SEM.
Extended Data Figure 7:
Extended Data Figure 7:. Characterization of a catalog of super-enhancers in fibroblasts, myeloid and endothelial cells
a. Distribution of accessibility in fibroblast, myeloid and endothelial cells in TAC state identifies a class of distal regions (super-enhancers, SE) where the accessibility falls over the inflection point of the curve. b,c. Volcano plots showing correlation coefficients and corresponding p-val (refer to analysis depicted in Fig. 2e) of 239 SEs in myeloid (b) and 267 SEs endothelial (c) cells. d. Distribution of H3K27ac in Unstim and TGFβ-treated fibroblasts identifies a class of distal regions (super-enhancers, SE) where the accessibility falls over the inflection point of the curve. e. Fraction of H3K27ac in Unstim and TGFβ-treated fibroblasts for the enhancers identified in vivo having a negative (left, =264) or positive (right, n=206) correlation with heart function (based on analysis depicted in Fig. 2e). Boxplots show 25th, 50th, and 75th percentile, with whiskers extending to the furthest value no further than 1.5 times the interquartile range (IQR).
Extended Data Figure 8:
Extended Data Figure 8:. Dynamic changes in chromatin accessibility at the Meox1 super-enhancer
a. Comparison of LV ejection fraction with chromatin accessibility at the Meox1 super-enhancer in fibroblasts, myeloid and endothelial cells. b. UMAP plot of Meox1 expression in all non-CM cells (n=35,551). c. Chromatin accessibility at the Meox1 super-enhancer between samples in fibroblasts, myeloid and endothelial cells. Boxplots show 25th, 50th, and 75th percentile, with whiskers extending to the furthest value no further than 1.5 times the interquartile range (IQR). Sample size is: Fibroblast (n=676, 979, 1,906, 1,654), Endothelial (n=731, 1,666, 1,030, 851), Myeloid (n=631, 1,080, 1,021, 712). Numbers above boxplots show significant p values, statistical significance (Two-sided Wilcoxon rank-sum test) is shown for: Sham vs. TAC; Sham vs. TAC JQ1; TAC vs. TAC JQ1 and TAC JQ1 vs. TAC JQ1 withdrawn. d. scATACseq average signal across cells in fibroblast samples at the Meox1 super enhancer identifies multiple dynamic peaks in heart failure with pulsatile exposure to BET inhibition. e. Chromatin accessibility trend between samples (mean with 95% confidence interval) in all identified Meox1 super enhancer peaks.
Extended Data Figure 9:
Extended Data Figure 9:. Brd4-dependent regulation of Meox1 expression
a. Meox1 expression measured by qPCR in Unstim and TGFβ-treated fibroblasts, with or without JQ1. b. Expression measured by qPCR of individual BET genes in Unstim or TGFβ-treated fibroblasts with siRNA targeting either Ctrl, Brd2, Brd3 or Brd4. Statistical significance is shown between Unstim samples and TGFβ-treated samples. c. Meox1 expression measured by qPCR in Unstim or TGFβ-treated fibroblasts with siRNA targeting either Ctrl, Brd2, Brd3 or Brd4. Statistical significance is shown between the TGFβ siCtrl sample and the other TGFβ-treated samples. a-c, All analyzed samples were biological replicates. Numbers above bar graphs show significant p-val (One-way ANOVA followed by Tukey post hoc test). Data are shown as means ± SEM.
Extended Data Figure 10:
Extended Data Figure 10:. The Peak9/10 Meox1 enhancer is strongly transcribed following TGFβ stimulation
a. Volcano plot showing log2FC of PROseq signal of all identified distal scATACseq peaks in fibroblasts (n=9211) between Unstim and TGFβ-treated fibroblasts. Meox1 peak 9 (red) and 10 (orange) are highlighted. b. Co-Accessibility (CoAc) change in fibroblasts of Meox1 peak 9/10 elements with the promoters of genes within 1Mb of the peak. Change in CoAc with the Meox1 promoter is in red. N=115 genes within 1mb. Boxplots show 25th, 50th, and 75th percentile, with whiskers extending to the furthest value no further than 1.5 times the interquartile range (IQR). c,d. Chromosome conformation capture (4C) using Meox1 Peak9/10 region (c) or Meox1 promoter (d) as anchor point. 4C coverage in Unstim and TGFβ-treated fibroblasts are shown in a 922kb (top) and 328kb (bottom) genomic regions. Last track represents the called TGFβ-induced loops with the anchor point (colored in purple). e. Meox1 expression measured by qPCR in Unstim and TGFβ-treated fibroblasts in the CRISPRi control line. Unpaired t-test (Two-tailed). f. Meox1 Peak5, 9/10 and 13 eRNA expression measured by qPCR in Unstim and TGFβ-treated fibroblasts in a CRISPRi control line and lines targeting either Peak5, Peak9/10 or Peak13. Values are normalized to CRISPRi control line in the Unstim condition. One-way ANOVA followed by Sidak’s correction, statistical significance is shown between Unstim samples and TGFβ-treated samples. g. ChIP qPCR data showing enrichment over chromatin input of H3K9me3 in Control and Meox1 Peak9/10 CRISPRi lines. Unstim condition (left) and TGFβ-treated condition (right). Regions amplifying Peak9, Peak10 and Meox1 promoters are shown. One-way ANOVA followed by Sidak’s correction, statistical significance is shown between CRISPRi control and targeted lines. h. Droplet digital (dd) PCR amplifying a WT or mutated region of Meox1 Peak9/10 DNA. Parental fibroblast cell line, WT (clone 20 – isogenic control exposed to CRISPR Cas9 and gRNAs) and Peak9/10 KO (clone 16) cell lines are shown. i. Schematic showing the Meox1 locus with the scATACseq average signal across fibroblasts in TAC. SMAD2/3 motifs (Jaspar - MA1622.1) in the Peak9/10 region and in the Meox1 promoter (±1 kb from TSS) are highlighted. j. Expression measured by qPCR of Smad2 (left) and Smad3 (right) in Unstim or TGFβ-treated fibroblasts with siRNA targeting Ctrl and either Smad2 (left) or Smad3 (right). One-way ANOVA followed by Tukey post hoc test. k. Meox1 expression measured by qPCR in Unstim or TGFβ-treated fibroblasts with siRNA targeting either Ctrl or Smad2. One-way ANOVA followed by Tukey post hoc test. e-g and j,k Numbers above histograms show significant p-val. Data are shown as means ± SEM.
Extended Data Figure 11:
Extended Data Figure 11:. MEOX1 is a regulator of fibroblast activation
a,b. Meox1 expression measured by qPCR in mouse primary cardiac fibroblasts (a) and immortalized cardiac fibroblasts (b) in Unstim condition, TGFβ siCtrl and TGFβ siMeox1. One-way ANOVA followed by Tukey post hoc test. c. Immunofluorescence staining of αSMA in Unstim, and TGFβ cells with a control or a Meox1-targeting siRNA. Nuclei are marked by Hoechst; scale bar =100μm. Quantification of αSMA staining is shown to the right (two independent experiments). Fold change intensity is normalized to cell number. One-way ANOVA followed by Tukey post hoc test. d. αSMA expression measured by qPCR in Unstim condition, TGFβ siCtrl and TGFβ siMeox1. One-way ANOVA followed by Tukey post hoc test. e. Representative images of Edu incorporation in Unstim condition, TGFβ siCtrl and TGFβ siMeox1. DAPI (blue), Edu (red) and CellMask (green). Quantification (two independent experiments) on the right. One-way ANOVA followed by Tukey post hoc test. f. Meox1 expression measured by qPCR in WT and Meox1 over-expression (o/e) mouse immortalized cardiac fibroblasts. Unpaired t-test (Two-tailed). g. Pearson correlation of the three replicates of MEOX1 anti-HA ChIPseq in Unstim and TGFβ-treated cells. h. MEOX1 anti-HA ChIPseq coverage in all protein coding genes (± 2kb gene body) in Unstim and TGFβ-treated fibroblasts. i. Pearson correlation of the two independent biological replicates of PROseq in TGFβ siCtrl and TGFβ siMeox1. j. PROseq coverage in Unstim, TGFβ siCtrl and TGFβ siMeox1 at the distal elements defined as more transcribed in TGFβ vs. Unstim (2101 sites, see Fig. 2a) that are either bound by MEOX1 (496 regions – top panel) or not (1,605 regions – bottom panel). k. PROseq coverage in Unstim, TGFβ siCtrl and TGFβ siMeox1 at the distal elements with high H3K27ac enrichment in Unstim bound by MEOX1 (379 regions). l. PROseq coverage of differentially transcribed genes (Wald test followed by Benjamini/Hochberg) in TGFβ-treated fibroblasts with Ctrl or Meox1 siRNA and associated top GO terms. Signal for replicate 1 & 2 is shown. m. PROseq tag density (± 5kb gene body) in TGFβ siCtrl and TGFβ siMeox1 in genes upregulated in TGFβ siCtrl vs. TGFβ siMeox1 (left); and genes upregulated in TGFβ siMeox1 vs. TGFβ siCtrl (right). n. Violin plot showing normalized expression score of genes upregulated in TGFβ siCtrl vs. TGFβ siMeox1 in PROseq that were captured in the scRNAseq. Expression of Sham and TAC fibroblast samples is depicted. o. Number of MEOX1-bound genes in MEOX1 ChIPseq (in TGFβ-treated cells) in ±2kb gene body, ±100kb gene body or ±500kb gene body in genes differentially transcribed in PROseq: upregulated in TGFβ vs. Unstim (left); downregulated in TGFβ vs. Unstim (center left); upregulated in TGFβ siCtrl vs. TGFβ siMeox1 (center right); upregulated in TGFβ siMeox1 vs. TGFβ siCtrl (right). p. Coverage of MEOX1 ChIP (TGFβ-treated cells), H3K27ac ChIPseq (Unstim and TGFβ-treated cells) and PROseq (Unstim condition, TGFβ siCtrl and TGFβ siMeox1) at the Postn locus. The Postn Peak10/11 region is highlighted in red. a-f, Numbers above bar graphs show significant p-val. Data are shown as means ± SEM.
Extended Data Figure 12:
Extended Data Figure 12:. MEOX1 is expressed in human activated fibroblasts
a. POSTN (left) and MEOX1 (right) expression in human adult fibroblast clusters (y axis is normalized UMI levels). b. Track showing scATACseq average signal across fibroblasts in the human fetal heart in the MEOX1 locus. The syntenic region of Peak9/10 is highlighted in red. c. Bulk RNAseq data of human MEOX1 expression (FPKM) in heart tissue in controls (Ctrl) and individuals with dilated cardiomyopathy (DCM) or hypertrophic cardiomyopathy (HCM) (GSE141910). Unpaired t-test with Benjamini/Hochberg correction. d. Bulk RNAseq data of human MEOX1 expression (raw counts) in lung tissue between controls (Ctrl) and individuals with idiopathic pulmonary fibrosis (GSE134692). Unpaired t-test (Two-tailed). c,d, Numbers above figure show significant p-val.
Figure 1:
Figure 1:. Heart failure reversibility with BET inhibition correlates with myofibroblast cell state
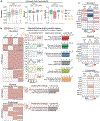
a. Left ventricle (LV) ejection fraction in indicated groups with treatment and withdrawal of JQ1 (50mg/kg/d). ****p-val=1.46x10⁻⁷ for TAC JQ1 vs. TAC JQ1 withdrawn at day 62 (one-way ANOVA with Tukey post hoc test). Sham (n=4), TAC (n=6), TAC JQ1 (n=10), TAC JQ1 withdrawn (n=14). b. scRNA- and ATACseq library generation workflow. c, d. UMAP plot of non-CM cells captured from hearts in (b) colored by cluster (c) and sample identity (d), n=35,551. e. UMAP plot of fibroblasts colored by sample identity, n=13,937. f. Fibroblast Periostin (Postn) expression shown as UMAP feature and violin plots. g. Normalized expression score of the 260 genes increased in TAC vs. Sham across fibroblast samples and associated GO terms (Fisher exact test). h. LV fibrosis in TAC JQ1 (n=4) and TAC JQ1 withdrawn (n=8) mice by picrosirius red staining and quantification. (*p=0.0081, Mann-Whitney with Tukey post hoc test). Bar=250um a,h Data are shown as means ± SEM.
Figure 2:
Figure 2:. Reversibility of fibroblast chromatin states reveals DNA elements that correlate with heart function
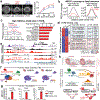
a. PROseq heatmap of differentially transcribed distal regions (Wald test with Benjamini/Hochberg correction) in unstimulated (Unstim) vs. TGFβ-treated fibroblasts and associated top GO terms (binomial test). Mean signal for 2 replicates is shown. b. PROseq coverage in Unstim and TGFβ-treated fibroblasts in vitro of scATACseq peaks opening (2,553) or closing (567) between Sham and TAC in fibroblasts in vivo. c. scATACseq from fibroblasts in vivo and PROseq at the Postn locus. A highly transcribed region (Peak10/11) is highlighted in pink with co-accessibility (CoA) between the Postn promoter and Peak10/11. d. Postn expression by qPCR in Unstim or TGFβ-treated fibroblasts in CRISPRi lines targeting either Peak8 (***p-val=0.0001), Peak10/11 or Peak19 (***p-val=0.0001). One-way ANOVA followed by Tukey post hoc test. Values normalized to CRISPRi control line under unstim conditions (shown in Extended Data Fig. 6i). Data are means ± SEM. e. Schematic of correlation analysis between LV ejection fraction and chromatin accessibility highlighting a negative or positive correlation. f. Volcano plot showing correlation coefficients (from analysis in Fig. 2e) and corresponding p-val of 470 super-enhancers in fibroblasts.
Figure 3:
Figure 3:. Chromatin accessibility and nascent transcription identify a cis-element controlling Meox1 expression
a. UMAP plot of fibroblasts colored by sample identity or Meox1 expression with associated violin plots. b. Mouse Meox1 locus showing from top to bottom: scATACseq from fibroblasts in vivo; ChIPseq for BRD4 (GSE46668), H3K27ac and CTCF (ENCSR000CDF and ENCSR000CBI) in the adult heart; coverage of PROseq in Unstim and TGFβ-treated fibroblasts in vitro; and co-accessibility measures between Meox1 promoter and Peak9 region in fibroblasts. A highly transcribed region (Peak9/10) is highlighted in pink. c. Schematic showing CRISPRi targeting of 3 regions within the Meox1 enhancer (top). Meox1 expression by qPCR in Unstim or TGFβ-treated fibroblasts upon CRISPRi targeting either Peak5 (****p-val=1.82e−10), Peak9/10 or Peak13 (****p-val=1.64e−8). Values normalized to CRISPRi control line under unstim conditions (Extended Data Fig. 10e). d. Meox1 expression by qPCR in Unstim or TGFβ conditions in WT (****p-val=1.99e−8) or Peak9/10 deleted cells (****p-val=1.99e−8). e. Peak9/10 eRNA (top, **** p-val=1.76e−8 and ****P=5.29e−6) and Meox1 (bottom, **** p-val=9.80e−9 and **** p-val=1.29e−8) expression by qPCR in Unstim and TGFβ conditions with control or Smad3-targeting siRNAs. c-e Data are means ± SEM. One-way ANOVA followed by Tukey post hoc test.
Figure 4:
Figure 4:. MEOX1 regulates fibroblast plasticity and profibrotic function
a. Images and quantification (n=4 per condition) of fibroblasts seeded on compressible collagen gel matrices in Unstim or TGFβ conditions with a control or a Meox1-targeting siRNA. Two-way ANOVA followed by Bonferroni correction for TGFβ siCtrl vs. TGFβ siMeox1. **p-val=0.0082 (24h), **p-val =0.0015 (48h) and ****p-val =2.21e−5 (72h). b. MEOX1 ChIPseq coverage in Unstim and TGFβ-treated cells at distal elements identified by high enrichment of H3K27ac in Unstim (left, 2194 regions) or TGFβ-treated (right, 2898 regions) cells. c. PROseq coverage under indicated conditions at distal elements with high H3K27ac enrichment in TGFβ vs. Unstim bound by MEOX1 (427 regions) and associated top GO terms (binomial test). d. PROseq coverage of differentially transcribed genes (Wald test with Benjamini/Hochberg correction) in TGFβ-treated fibroblasts with Ctrl or Meox1 siRNA and associated top GO terms (Fisher exact test). Mean signal for 2 replicates shown. e. Coverage of indicated ChIPseq or PROseq with or without TGFβ in cardiac fibroblasts at the Ctgf locus with Ctrl or Meox1 siRNA. f. UMAP plot of adult human cardiac fibroblasts colored by cluster identity (left) and POSTN or MEOX1 expression (right). g. MEOX1 expression by qPCR in primary human fibroblasts from indicated tissues. One-way ANOVA followed by Tukey post hoc test for Unstim vs. TGFβ (****p-val=1.29e−5 lung, **** p-val=1.49e−6 liver, ****p-val =5.83e−5 kidney) and TGFβ vs. TGFβ+JQ1 (****p-val=3.91e−6 lung, **** p-val=1.06e−6 liver, **** p-val=4.54e−5 kidney). h. Model of stress-induced activation of fibroblasts regulated by Meox1. a,g Data are shown as means ± SEM.

Comment in

Similar articles

  • Chromatin remodelling drives immune cell-fibroblast communication in heart failure.
    Alexanian M, Padmanabhan A, Nishino T, Travers JG, Ye L, Pelonero A, Lee CY, Sadagopan N, Huang Y, Auclair K, Zhu A, An Y, Ekstrand CA, Martinez C, Teran BG, Flanigan WR, Kim CK, Lumbao-Conradson K, Gardner Z, Li L, Costa MW, Jain R, Charo I, Combes AJ, Haldar SM, Pollard KS, Vagnozzi RJ, McKinsey TA, Przytycki PF, Srivastava D. Alexanian M, et al. Nature. 2024 Nov;635(8038):434-443. doi: 10.1038/s41586-024-08085-6. Epub 2024 Oct 23. Nature. 2024. PMID: 39443808 Free PMC article.
  • Dynamic Chromatin Targeting of BRD4 Stimulates Cardiac Fibroblast Activation.
    Stratton MS, Bagchi RA, Felisbino MB, Hirsch RA, Smith HE, Riching AS, Enyart BY, Koch KA, Cavasin MA, Alexanian M, Song K, Qi J, Lemieux ME, Srivastava D, Lam MPY, Haldar SM, Lin CY, McKinsey TA. Stratton MS, et al. Circ Res. 2019 Sep 13;125(7):662-677. doi: 10.1161/CIRCRESAHA.119.315125. Epub 2019 Aug 14. Circ Res. 2019. PMID: 31409188 Free PMC article.
  • Chromatin Remodeling Drives Immune-Fibroblast Crosstalk in Heart Failure Pathogenesis.
    Alexanian M, Padmanabhan A, Nishino T, Travers JG, Ye L, Lee CY, Sadagopan N, Huang Y, Pelonero A, Auclair K, Zhu A, Teran BG, Flanigan W, Kim CK, Lumbao-Conradson K, Costa M, Jain R, Charo I, Haldar SM, Pollard KS, Vagnozzi RJ, McKinsey TA, Przytycki PF, Srivastava D. Alexanian M, et al. bioRxiv [Preprint]. 2023 Jan 7:2023.01.06.522937. doi: 10.1101/2023.01.06.522937. bioRxiv. 2023. PMID: 36711864 Free PMC article. Preprint.
  • Transcriptional plasticity of fibroblasts in heart disease.
    Micheletti R, Alexanian M. Micheletti R, et al. Biochem Soc Trans. 2022 Oct 31;50(5):1247-1255. doi: 10.1042/BST20210864. Biochem Soc Trans. 2022. PMID: 36281993 Free PMC article. Review.
  • Regulators of cardiac fibroblast cell state.
    Bretherton R, Bugg D, Olszewski E, Davis J. Bretherton R, et al. Matrix Biol. 2020 Sep;91-92:117-135. doi: 10.1016/j.matbio.2020.04.002. Epub 2020 May 19. Matrix Biol. 2020. PMID: 32416242 Free PMC article. Review.

Cited by

References

    1. Rockey DC, Bell PD & Hill JA Fibrosis--A Common Pathway to Organ Injury and Failure. N. Engl. J. Med 373, 96 (2015). - PubMed
    1. Jun J-I & Lau LF Resolution of organ fibrosis. J. Clin. Invest 128, 97–107 (2018). - PMC - PubMed
    1. Anand P et al. BET bromodomains mediate transcriptional pause release in heart failure. Cell 154, 569–582 (2013). - PMC - PubMed
    1. Spiltoir JI et al. BET acetyl-lysine binding proteins control pathological cardiac hypertrophy. J. Mol. Cell Cardiol 63, 175–179 (2013). - PMC - PubMed
    1. Duan Q et al. BET bromodomain inhibition suppresses innate inflammatory and profibrotic transcriptional networks in heart failure. Sci. Transl. Med 9, (2017). - PMC - PubMed

Publication types