. 2021 Jul;595(7868):554-559.
doi: 10.1038/s41586-021-03670-5. Epub 2021 Jun 23.

Molecular logic of cellular diversification in the mouse cerebral cortex

Affiliations

Molecular logic of cellular diversification in the mouse cerebral cortex

Daniela J Di Bella et al. Nature. 2021 Jul.

Erratum in

Abstract

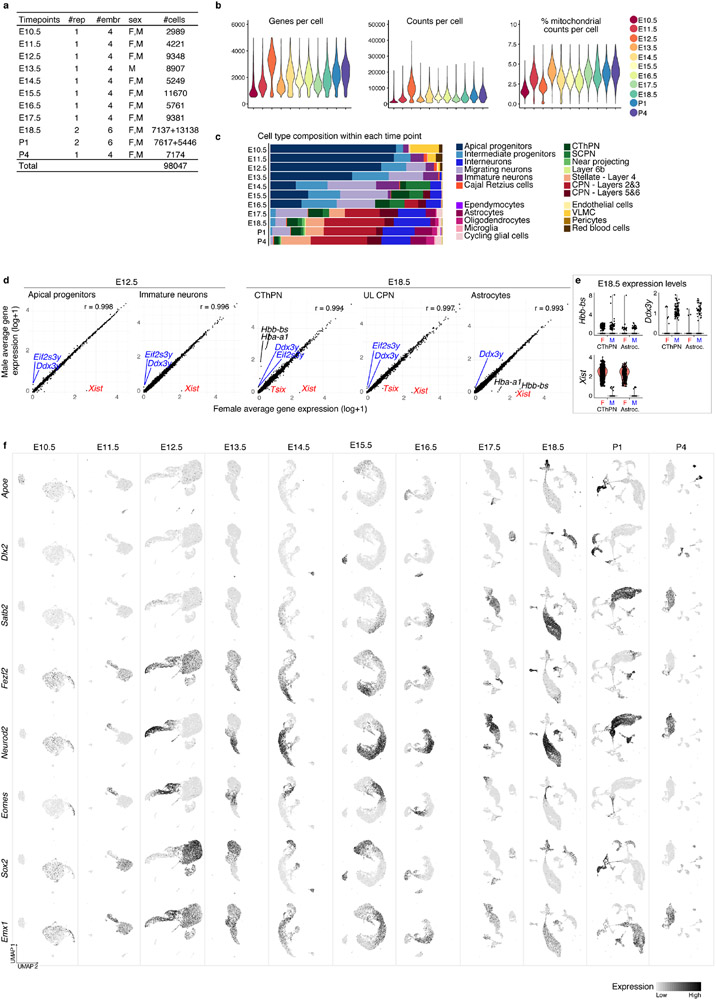
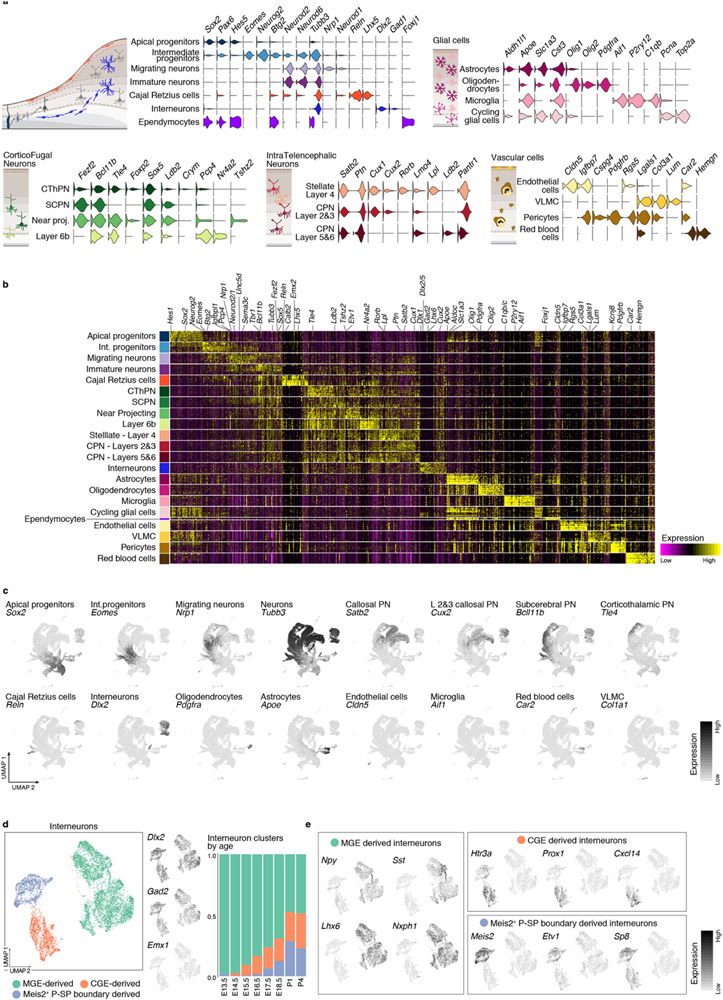
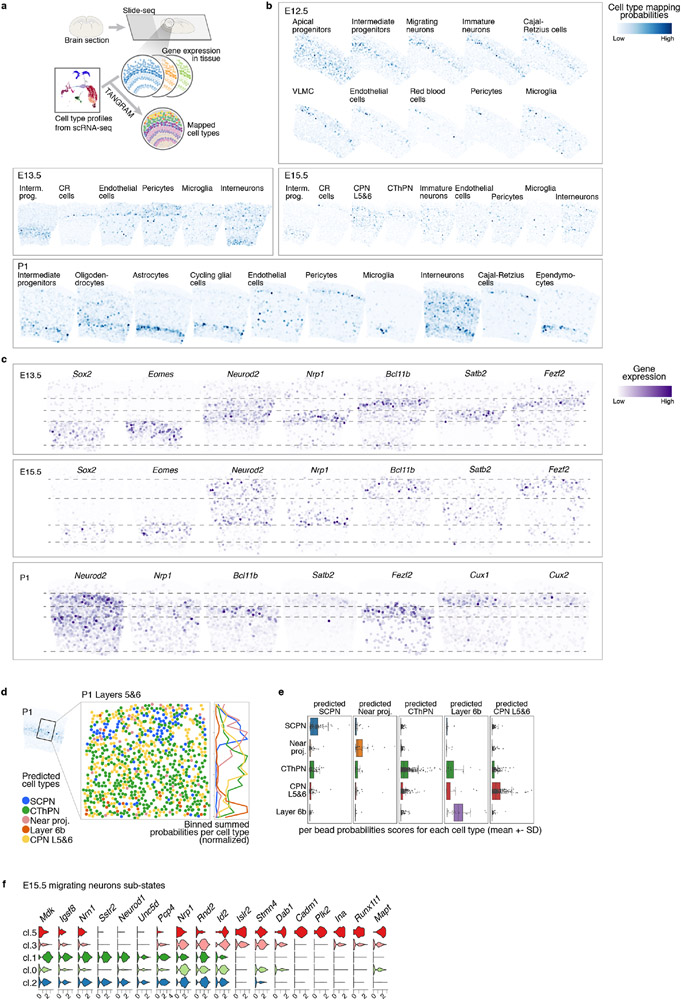
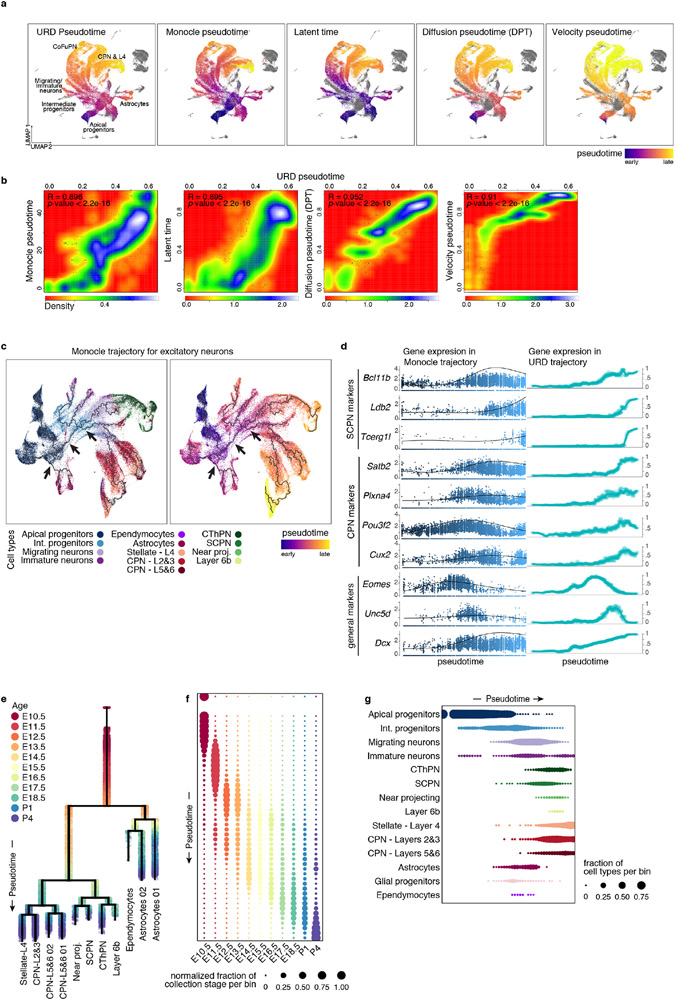
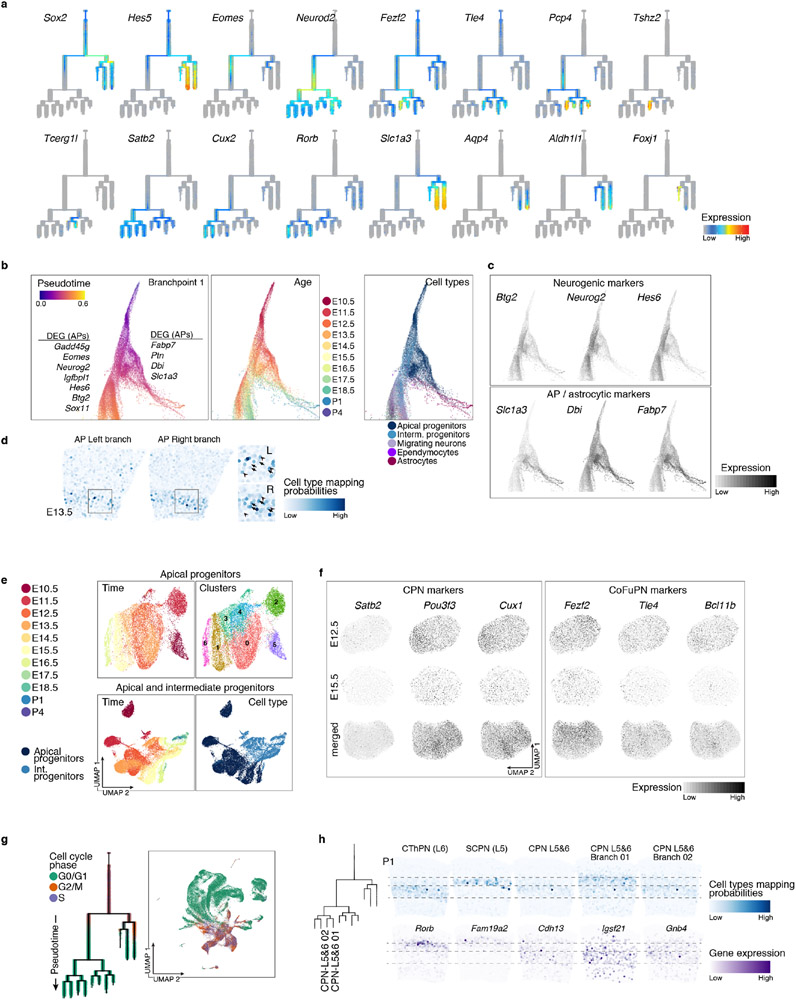
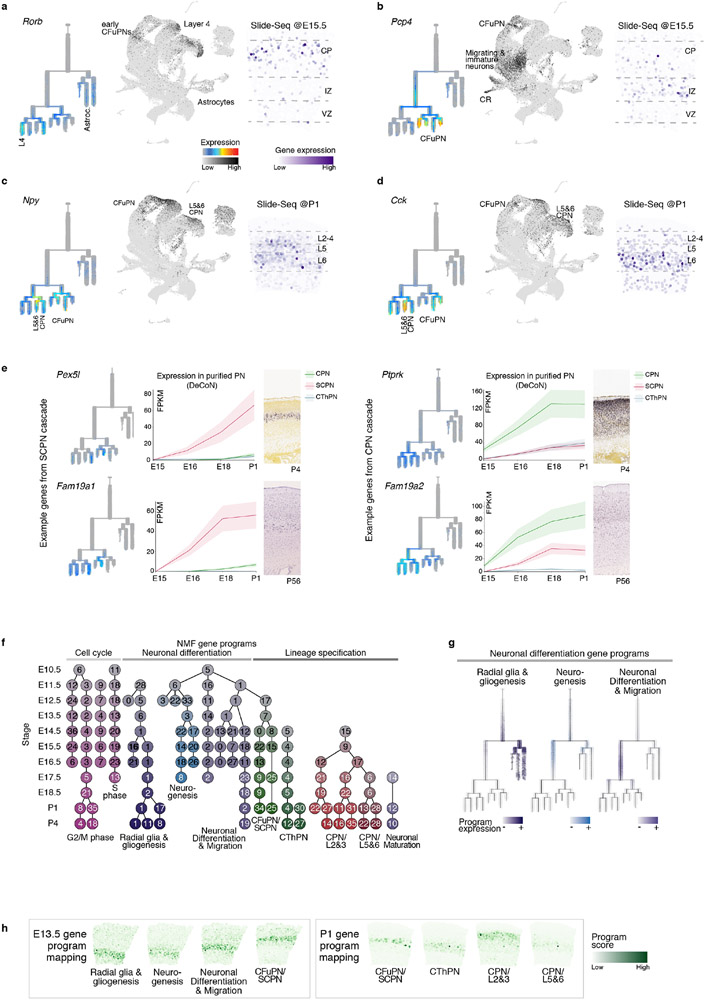
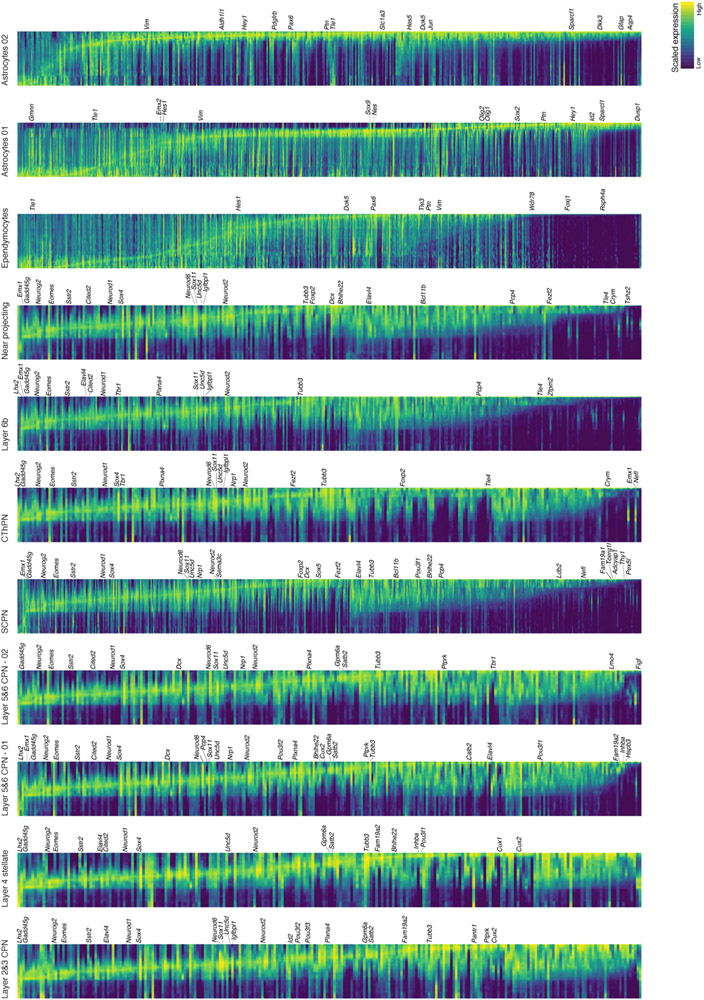
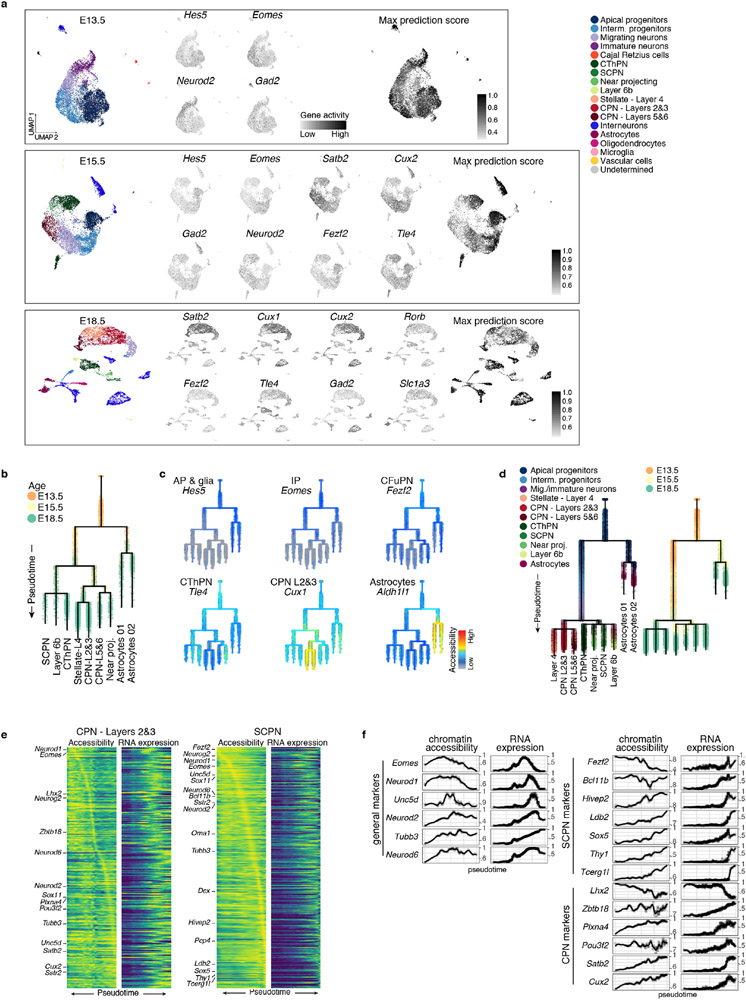
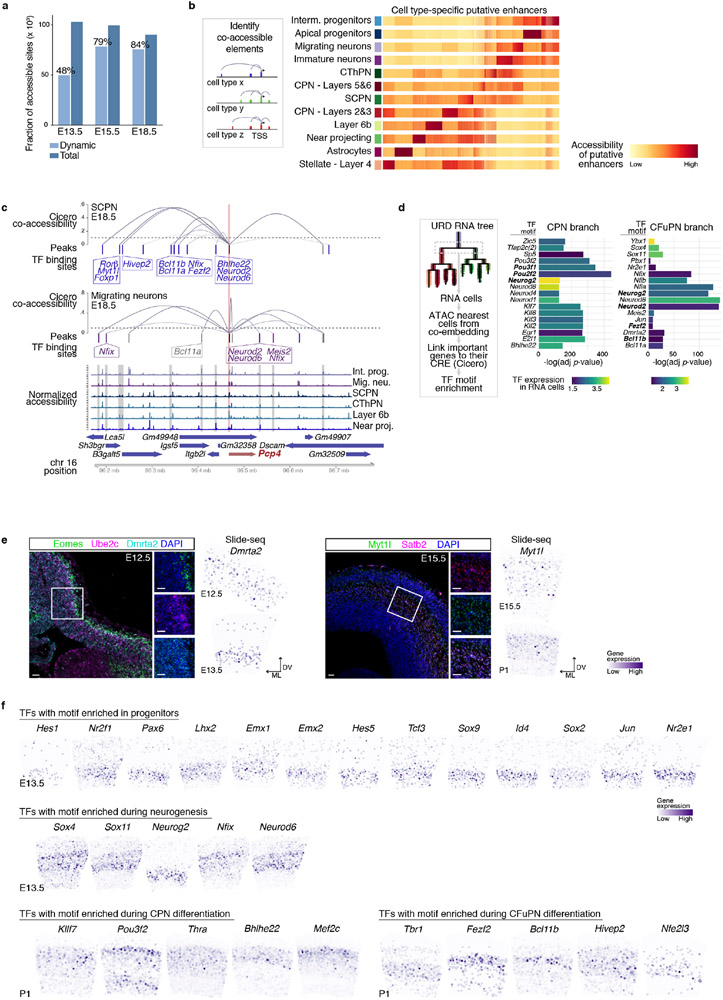
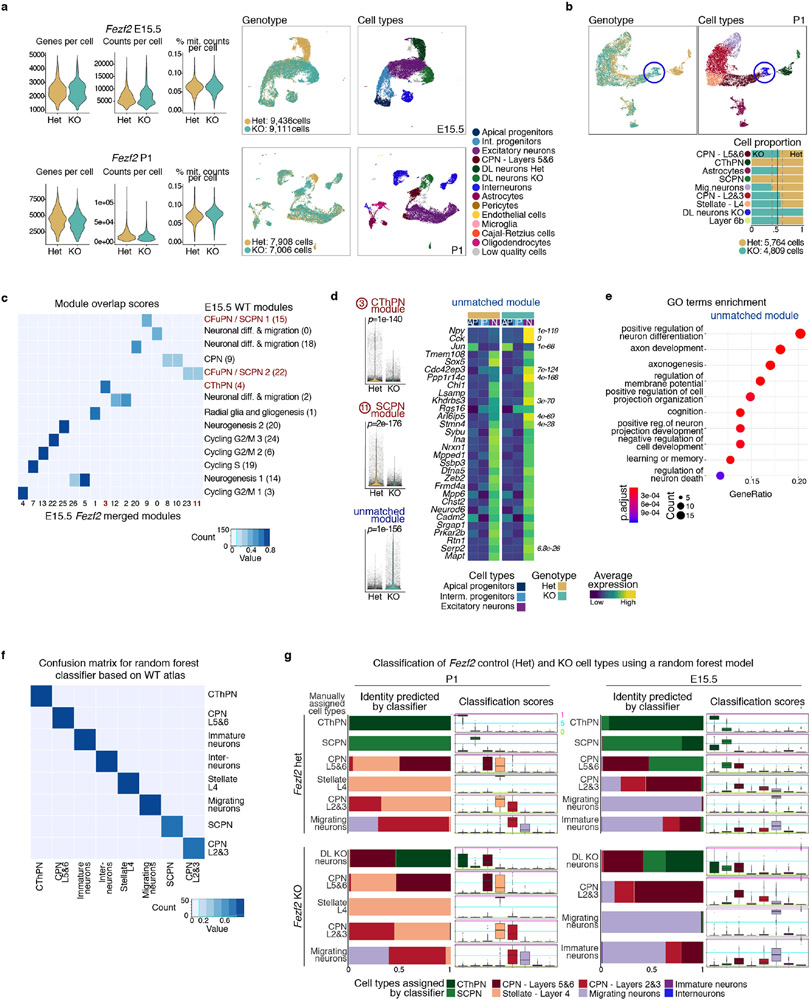
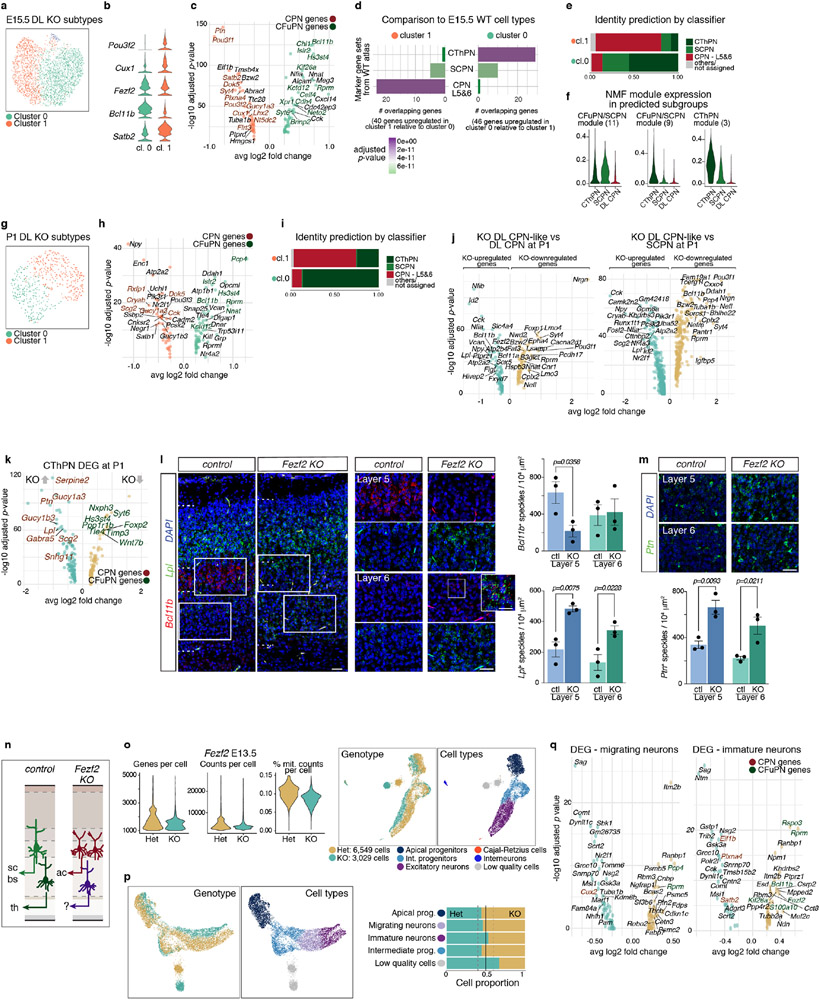
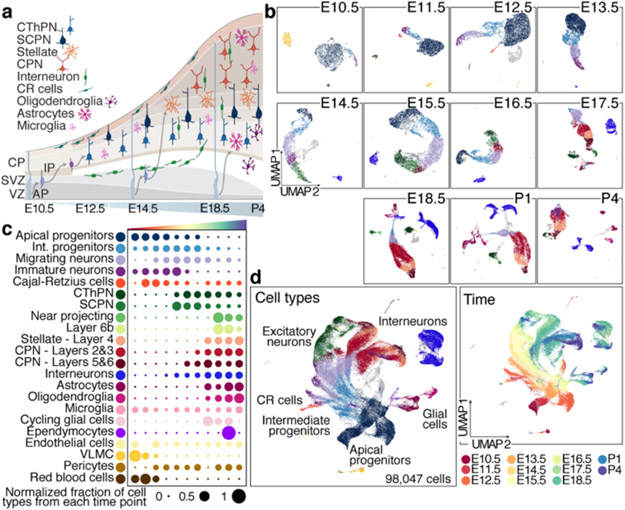
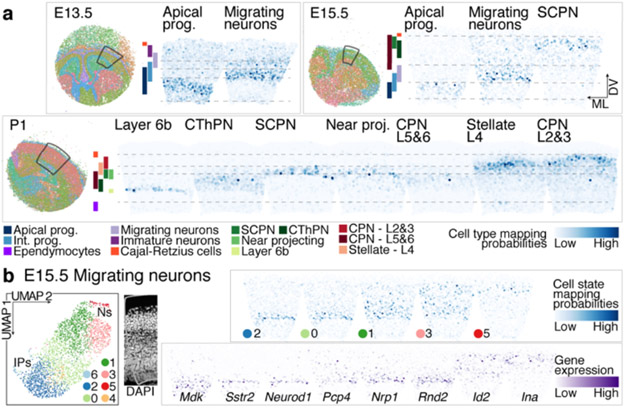
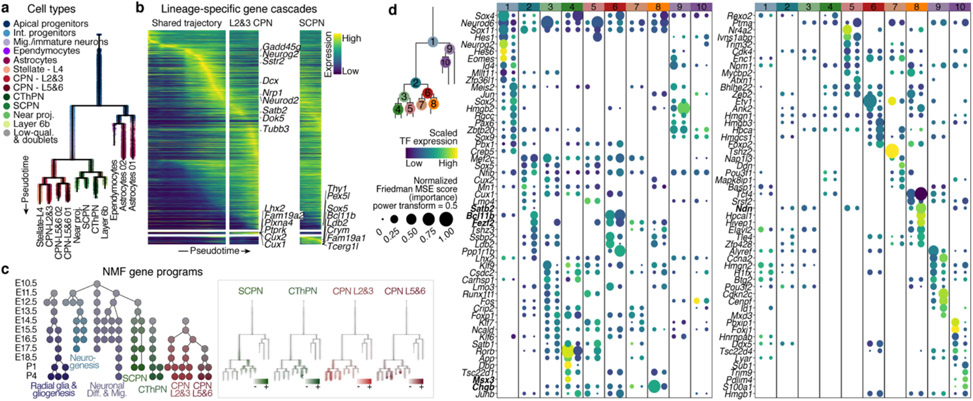
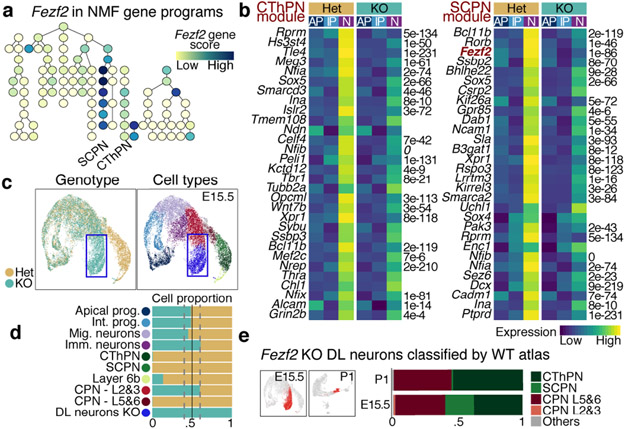
The mammalian cerebral cortex has an unparalleled diversity of cell types, which are generated during development through a series of temporally orchestrated events that are under tight evolutionary constraint and are critical for proper cortical assembly and function1,2. However, the molecular logic that governs the establishment and organization of cortical cell types remains unknown, largely due to the large number of cell classes that undergo dynamic cell-state transitions over extended developmental timelines. Here we generate a comprehensive atlas of the developing mouse neocortex, using single-cell RNA sequencing and single-cell assay for transposase-accessible chromatin using sequencing. We sampled the neocortex every day throughout embryonic corticogenesis and at early postnatal ages, and complemented the sequencing data with a spatial transcriptomics time course. We computationally reconstruct developmental trajectories across the diversity of cortical cell classes, and infer their spatial organization and the gene regulatory programs that accompany their lineage bifurcation decisions and differentiation trajectories. Finally, we demonstrate how this developmental map pinpoints the origin of lineage-specific developmental abnormalities that are linked to aberrant corticogenesis in mutant mice. The data provide a global picture of the regulatory mechanisms that govern cellular diversification in the neocortex.


Figures

Extended Data Figure 1 (related to Figure 1)
Extended Data Figure 1 (related to Figure 1). Classification of cell types in scRNA-seq data from individual time points
a Number of replicates, total number of embryos, sex of animals and number of cells analyzed per time point. b Number of genes, number of mRNA molecules (counts), and percentage of mitochondrial counts per cell in each time point. c Proportion of cells corresponding to the different cell types present in each time point. 85 to 98% of cells were successfully identified for each time point. The earliest stages were primarily composed of apical and intermediate progenitors: AP+IP = 77% at E10.5, 80% at E11.5, 69% at E12.5, 66% at E13.5). d Correlation between male (M, Xist expression <1) and female (F, Xist expression >1) cells at E12.5 and E18.5 in selected cell types. Pearson correlation coefficients are indicated. Distinct genes include X-chromosome genes Xist and Tsix and Y-chromosome genes Ddx3y and Eif2s3y. Some hemoglobin genes also appear distinct, but, as shown in e they constitute few outlier cells. e Normalized expression levels of some of distinct genes between male and female cells at E18.5. Only two cell types are shown for clarity. f UMAP visualization of cells collected at each time point, showing expression levels (normalized) of marker genes for dorsal derivatives (Emx1), apical progenitors (Sox2), intermediate progenitors (Eomes), excitatory neurons (Neurod2), inhibitory interneurons (Dlx2), and glial cells (Apoe).
Extended Data Figure 2 (related to Figure 1)
Extended Data Figure 2 (related to Figure 1). Molecular signatures and interneuron heterogeneity in the developing cerebral cortex
a Selective expression (normalized) of marker genes per cell type in the combined scRNA-seq dataset. Cell types are grouped based on their identity and shared marker genes. b Gene signatures for all cell types identified in the combined time points. Top 20 differentially expressed genes for each cell type are presented. Cells were down-sampled to a maximum of 500 cells per cell type. b Expression of canonical marker genes for selected cell types in the UMAP visualization of the combined scRNA-seq time course. c Different subtypes of interneurons integrate into the developing cortex through time. From left to right: clustering of interneurons collected at all time points, visualized via UMAP. Interneuron UMAP plots show the expression of the inhibitory markers Dlx2 and Gad2, as well as a marker of dorsally-derived cell types (Emx1), not expressed by interneurons. Proportion of cells corresponding to each cluster in each time point. d Expression of genes characteristic of interneurons of different embryonic origins. Medial ganglionic eminence (MGE)-derived interneurons express Npy, Sst, Lhx6 and Nxph1. Interneurons originating in the CGE (caudal ganglionic eminence) are positive for Htr3a, Prox1, Cxcl14 and Sp8. A second population of Htr3a+ interneurons express Meis2, Etv1 and Sp8, putatively from the pallial-subpallial (P-SP) boundary.
Extended Data Figure 3 (related to Figure 2)
Extended Data Figure 3 (related to Figure 2). Spatial mappings of cell types in the developing cerebral cortex
a Mapping of extended cell types from the scRNA-seq data onto the matching Slide-seq section. Beads are colored according to the probability of the cell type being mapped in that position. b Gene expression of characteristic genes validating cell types matched for each time point. c Mapping probabilities for the deep layer cell types grouped by the cell type assigned (cell type with highest probability) corresponding to b. In box plots the middle line is the median, the lower and upper hinges correspond to the 25% and 75% quantiles, the upper whisker corresponds to the largest value no larger than 1.5×IQR from the hinge (where IQR is the inter-quartile range) and the lower whisker corresponds to the smallest value at most 1.5×IQR of the lower hinge. Total number of beads= 812. d Gene expression in E15.5 scRNA-seq data of genes associated with the migrating neuron sub-states identified in Figure 2d.
Extended Data Figure 4 (related to Figure 3)
Extended Data Figure 4 (related to Figure 3). Consistent ordering of cells in developmental trajectories and characterization of branching tree of cortical development
a UMAP visualizations of the scRNA-seq data from combined time points, with cells colored by pseudotime inferred by different methods. Left to right: URD pseudotime, Monocle3 pseudotime, Latent time from sc-Velo, Diffusion pseudotime (DPT), and Velocity pseudotime. Purple represents earlier cells in the trajectory, while yellow labels later cells. Grey: cells that were excluded from the trajectory. b Correlation (red low and white high) for all cells between URD pseudotime values and pseudotime calculated by the specified method. R coefficient and p-value of the Pearson correlation is stated. c UMAP visualization of the cells used for trajectory building (same as cells used for Fig. 3a and related figures) colored by cell type (left) and pseudotime (right), on which a developmental trajectory was calculated using Monocle3. A similar branching structure was found. While it did not allow for finer segregation of the terminal neuronal types, Monocle3 ascribed a unique trajectory going from progenitors to all classes of neurons, with a post-mitotic branching into CPN and CFuPN branches (arrows, similar to URD). d Gene expression along trajectories calculated with URD (right) or Monocle3 (left). e URD trajectory branching tree of the developing cortex. Cells are colored according to their developmental time of collection. f-g Normalized fraction of cells corresponding to each time point of collection (f) and to each cell type (g) across binned pseudotime, showing that pseudotime is aligned with age and cell type (compare to Fig.1c).
Extended Data Figure 5 (related to Figure 3)
Extended Data Figure 5 (related to Figure 3). Neuronal cell types diverge post-mitotically
a Branching trees showing the expression of marker genes of apical progenitors (Sox2, Hes5), intermediate progenitors (Eomes) and excitatory neurons (Neurod2), as well as genes characteristic of the dorsally-derived cortical cell types, including callosal neurons (Satb2, Cux2), layer 4 stellate neurons (Rorb), corticofugal neurons (Fezf2, Tle4, Pcp4, Tcerg1l), putative near-projecting neurons (Tshz2), astrocytes (Slc1a3, Aqp4, Aldh1l1), and ependymocytes (Foxj1). There is a sequential progression of apical progenitors, intermediate progenitors and excitatory neurons, followed by neuronal subtypes, astrocytes and ependymocytes. b-c Force-directed layout embedding representation of the developmental branching tree, showing the initial part of the tree. Cells are colored according to their pseudotime value (left), age of collection (middle), or cell type (right). Differentially expressed genes between AP in each branch are highlighted and their expression levels are shown in c (see also Supplementary Information Table 2). d Tangram mapping probabilities of E13.5 AP from each branch onto matching Slide-seq section show that both states coexist in the ventricular zone. Arrowheads and arrows in the inset show probabilities in individual beads. AP corresponding to the astrocytic and neuronal branches form a continuum of cells. e Top: Apical progenitors from different ages form a continuum of cells and do not segregate into distinct clusters. AP from all time points were sub-clustered separately, colored by age and clusters identified by Seurat. Bottom: Similar effect is observed when both apical and intermediate progenitors were sub-clustered, cells first separate mostly by cell type, and then continuously by time point. f Expression of CPN markers (Satb2, Pou3f3 and Cux1, left), and CFuPN markers (Fezf2, Tle4 and Bcl11b, right) in both early (E12.5) and late (E15.5) AP, as well as in the combined AP populations (all time points), when AP were co-embedded using the top 100 differentially expressed genes between CFuPN and CPN as input for principal component analysis and downstream clustering and visualization. Cell-type marker genes are expressed in progenitors but do not drive clustering of the cells. g Separation in different classes of neurons occurs post-mitotically. Branching tree and UMAP representation of the full developmental atlas colored by cell-cycle phase, as predicted by gene expression. h Tangram mapping of layer 5&6 CPN on P1 Slide-seq section. P1 cells allocated to each of the two terminal branches broadly labeled as layer 5&6 CPN were mapped onto the Slide-seq P1 section to find their distribution in the developing cortex. Mapping probabilities (top) indicated that cells from branch 1 were more likely to be mapped to layer 5, while cells from branch 2 mapped with enrichment to layer 6. Genes differentially expressed between both populations, layer 5- (Rorb, Fam19a2) and layer 6-CPN markers (Cdh13, Igsf21, Gnb4) show matching distribution (bottom).
Extended Data Figure 6 (related to Figure 3)
Extended Data Figure 6 (related to Figure 3). Novel expression pattern of selected genes and NMF gene modules
a-d Novel expression patterns emerging from the inferred tree. Expression levels overlaid on the tree (left), UMAP of full scRNA-seq developmental data (middle), and Slide-seq counts on an E15.5 or P1 section of cortex (right) for each gene. Rorb is expressed in developing CFuPN, astrocytes and layer 4 stellate neurons and present in the deep cortical plate (CP) (a). Pcp4 is expressed in migrating and immature neurons that contribute to both CPN and CFuPN, as well as in SCPN, layer 6b, NP and Cajal-Retzius cells (CR), and is found in the intermediate zone (IZ) and CP (b). Npy is expressed in CFuPN and highly in CPN of layers 5&6. Positive Npy signal is evident in the deep CP through Slide-seq (c). Cck was also detected in CFuPN and at higher levels in CPN of layers 5&6. Low levels of expression in the CP were detected via Slide-seq (d). VZ: ventricular zone. e Validation of expression of novel cell type-specific genes emerging from the cascade analysis. Expression levels overlaid on the tree (left), time course expression on purified subtypes of PN from DeCoN transcriptomic resource, (middle), and in situ hybridization from the Allen Developing Mouse Brain Atlas, (right, age indicated in figure). f Complete set of gene programs of connected modules found by NMF. Each circular node represents a module. Modules are horizontally aligned to the developmental stage the module was computed from, and colored by the annotated function (see also Supplementary Information Table 3). g Scaled expression overlaid on branching tree of modules corresponding to broad neuronal differentiation programs, colored according to program identity. h Selected NMF modules expression from scRNA-seq data mapped onto time-matched Slide-seq section using tangram (Methods).
Extended Data Figure 7 (related to Figure 3)
Extended Data Figure 7 (related to Figure 3). Genetic cascades accompanying development of cortical cell types
Gene cascades for projection neuron subtypes, astrocytes and ependymocytes differentiaton. The x axis represents pseudotime across the tree. Each row is a gene where gene expression is scaled to the maximum observed expression and then smoothened. Genes are ordered by the pseudotime value at which they enter and then leave “peak” expression (expression 50% higher than minimum value), and start and then leave “expression” (expression 20% higher than minimum value), in that order. Smoothening of expression values was performed using spline fitting from URD for expression dynamics (Methods). Known marker genes for the cell type are labelled; see Supplementary Information Table 3 for the full list of genes.
Extended Data Figure 8 (related to Figure 3)
Extended Data Figure 8 (related to Figure 3). Extended analysis of genes distinguishing between branches in URD tree
a Feature importance (0.5 power transformed – dot size) and average expression of genes predicted to be involved in cell types divergence (row-scaled – color). Top 10 genes per branch, ranked by their Friedman MSE score (importance) for distinguishing between cells in one branch versus cells in sibling and parent branch. Color bar at top indicates branch-points marked on the tree to the left. Arrows indicate daughter branches. Genes in red correspond to transcription factors. Expression in parent branch not shown. b Gene Ontology analysis showing molecular function enrichment among genes involved in branch-points as determined in panel a. c Simplified URD branching trees on which average gene expression within a segment and a pseudotime bin is overlaid on the tree structure, showing restricted expression patterns of genes identified in a.
Extended Data Figure 9 (related to Figure 4)
Extended Data Figure 9 (related to Figure 4). Characterization of scATAC-seq atlas and developmental trajectories of accessible elements through of cortical development
a scATAC-seq data per time point. UMAP visualization of the single cells colored by their predicted identity from integration with scRNA-seq datasets (left). Gene accessibility of selected markers for main cell types present in each time point (middle). Maximum prediction score for each cell based on labels transferred from scRNA-seq data (right). b URD chromatin accessibility trajectories during cortical development. Cells are colored according to their age of collection. c ATAC trees highlighting the accessibility of marker genes characteristic of the different cortical cell types, including apical and intermediate progenitors, astrocytes, callosal and corticofugal neurons. d RNA-based tree generated from only the E13.5, E15.5 and E18.5 time points, corresponding to the scATAC-seq data. Trees are colored by cell type (left) and time of collection (right). e Chromatin accessibility and gene expression cascades for layers 2&3 CPN and SCPN. Same genes are plotted for both modalities, in the same order. f Chromatin accessibility and gene expression across pseudotime for illustrative genes from the SCPN cascade, CPN markers, or general neuronal markers plotted on the SCPN cascade. In many cases accessibility rises before gene expression.
Extended Data Figure 10 (related to Figure 4)
Extended Data Figure 10 (related to Figure 4). Transcription factors with binding sites enriched along cortical development
a Total number of accessible sites identified per time point and fraction that is dynamic across cell types (i.e., is enriched in at least one cell type). b Left: schematic of the approach used to identify candidate cell type-specific enhancers. Differential expression analysis identified cell type-specific genes, for which we calculated co-accessibility (correlation higher than 25%) between distal elements (within a 250 kb region) and target gene promoters using Cicero, within each cell type. c Distal elements co-accessible with the Pcp4 promoter region in E18.5 SCPN and migrating neurons. Cicero co-accessibility is shown in blue curves, detected peaks in each cell type are shown as colored bars. Black bars correspond to promoter peak, blue bars are peaks selectively co-accessible in CFuPN, and purple bars are peaks only co-accessible in migrating neurons. Boxes indicate transcription factors whose motifs are present in indicated peaks. Peaks are aligned to coverage plots (bottom) showing combined ATAC reads for the indicated cell types. Chromosome coordinates and genes are indicated at bottom. d TF binding sites enrichment on accessible sites of cells in the CPN vs CFuPN branch point (see Fig. 3d) shows significant enrichment of some of the TF detected in Fig. 3d, suggesting an actual role in this step. e Left: In situ hybridization against Eomes (IP marker), Ube2c (mitotic marker) and Dmrta2 showing expression of the latter in the dorsal ventricular zone (VZ) of a E12.5 developing cortex. Right: In situ hybridization against Satb2 and Myt1l showing expression of the latter in newborn neurons, co-expressed with Satb2. Slide-seq gene expression at the indicated ages show similar expression patterns. Scale bars are 30 μm. Representative images from in situ hybridizations repeated in 2 different embryos. ML and DV indicate dorso-ventral and medio-lateral orientations. f Slide-seq gene expression of several transcription factors (TFs) whose binding sites were found to be enriched within the accessible regions of the indicated trajectories (or portion of). Confirmation of gene expression in target cell type supports TF activity.
Extended Data Figure 11 (related to Figure 5)
Extended Data Figure 11 (related to Figure 5). CFuPN acquire CThPN-like and layers 5&6 CPN-like identities in the absence of Fezf2
a Violin plots of number of genes (left), number of mRNA molecules (counts; middle), and percentage of mitochondrial counts (right) per cell in control (Het) and KO Fezf2, and UMAP visualizations of merged scRNA-seq data sets at E15.5 (top) and P1 (bottom). UMAP visualizations are colored by genotype or assigned cell type. b UMAP visualization of single-cell transcriptomes from the excitatory lineage of control and KO cortices at P1 (as shown in Fig. 5c for E15.5), colored by genotype (left) and cell type (right). Proportion of cells of each cell type by genotype (bottom). c Heatmap showing the overlapping scores between NMF modules identified in the E15.5 Fezf2 datasets and the original E15.5 wild-type modules. All modules were identified with an overlapping score of 40% or higher. d Left: scaled module expression of significant modules in all cells (two-sided Wilcoxon Sum Rank test, Bonferroni correction). Right: average expression of the top 30 genes from selected modules, in apical and intermediate progenitors, and excitatory neurons, by genotype. Differential expression between control (Fezf2 Het) and KO neurons, at the single cell level (two-sided Wilcoxon Rank Sum test, Bonferroni correction). e Gene ontology terms enriched in the Fezf2 KO-specific module. f Confusion matrix for random forest classifier calculated using 1,000 cells per cluster of the WT developmental atlas. The remaining held-out cells were used to test accuracy. g Classification of control (Fezf2 het) and Fezf2 KO excitatory neurons by the classifier presented in f, for P1 (left) or E15.5 (right) datasets. Cells are grouped according to their manually assigned identity based on the expression of marker genes. Box plots to the right show the corresponding classification scores where the middle line is the median, the lower and upper hinges correspond to the 25% and 75% quantiles, the upper whisker corresponds to the largest value no larger than 1.5×IQR from the hinge (where IQR is the inter-quartile range) and the lower whisker corresponds to the smallest value at most 1.5±IQR of the lower hinge. Lines in magenta, cyan, and green indicate 1, 0.5, and 0 values, respectively. Total number of cells: Fezf2 Het E15.5 = 6,092, Fezf2 KO E15.5 = 6,110, Fezf2 Het P1 = 5,101, Fezf2 KO P1 = 4,235.
Extended Data Figure 12 (related to Figure 5)
Extended Data Figure 12 (related to Figure 5). CFuPN acquire CThPN-like and layers 5&6 CPN-like identities in the absence of Fezf2
a-f Two subtypes of deep-layers KO cells were Identified at E15.5. Sub-clustering of deep-layers KO-exclusive cells alone at E15.5 (a) shows a Satb2LOW, Bcl11bHIGH cluster (cluster 0), and a Satb2HIGH cluster expressing also CPN markers Cux1 and Pou3f2 (cluster 1), as indicated in the violin plots (b). Differential expression analysis between both subtypes indicates enrichment of CFuPN genes in cluster 0 and CPN genes in cluster 1 (c). d Comparison to neurons in E15.5 wild-type data showing overlap between differentially expressed genes and markers from E15.5 neuronal subtypes. Bars indicate number of overlapping genes and are colored by the adjusted p-value calculated by hypergeometric test for significant enrichment. e Classification of cells from both E15.5 KO-specific clusters according to random forest classifier shows good agreement between both annotations. f NMF module expression (as in Fig. 5b) in the KO-specific cells, grouped according to the cell type assigned by the random forest classifier. g-i Sub-clustering (g) and differential expression analysis (h) of deep-layers KO-exclusive cells alone at P1 reveals two subpopulations that correspond to CThPN-like and layers 5&6 CPN-like populations. i Classification of cells from both P1 KO-specific clusters according to random forest classifier shows good agreement between both annotations. j-k Differential expression analysis of the aberrant layer 5&6 CPN-like cells from the KO-exclusive populations at P1 compared to layers 5&6 CPN (j) or SCPN (k) populations in the control. l-m In situ hybridization against Bcl11b and Lpl (a) or Ptn (b), in P1 control (wild type) and Fezf2 KO coronal sections, showing higher levels of expression of Lpl and Ptn on layers 5 and 6 and reduced Bcl11b in layer 5 (insets to the right correspond to boxes in left panels). Note cells expressing both Bcl11b and Lpl in magnification from layer 6, reflecting an aberrant CThPN identity. Number of positive speckles per 104 μm2. Quantification was calculated with a modified pipeline from CellProfiler from an area of ~200 by 150 μm or ~200 by 100 μm centered in layers 6 or 5, respectively. Data correspond to mean±sem, from n = 3 mice, > 3 sections each. Unpaired t test, exact p-values indicated. Scale bars are 30 μm, except in higher magnification in l, 15 μm. n Violin plots of number of genes (left) and mRNA molecules (counts; middle), and percentage of mitochondrial counts (right) per cell in control and KO Fezf2 E13.5 single cell transcriptomes, and UMAP visualizations of combined control and KO complete data sets, colored by genotype or assigned cell type. o Dorsally-derived cells in Fezf2 control and KO E13.5 scRNA-seq, visualized via UMAP and colored by genotype (left) or cell types (right). Proportion of cells in each cell type, according to their genotype. p Differential expression analysis between control and KO migrating or immature neurons shows upregulation of a subset of CPN marker genes and downregulation of CFuPN-specific genes.
Figure 1
Figure 1. Comprehensive atlas of murine cortical development
a Cellular diversity and development of the neocortex. b UMAP visualization of scRNA-seq data from Individual time points. Cells are colored by cell type assignement. c Normalized contribution of each time point to each cell type present in the developing cortex. See also Extended Data Fig. 1. d Combined time points visualized by age (left), or cell types (right), legend in c. VZ: ventricular zone, SVZ: subventricular zone, CP: cortical plate, CR: Cajal-Retzius cells, AP: apical progenitors, IP: intermediate progenitors, CThPN: corticothalamic projection neurons, SCPN: subcerebal projection neurons, CPN: callosal projection neurons.
Figure 2.
Figure 2.. Spatial distribution of cell types in the developing cortex.
a Mapping probability of the main cell types from scRNA-seq onto a matching Slide-seq tissue section using Tangram (right). Left: whole puck with beads colored based on clustering. The area used for the mappings is highlighted. Colored bars represent cell type distribution. Dv, dorso-ventral; ml, medio-lateral. b Re-clustering of sub-states of E15.5 migrating excitatory neurons. Mapping of sub-states onto E15.5 tissue indicates differential positioning across the radial axis of the cortex. DAPI staining of adjacent section for reference. Expression of genes associated with migrating neuron sub-states in E15.5 Slide-seq.
Figure 3.
Figure 3.. Molecular developmental trajectories of neocortical cell types.
a URD branching tree. Root is E10.5 earliest progenitors, tips are P4 terminal cell types. Cells colored by their identity. b Smoothened heatmap of gene cascades for layers 2&3 CPN and SCPN. Gene expression in each row is scaled to maximum observed expression, and smoothened. Genes are ordered based on their onset and peak expression timings. Some marker genes are labeled. The cascade is divided into three segments: shared trajectory, layer 2&3 CPN-specific and SCPN-specific trajectories. Full cascades in Extended Data Fig. 7 and Supplementary Information Table 3. c Gene programs of connected modules found by NMF. Left: circular nodes represent modules aligned by the age they were computed from. Right: scaled expression of lineage specific modules on the branching tree. d Genes predicted to be involved in cell type divergence. Top 10 transcription factors per branch, ranked by their feature importance score for ability to distinguish between branches (Friedman MSE score, 0.5 power transformed, dot size), and their average expression in the corresponding cells (row-scaled, color). Color bar at the top indicates branch-points.
Figure 4.
Figure 4.. scATAC-seq landscape of the developing neocortex.
a UMAP visualization of the scATAC-seq data for each time point. Cells are colored by the cell types predicted from integration with scRNA-seq datasets (top), and modality (bottom). b-c URD chromatin accessibility trajectories. Root is E13.5 progenitors, tips are E18.5 final cell types (with identity-prediction score > 70%). Cells are colored by their predicted identity (b) or accessibility of marker genes (c). d Transcription factor (TF) motifs enriched along the ATAC tree (e). Dot size shows fold enrichment, and color is average RNA expression in nearest cells in the integrated RNA and ATAC data. Motif enrichment was calculated for sequential segments of the tree, plot separation indicates the second branch-point (top). Only genes with detected expression in the corresponding scRNA-seq cells are shown. Motif enrichment for the tree tips in bottom panel. e Accessible elements change through time. Dynamic elements that show differential accessibility across cell types were clustered within each time point (indicated with letters, insets show scaled accessibility) and connected through time. 62-85% of the common elements per cluster retained a similar pattern between E13.5 and E18.5. AP: apical progenitors, IP: intermediate progenitors, MN: migrating neurons, IN: immature neurons.
Figure 5
Figure 5. Fezf2 prevents acquisition of callosal identity in CFuPN
a Gene programs of connected modules (as in Fig. 3c), colored by Fezf2 score. b Expression of affected modules in Fezf2 KO E15.5 cortex. Average expression of the top 30 genes of the SCPN and CThPN modules, in AP, IP and excitatory neurons (N), by genotype. Differential expression between control (Het) and KO neurons (two-sided Wilcoxon Rank Sum test, Bonferroni correction). c-d UMAP visualization of scRNA-seq from E15.5 control and KO cortices, by genotype (left) and cell type (right). Proportion of cell types by genotype (bottom). e A classifier trained on the wild-type atlas, mostly assigned KO-specific clusters (red in UMAP insets) to CThPN and layer 5&6 CPN.

References

    1. Lodato S & Arlotta P Generating neuronal diversity in the mammalian cerebral cortex. Annu Rev Cell Dev Biol 31, 699–720, doi:10.1146/annurev-cellbio-100814-125353 (2015). - DOI - PMC - PubMed
    1. Greig LC, Woodworth MB, Galazo MJ, Padmanabhan H & Macklis JD Molecular logic of neocortical projection neuron specification, development and diversity. Nat Rev Neurosci 14, 755–769, doi:10.1038/nrn3586 (2013). - DOI - PMC - PubMed
    1. Yuzwa SA et al. Developmental Emergence of Adult Neural Stem Cells as Revealed by Single-Cell Transcriptional Profiling. Cell Rep 21, 3970–3986, doi:10.1016/j.celrep.2017.12.017 (2017). - DOI - PubMed
    1. Frazer S et al. Transcriptomic and anatomic parcellation of 5-HT3AR expressing cortical interneuron subtypes revealed by single-cell RNA sequencing. Nat Commun 8, 14219, doi:10.1038/ncomms14219 (2017). - DOI - PMC - PubMed
    1. Mayer C et al. Developmental diversification of cortical inhibitory interneurons. Nature 555, 457–462, doi:10.1038/nature25999 (2018). - DOI - PMC - PubMed

Publication types