Clinical Trial
. 2021 Jul;595(7865):91-95.
doi: 10.1038/s41586-021-03671-4. Epub 2021 Jun 23.

Evaluating microbiome-directed fibre snacks in gnotobiotic mice and humans

Affiliations
Clinical Trial

Evaluating microbiome-directed fibre snacks in gnotobiotic mice and humans

Omar Delannoy-Bruno et al. Nature. 2021 Jul.

Abstract

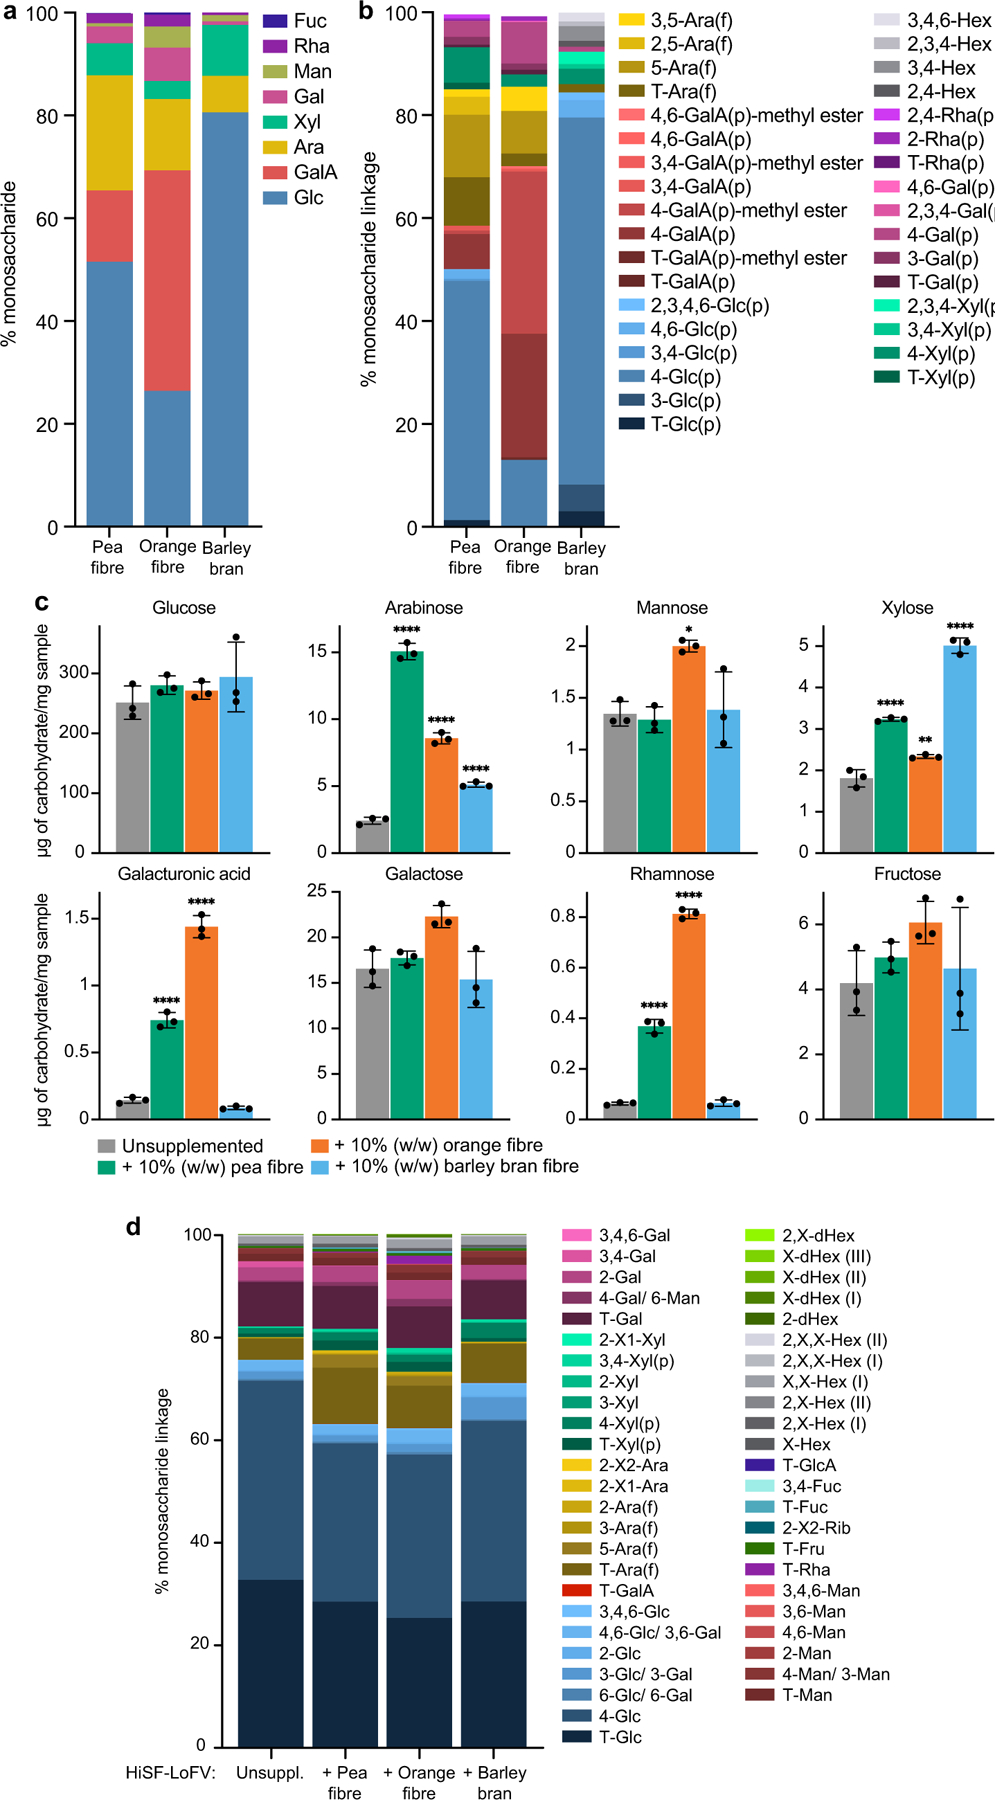
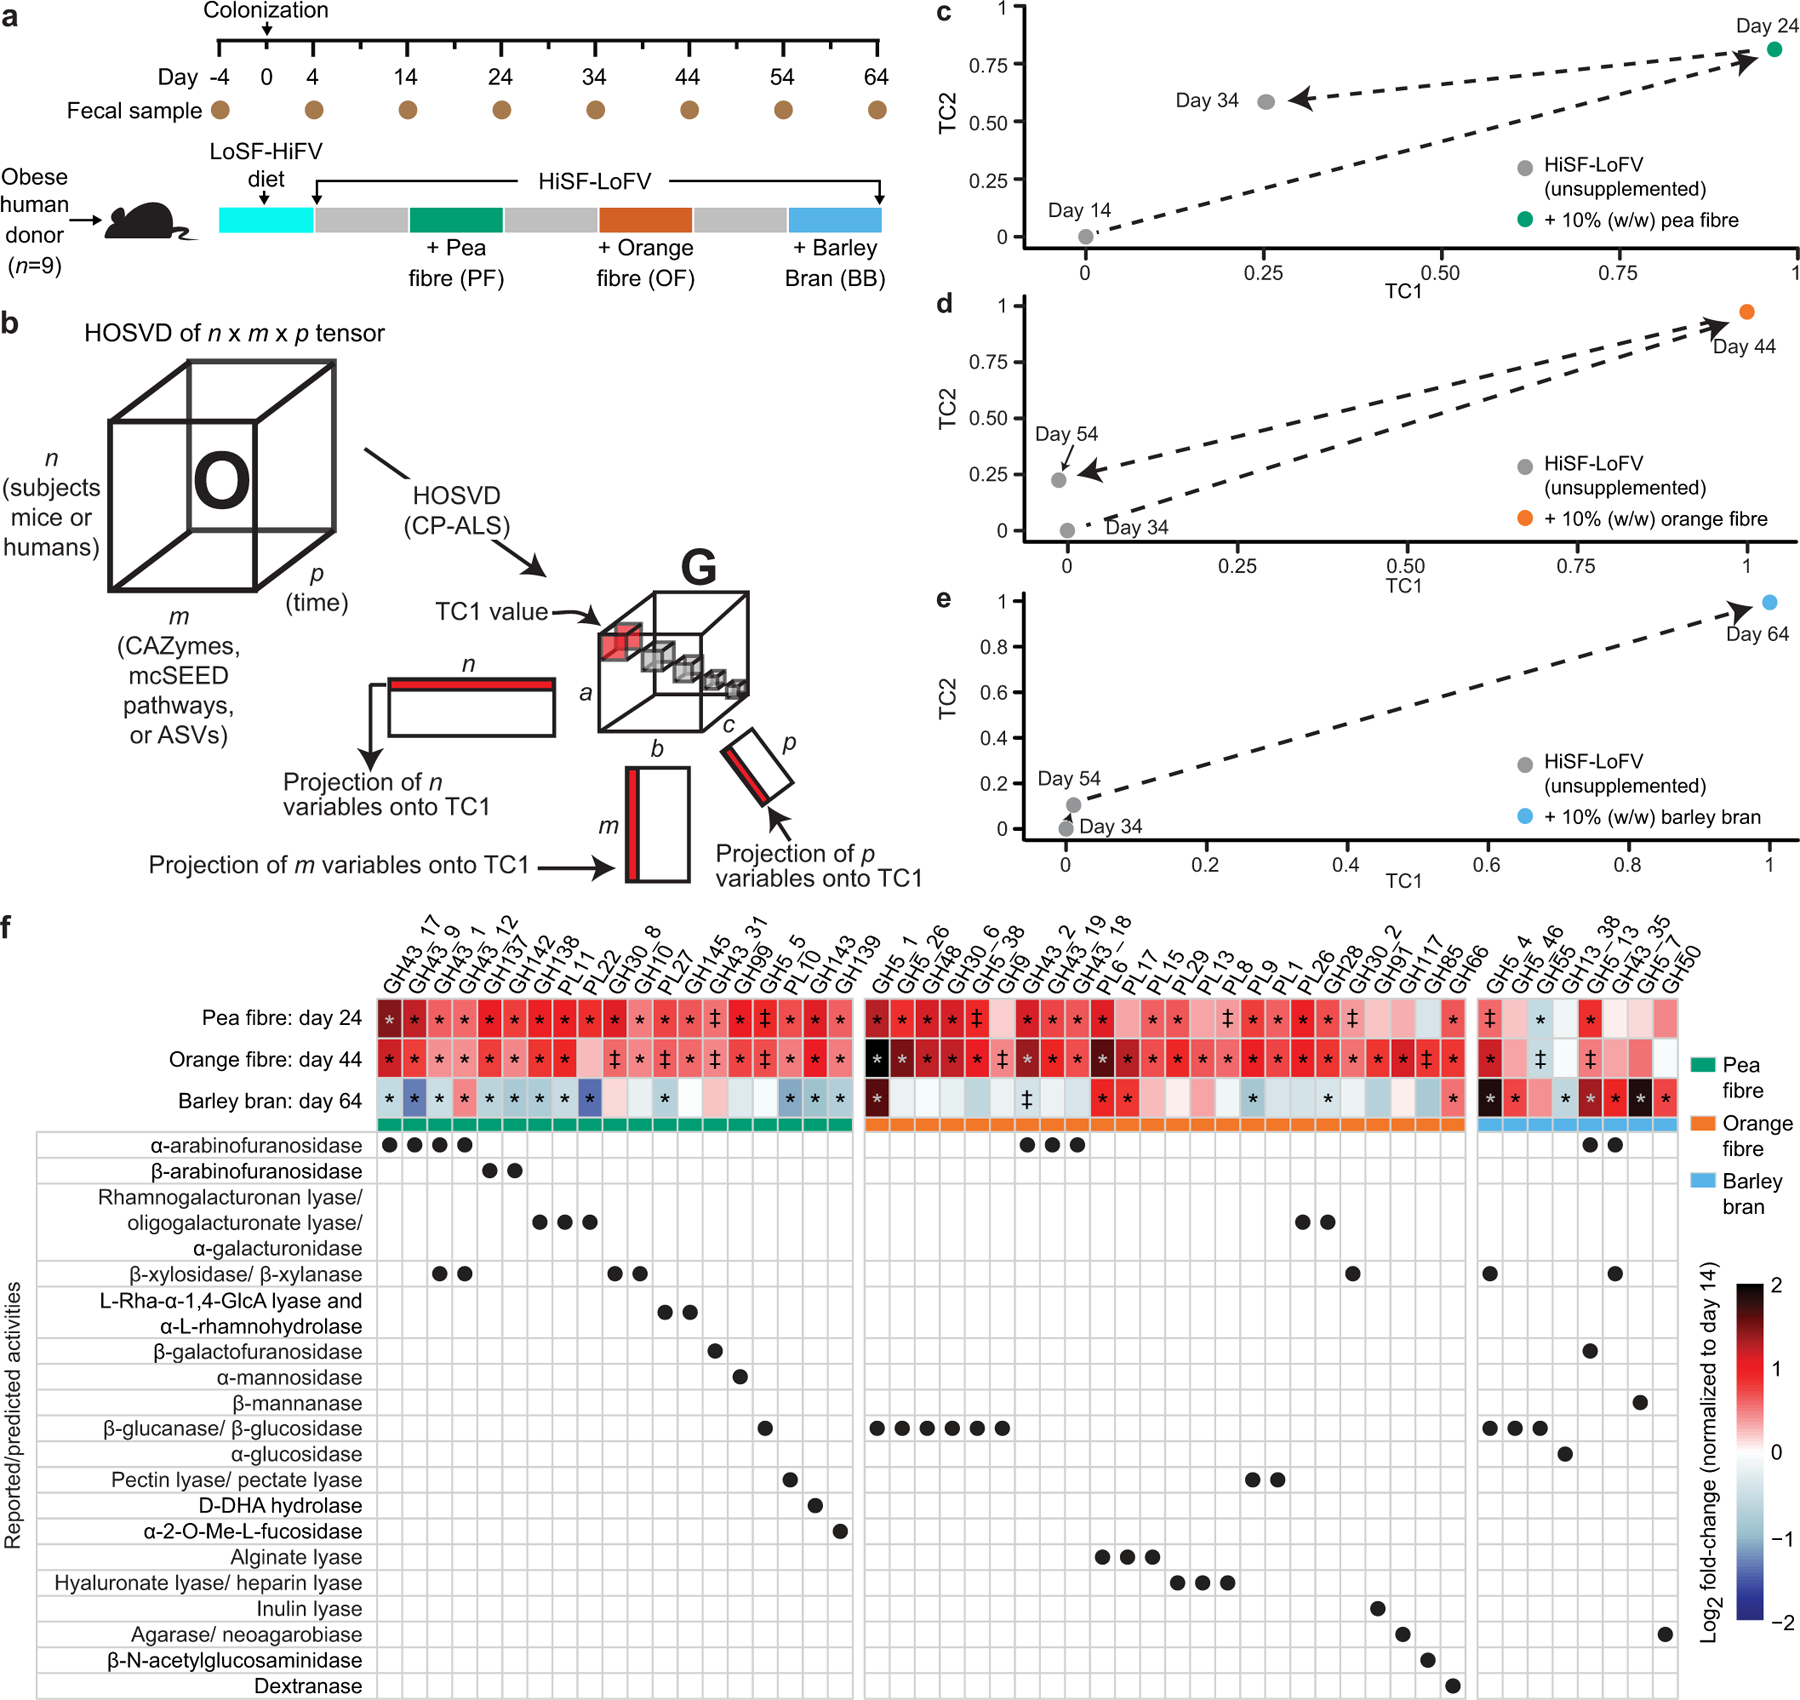
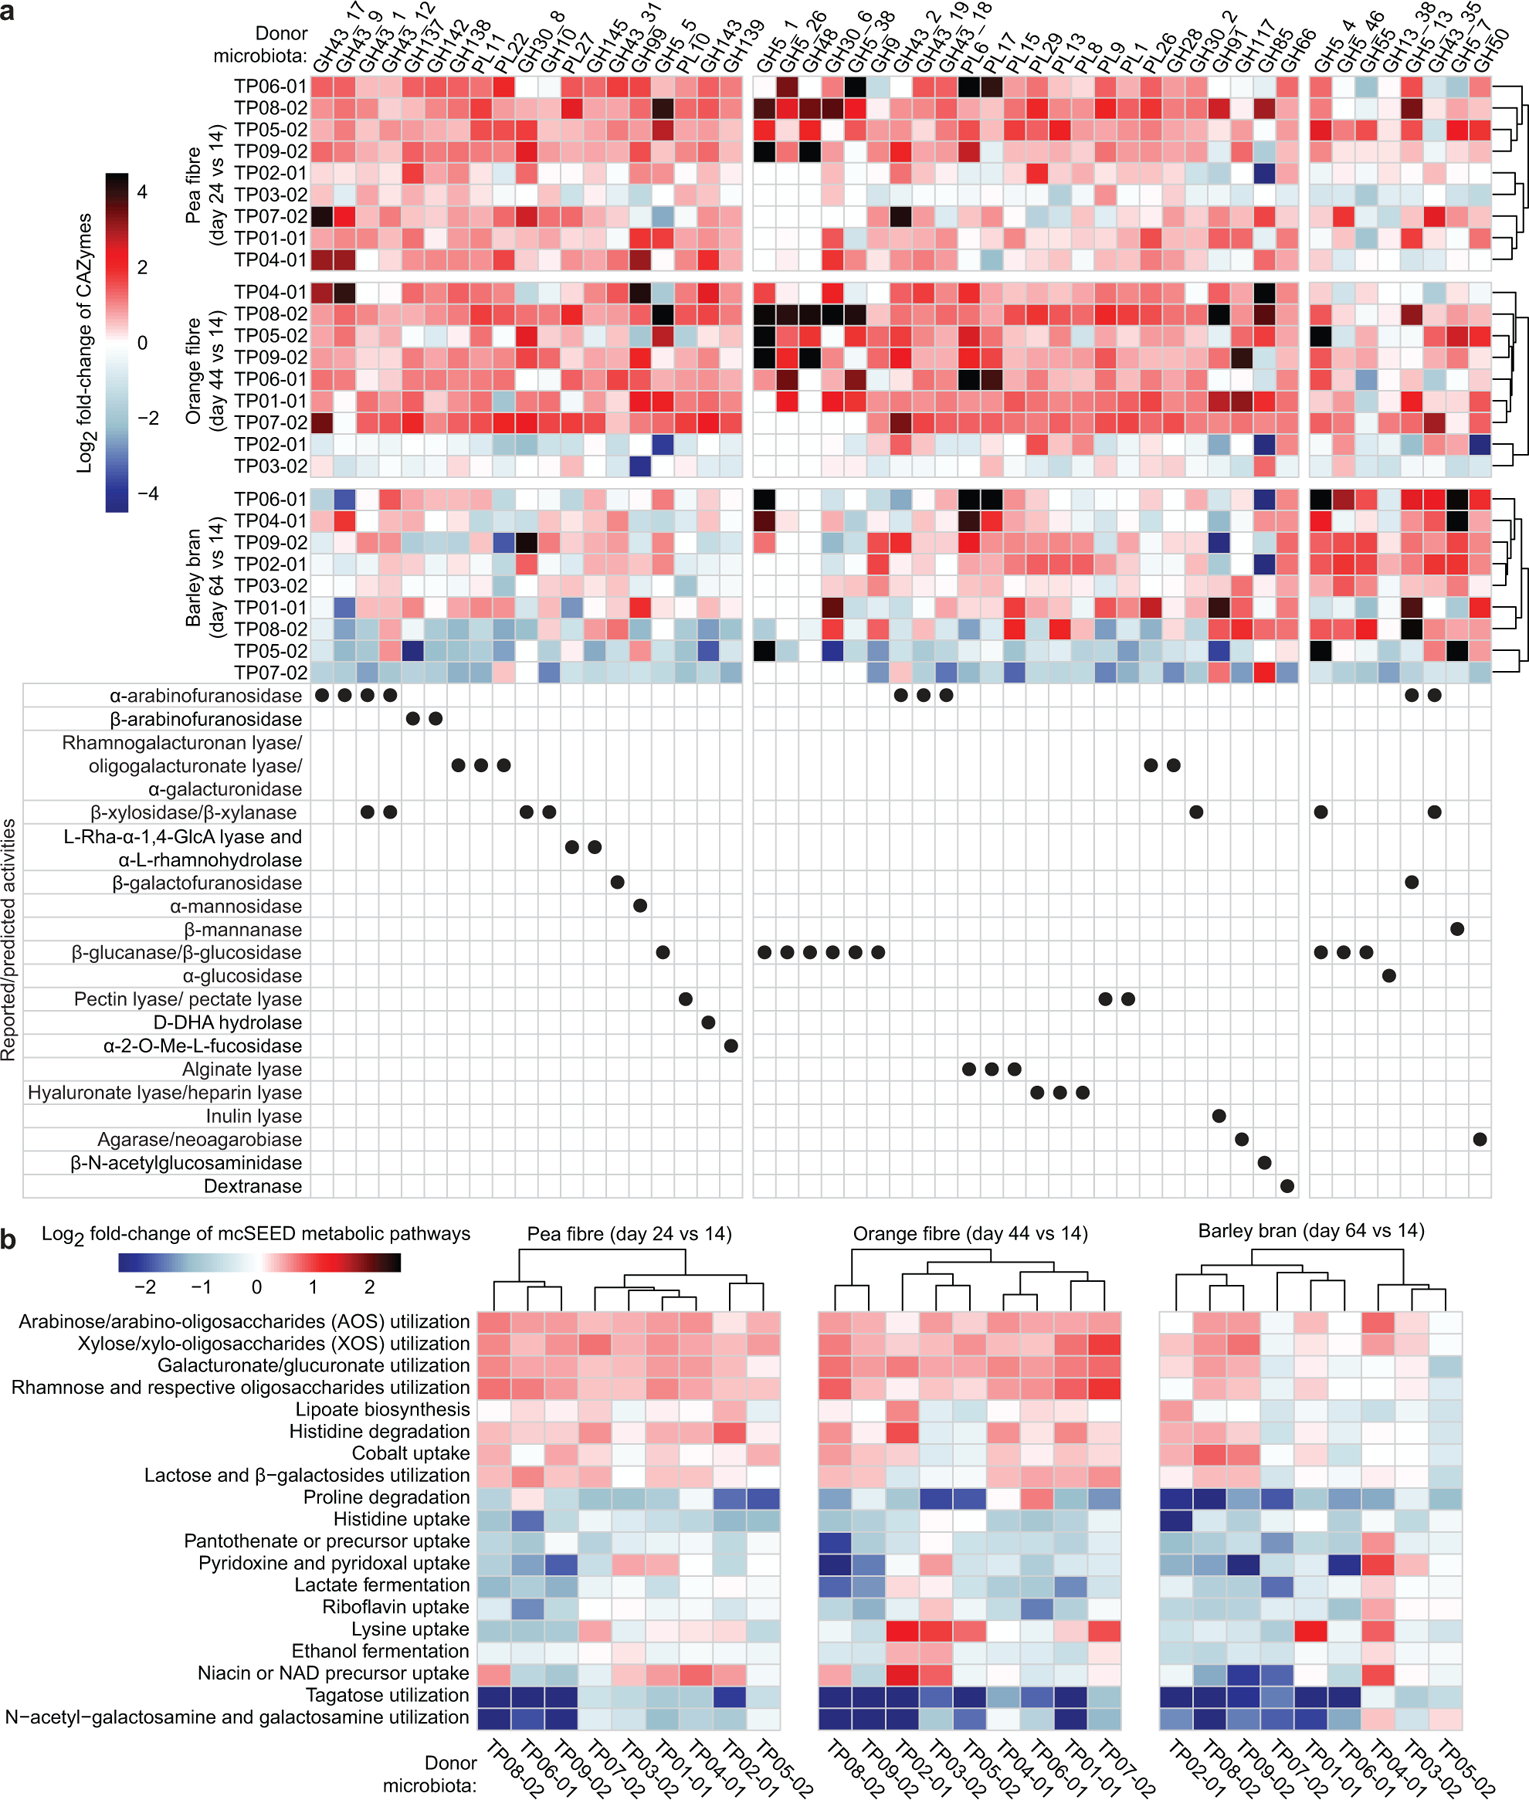
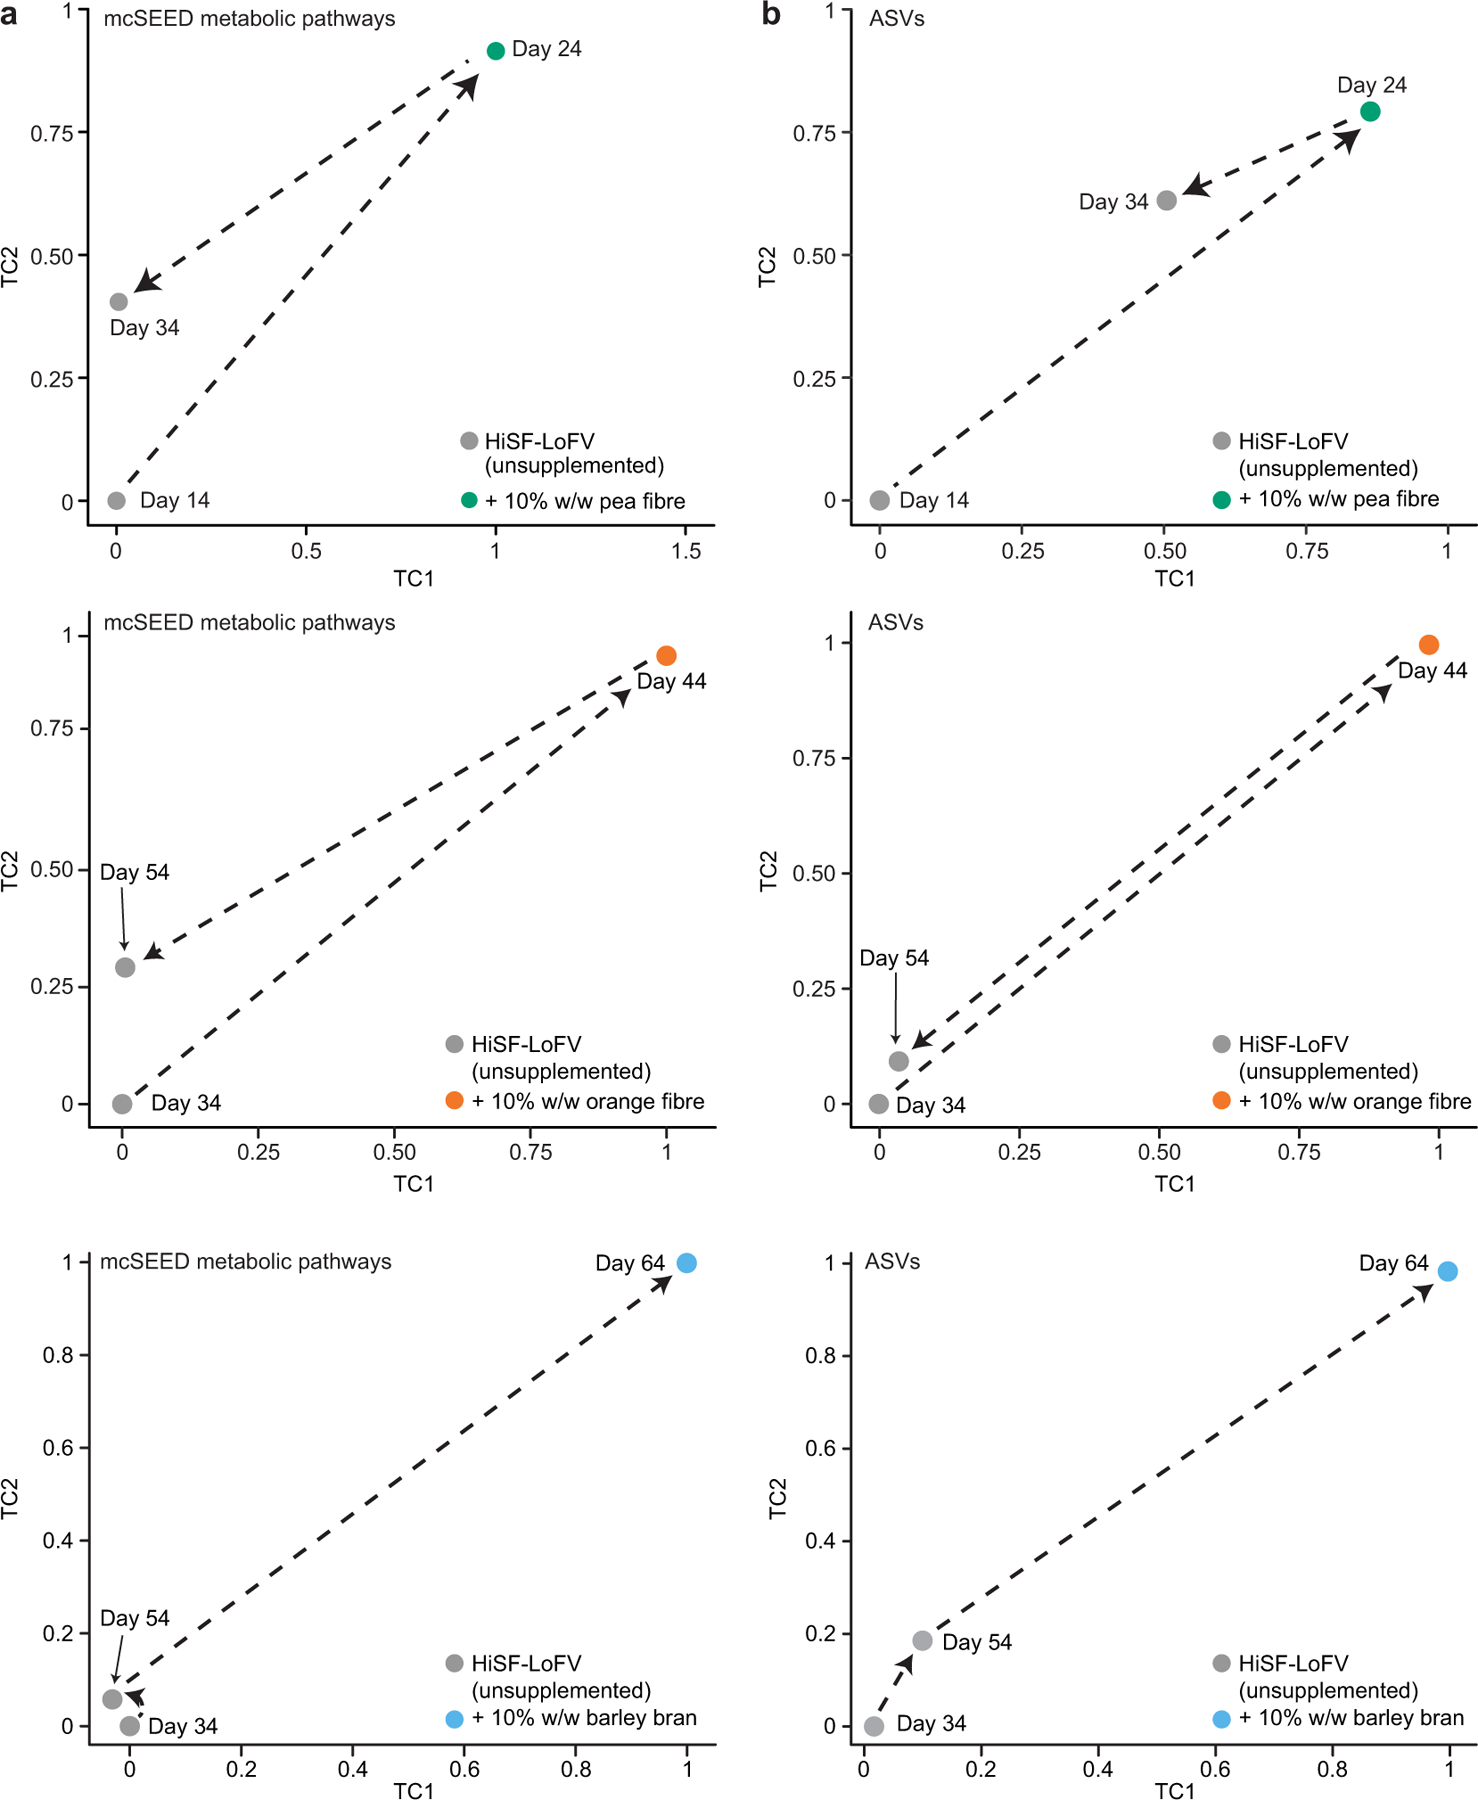
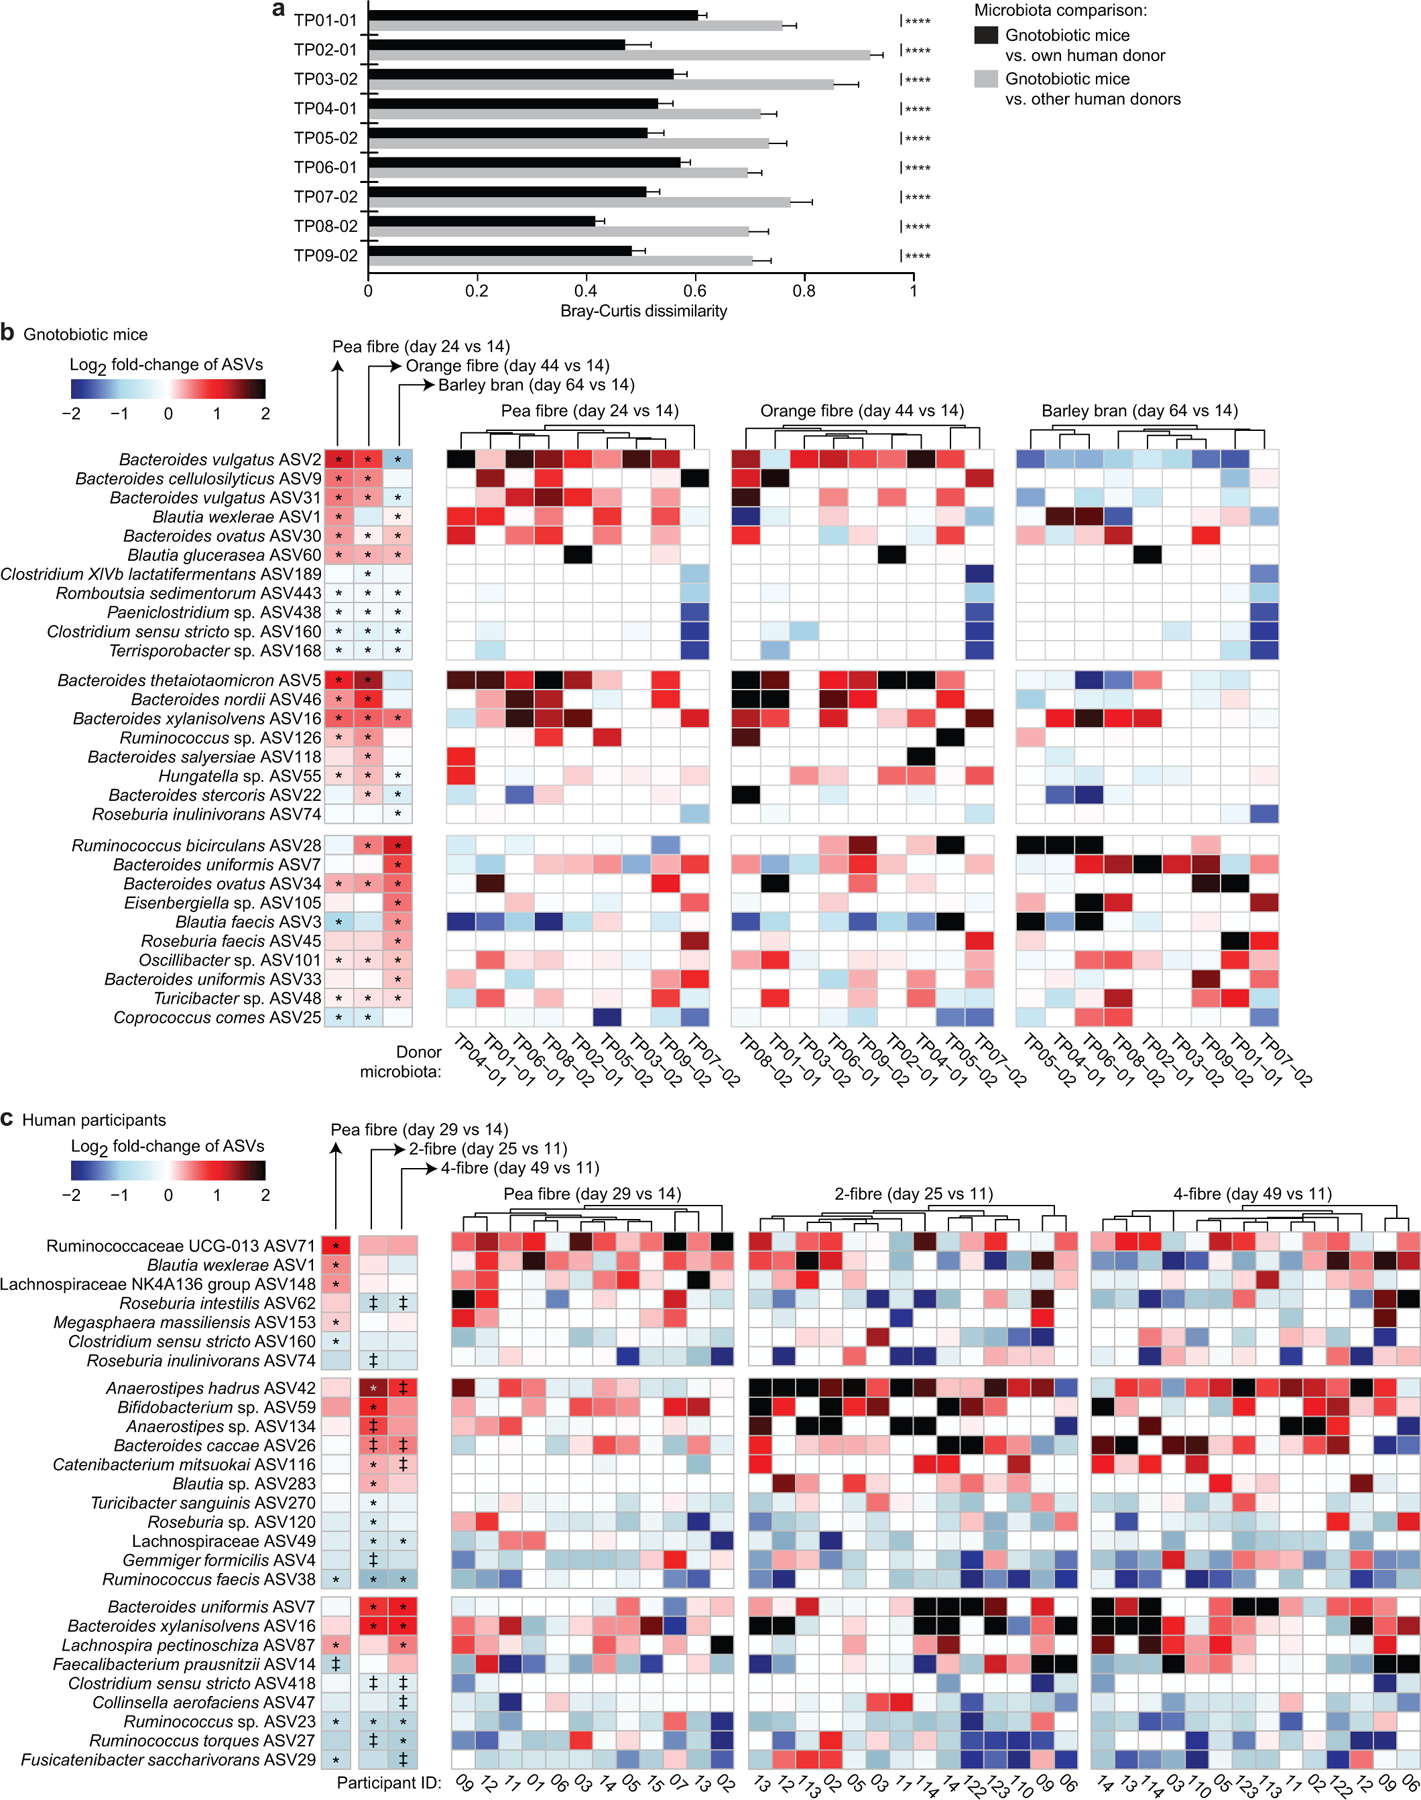
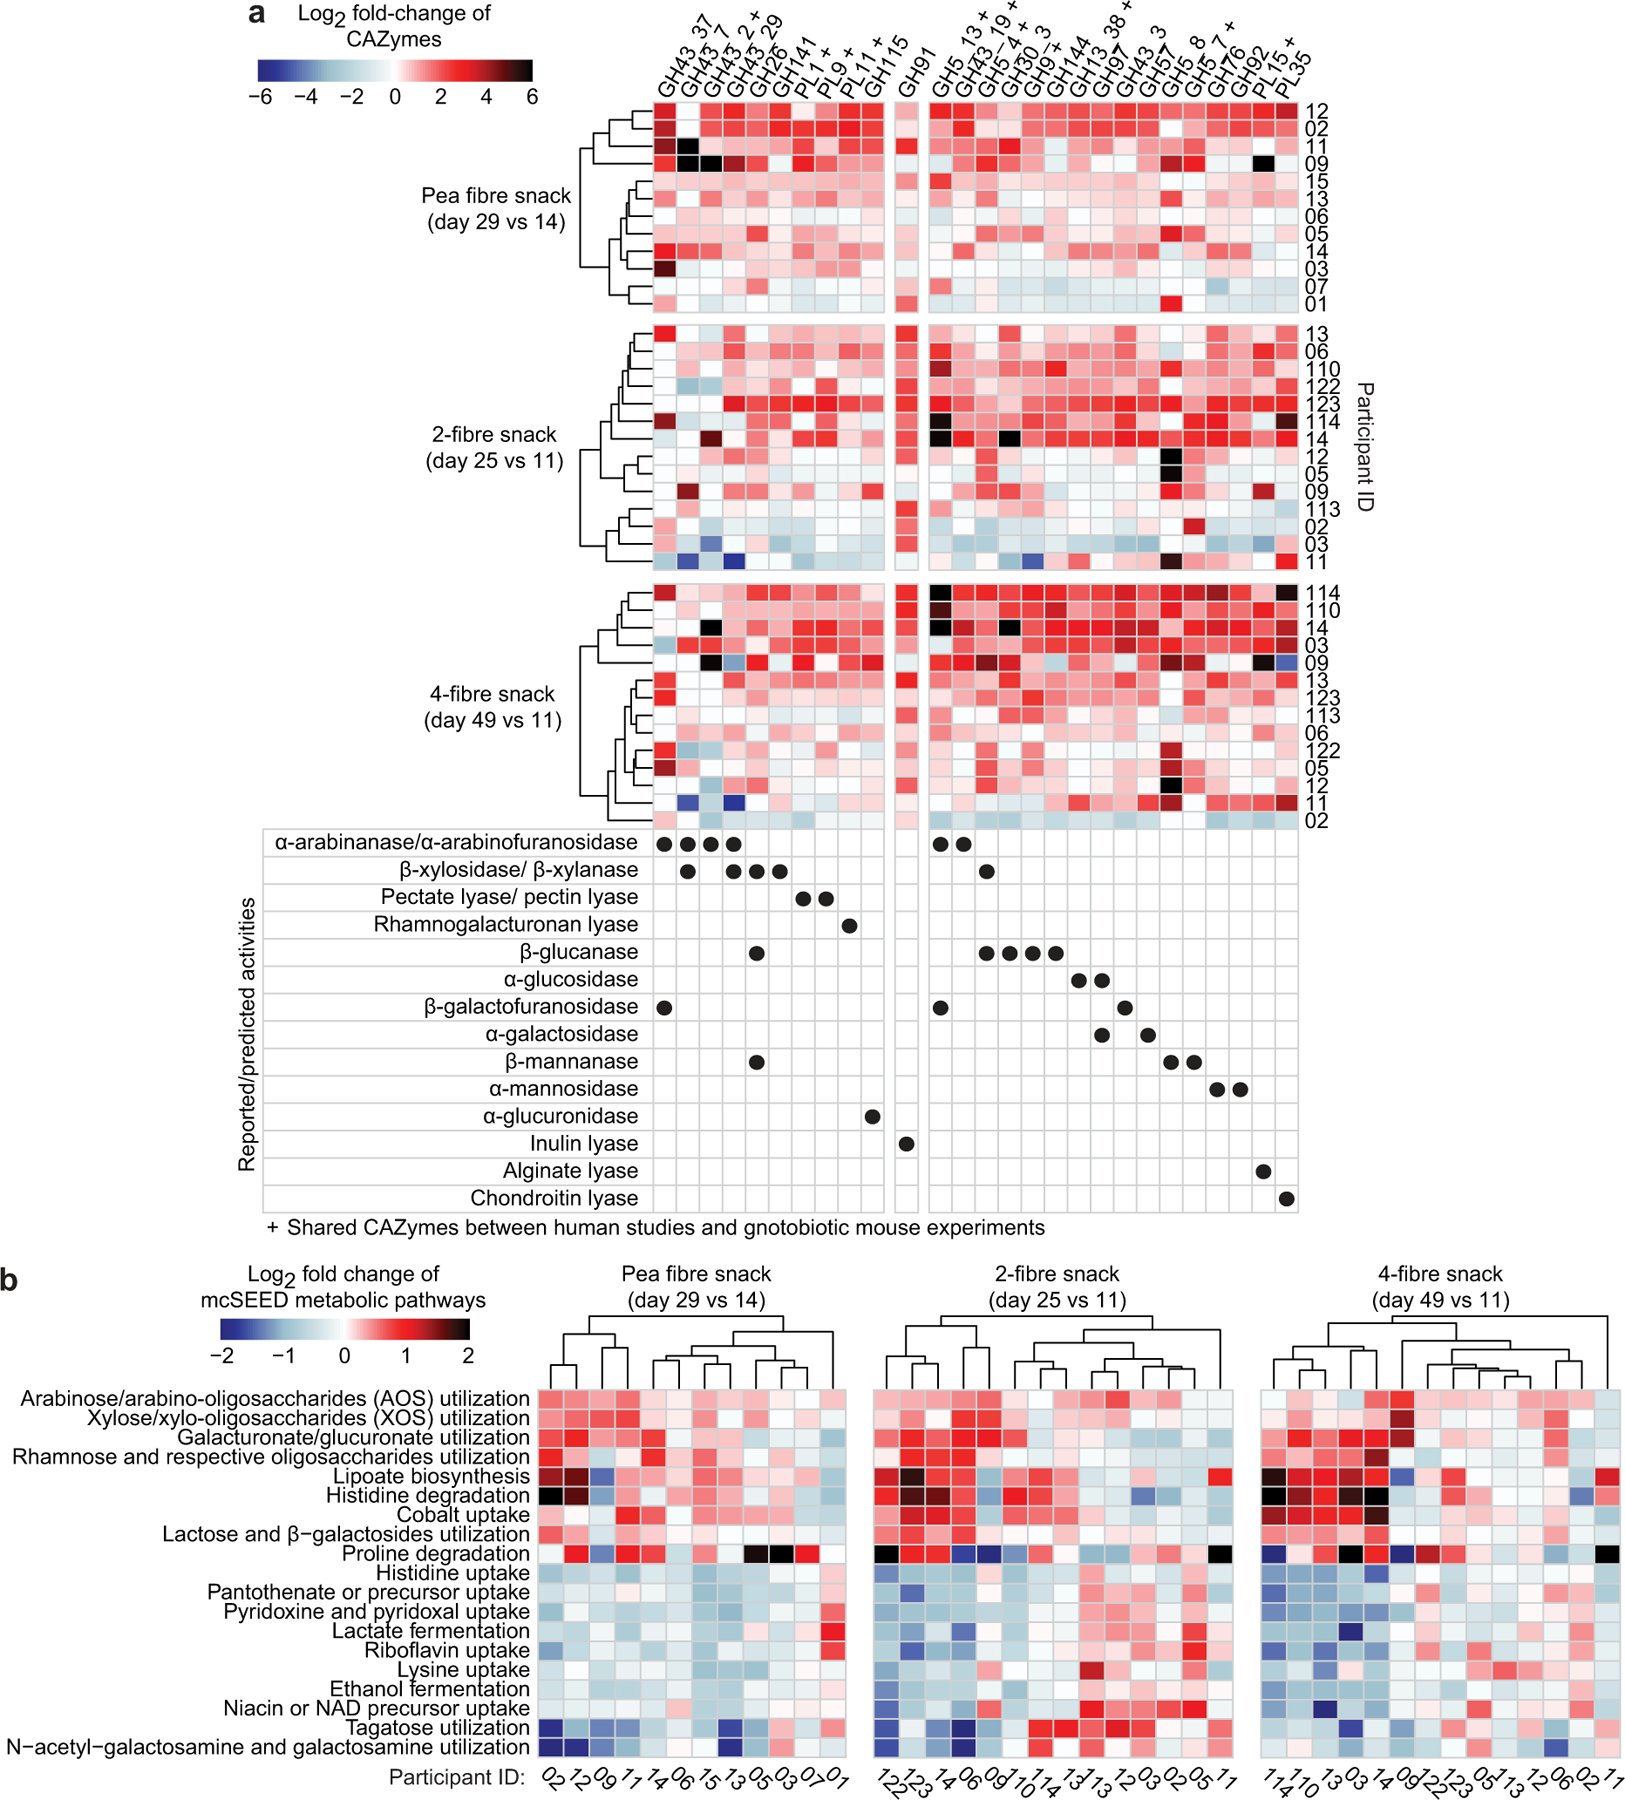
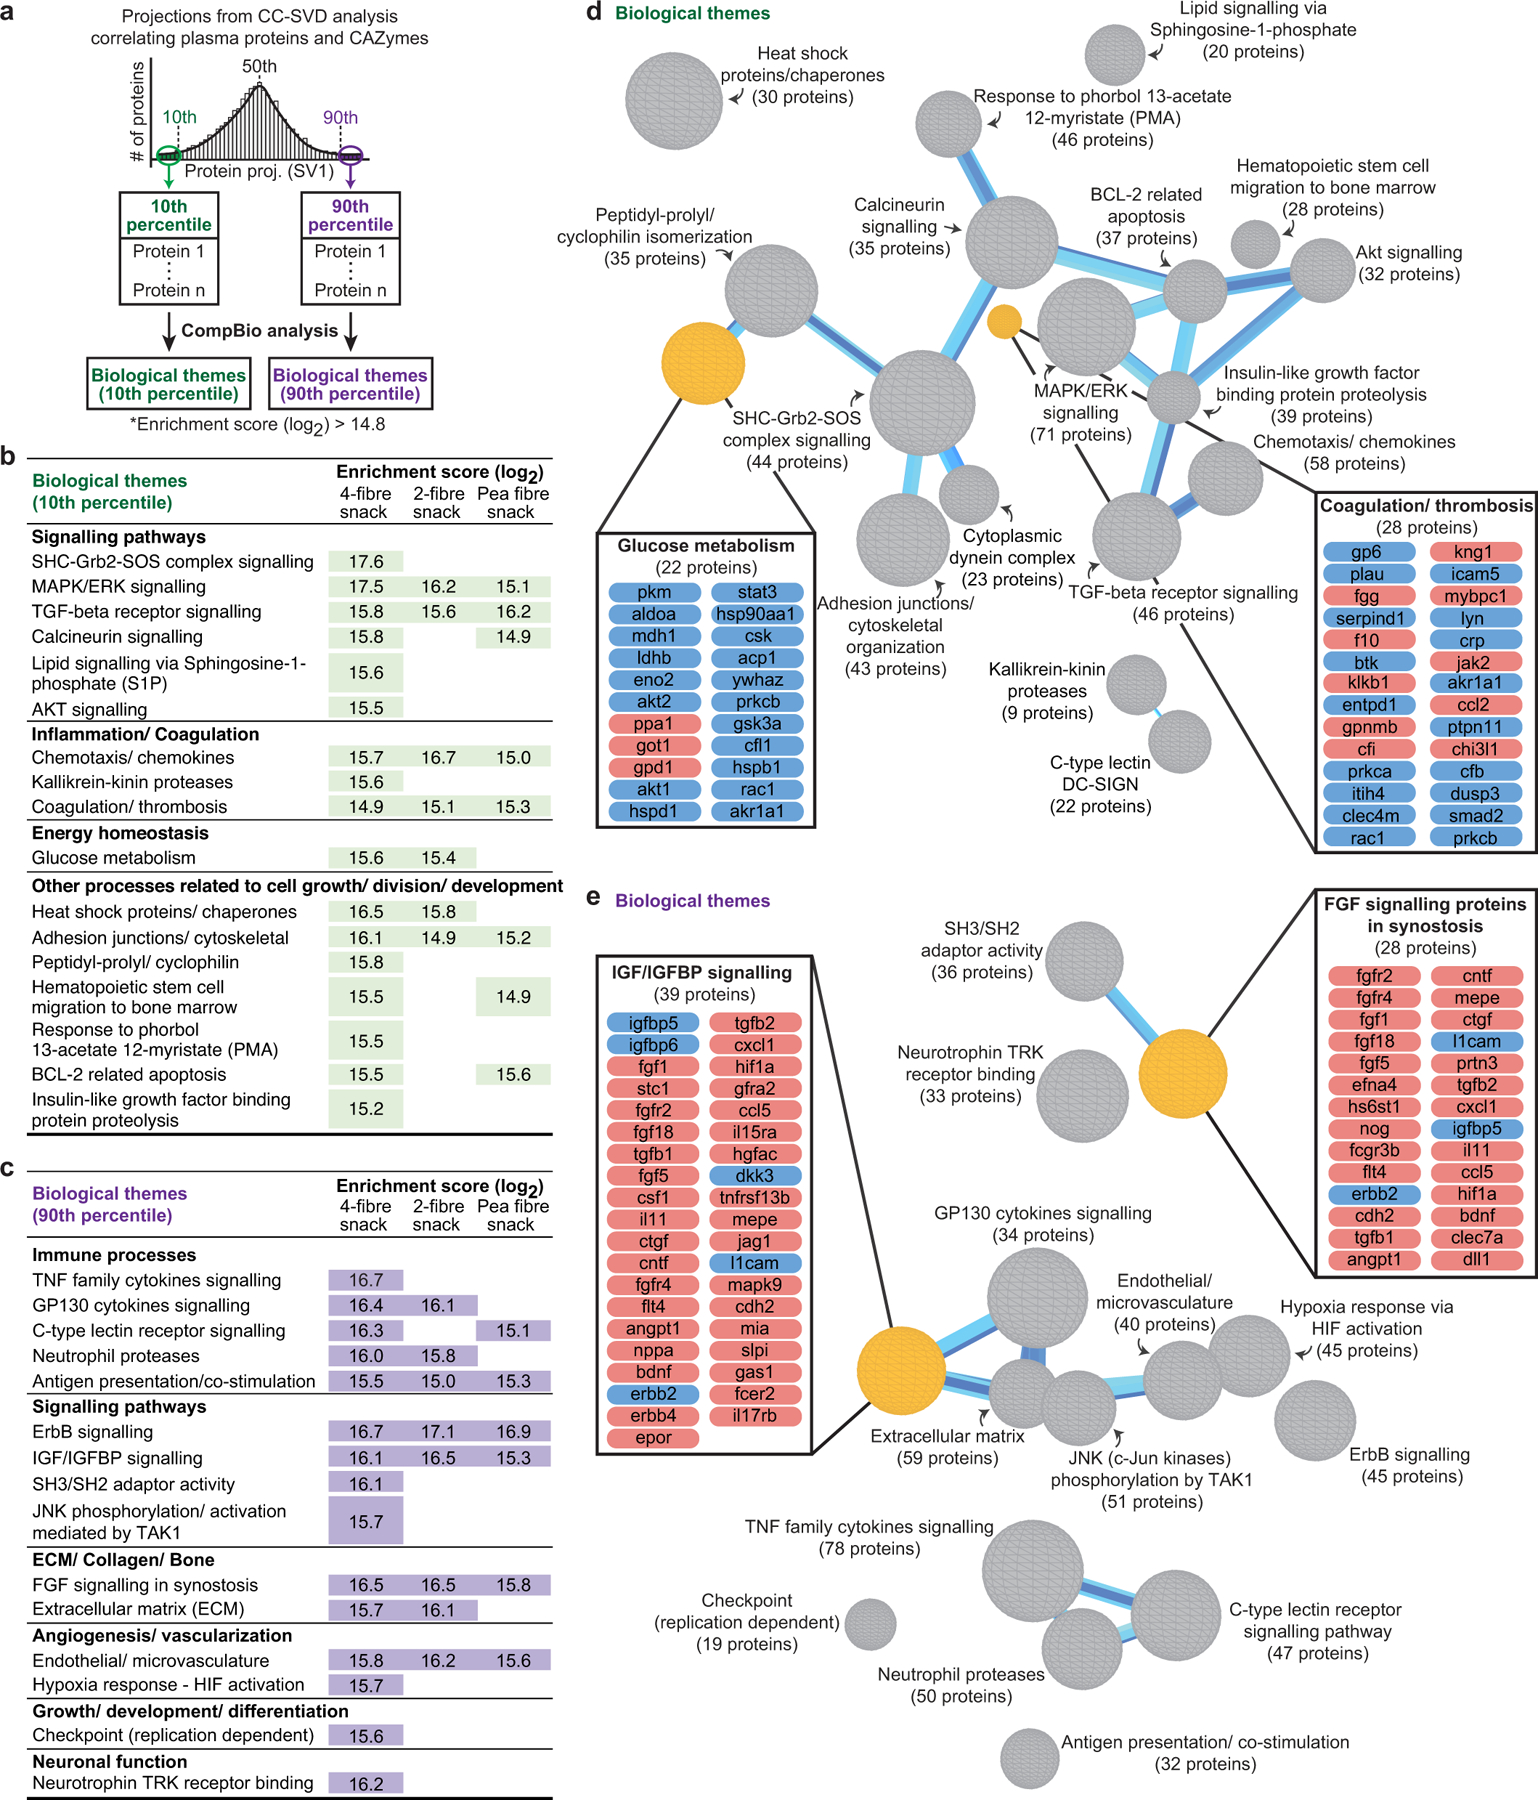
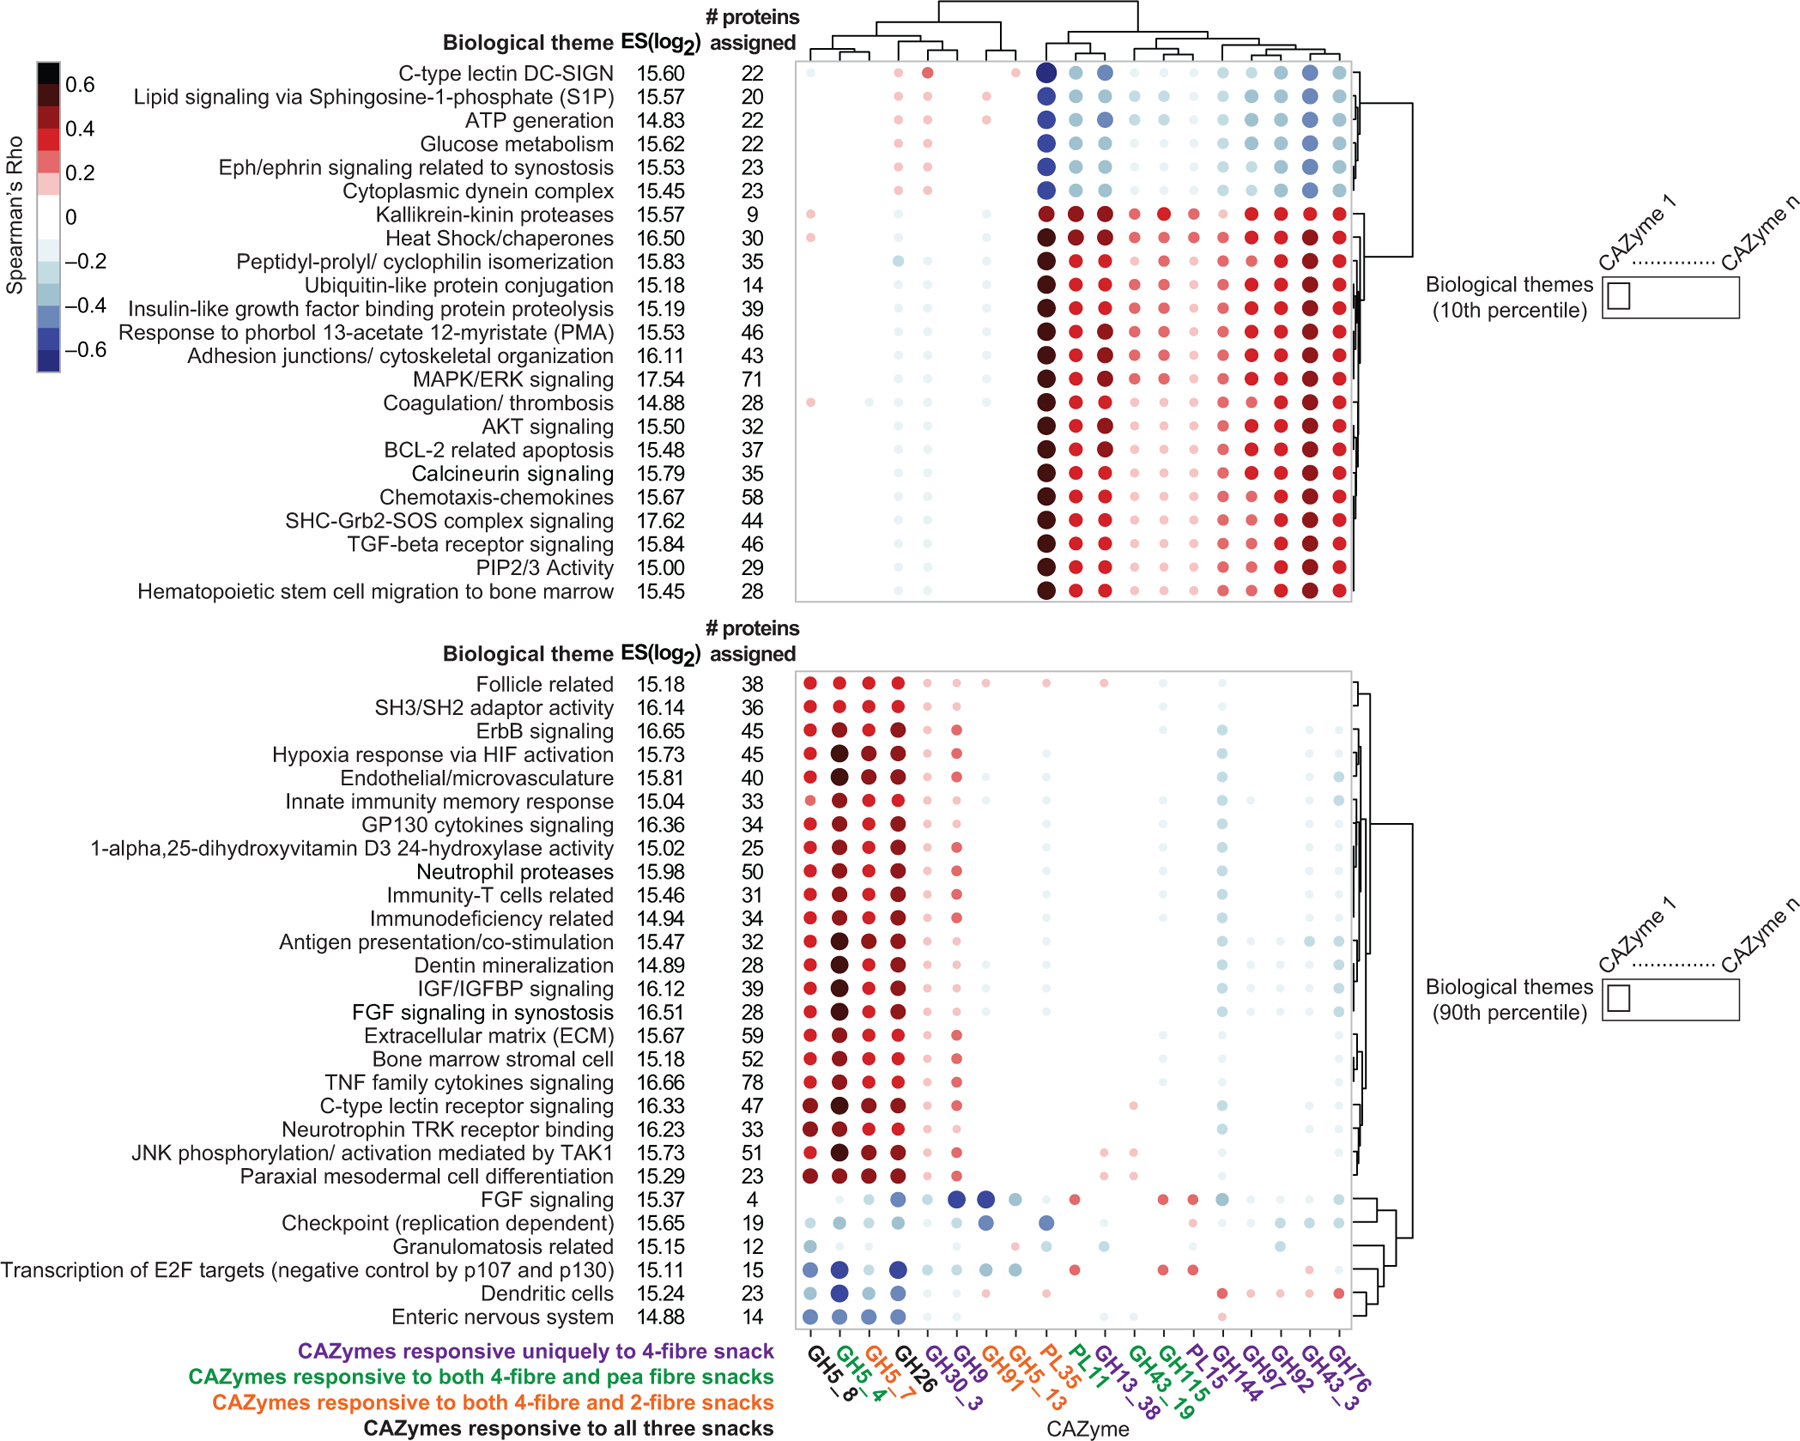
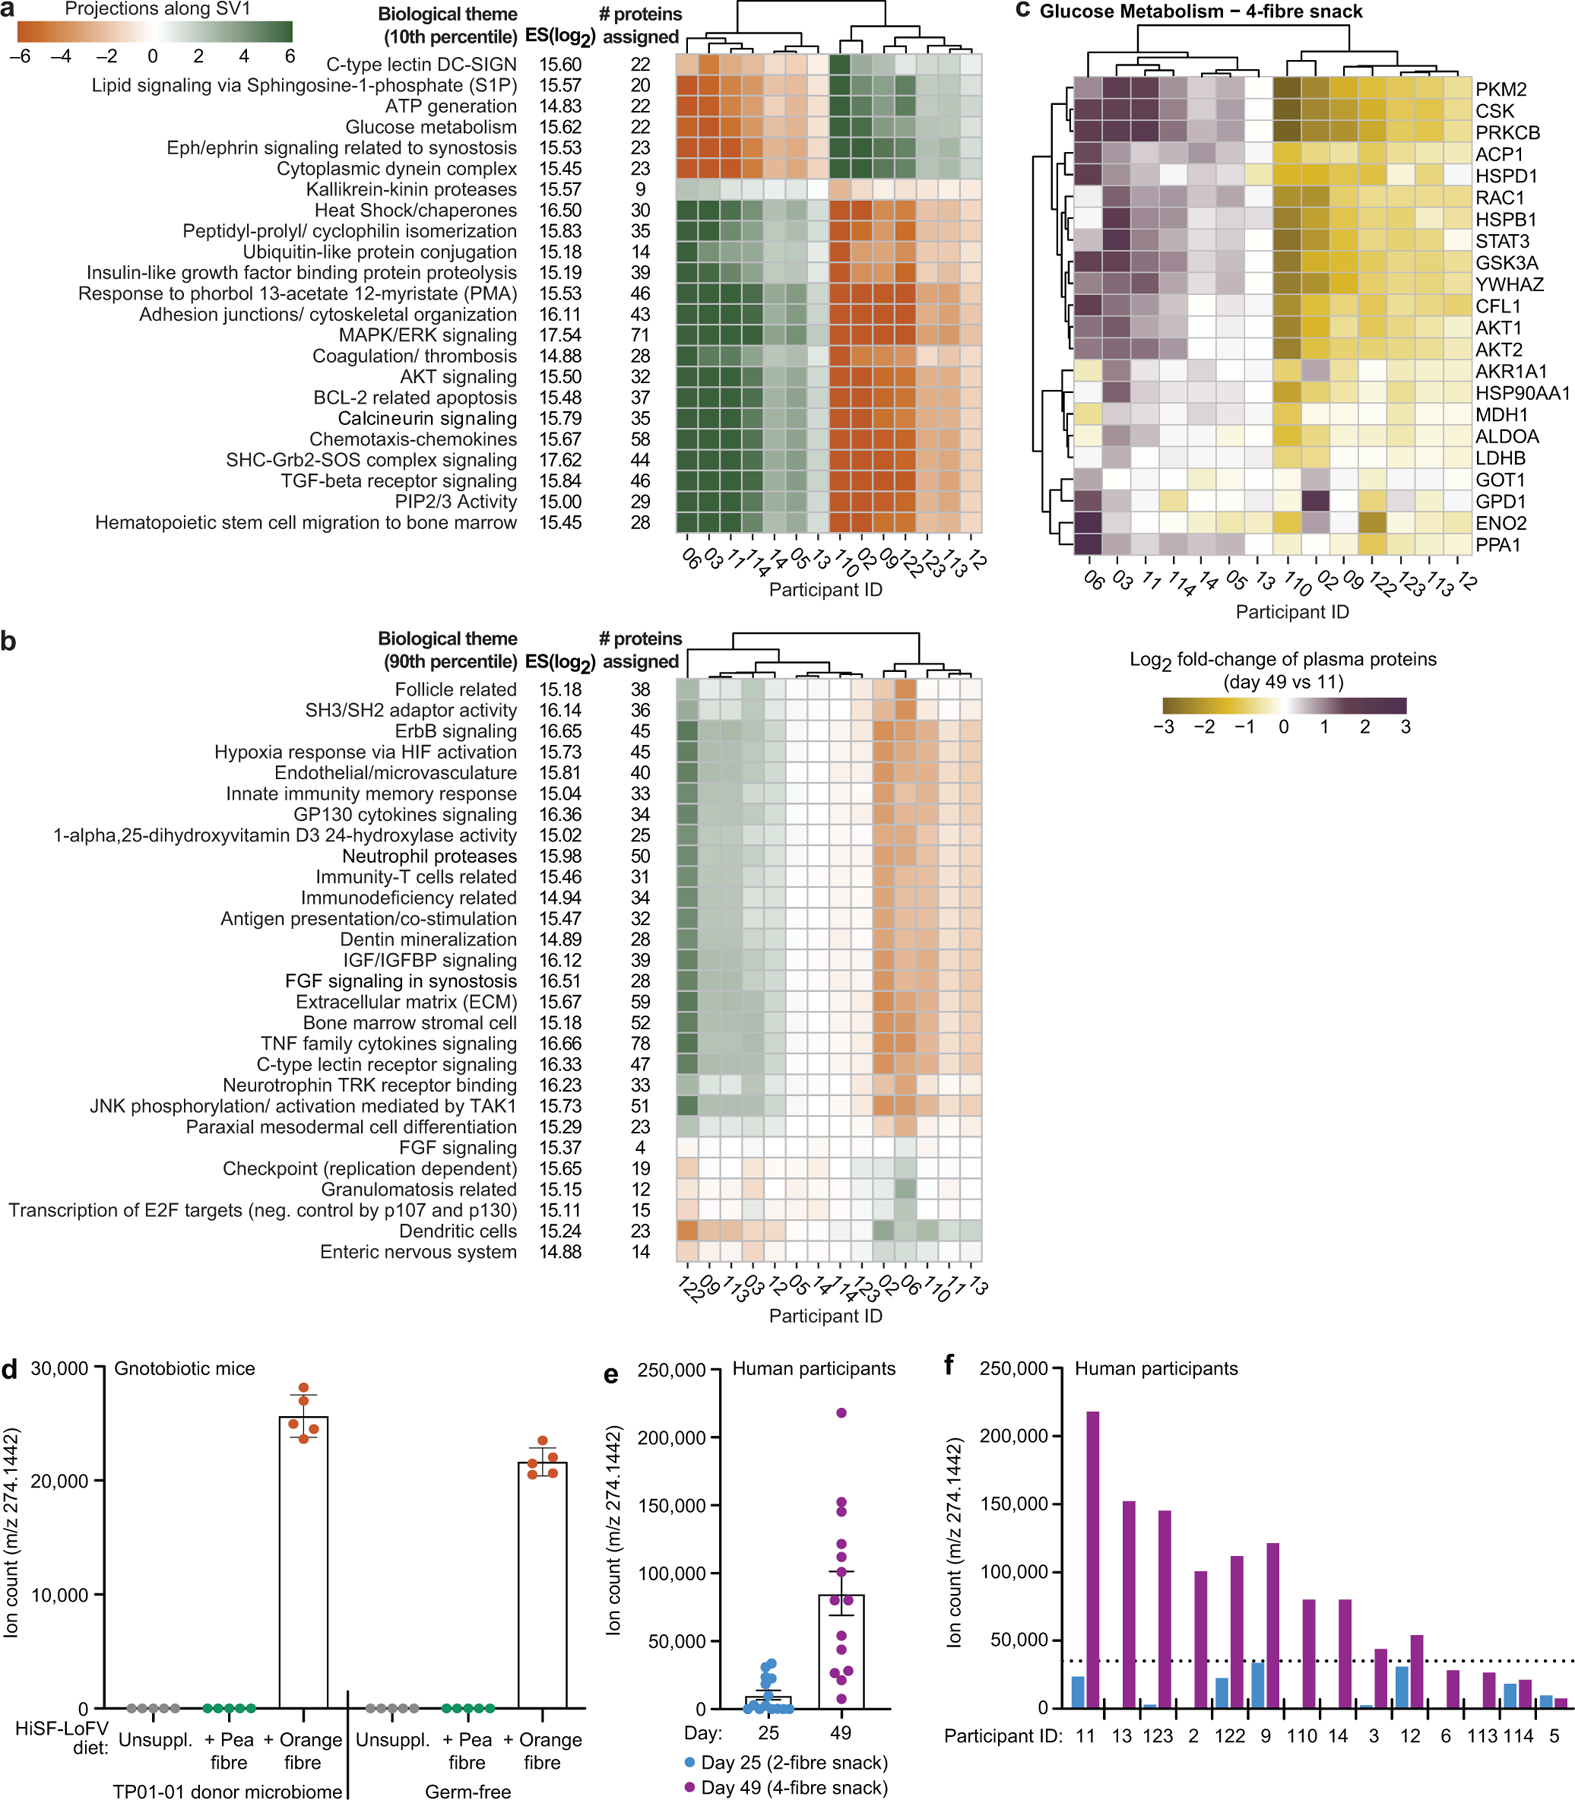
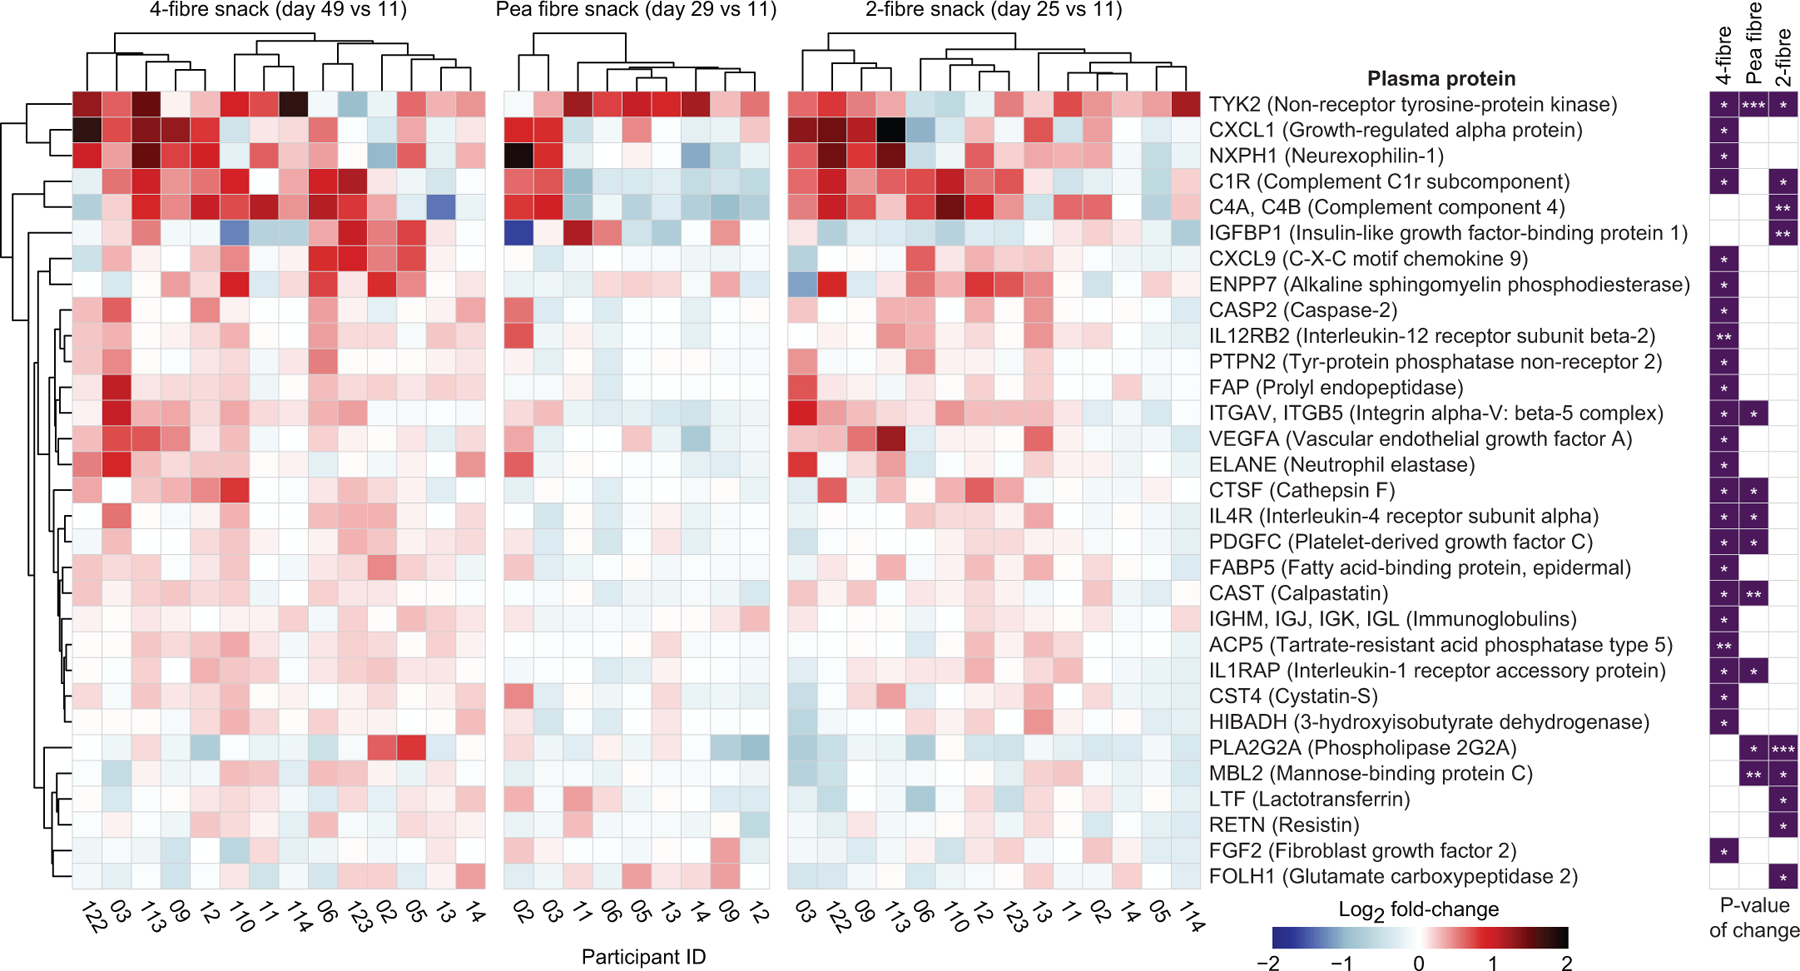
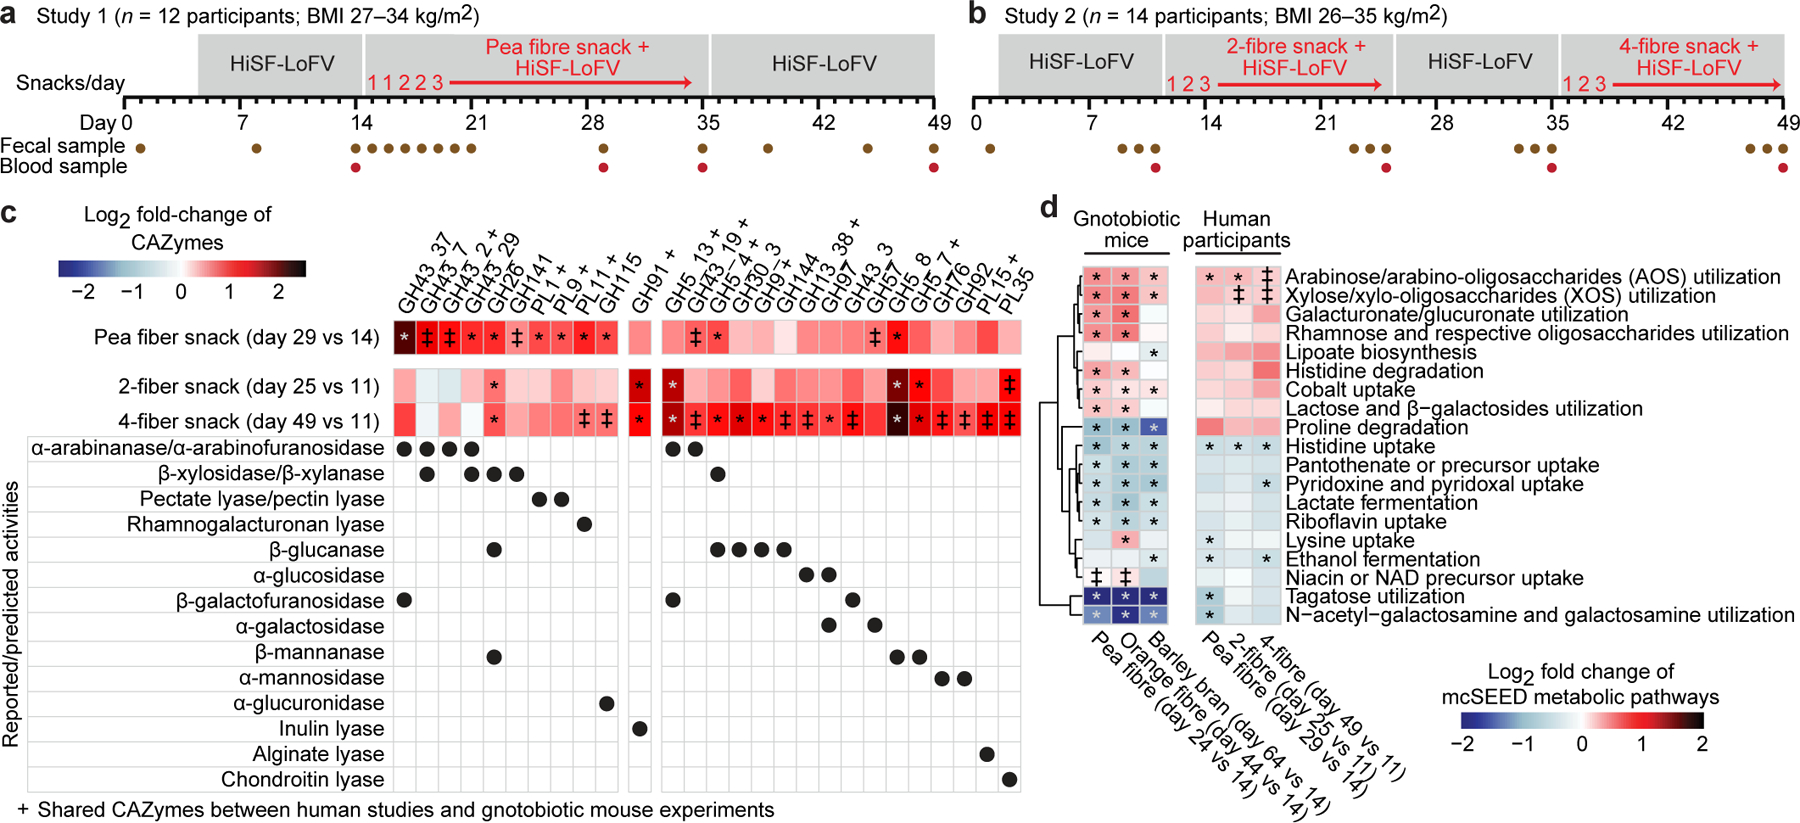
Changing food preferences brought about by westernization that have deleterious health effects1,2-combined with myriad forces that are contributing to increased food insecurity-are catalysing efforts to identify more nutritious and affordable foods3. Consumption of dietary fibre can help to prevent cardiovascular disease, type 2 diabetes and obesity4-6. A substantial number of reports have explored the effects of dietary fibre on the gut microbial community7-9. However, the microbiome is complex, dynamic and exhibits considerable intra- and interpersonal variation in its composition and functions. The large number of potential interactions between the components of the microbiome makes it challenging to define the mechanisms by which food ingredients affect community properties. Here we address the question of how foods containing different fibre preparations can be designed to alter functions associated with specific components of the microbiome. Because a marked increase in snack consumption is associated with westernization, we formulated snack prototypes using plant fibres from different sustainable sources that targeted distinct features of the gut microbiomes of individuals with obesity when transplanted into gnotobiotic mice. We used these snacks to supplement controlled diets that were consumed by adult individuals with obesity or who were overweight. Fibre-specific changes in their microbiomes were linked to changes in their plasma proteomes indicative of an altered physiological state.


Conflict of interest statement

Declarations

J.I.G. is a co-founder of Matatu, Inc., a company characterizing the role of diet-by-microbiota interactions in animal health. A.O. and D.R. are co-founders of Phenobiome Inc., a company pursuing development of computational tools for predictive phenotype profiling of microbial communities. C.B.L is a co-founder of Evolve Biosystems, interVenn Bio, and BCD Bioscience, companies involved in the characterization of glycans and developing carbohydrate applications for human health.

D.K.H, A.M. and S.V. are employees of Mondelēz Global LLC, a multinational company engaged in production of snack foods. The remaining authors declare that they have no competing financial interests.

A patent application related to the fibre-snack formulations described in this report has been filed and published (WO 2021/016129).

Figures

Extended Data Fig. 1:
Extended Data Fig. 1:. Monosaccharide content and glycosidic linkages present in the fibre preparations, and in the unsupplemented and fibre-supplemented HiSF-LoFV diets fed to gnotobiotic mice.
a,b, Monosaccharides and linkages, some represented by their methylated monosaccharide derivatives, in the fibre preparations. Stacked bars represent the mean for technical replicates (n=3) for each glycosyl linkage determination. c, Monosaccharides in the unsupplemented and fibre-supplemented HiSF-LoFV diets. Bars represent the mean ± s.d. for technical replicates (n=3). *P<0.01, ***, P<0.001 (one-way ANOVA with Holm-Šídák multiple comparison correction). d, Linkages, represented by their methylated monosaccharide derivatives in the unsupplemented and fibre-supplemented HiSF-LoFV diets. Stacked bars represent the mean for technical replicates (n=3) for each glycosidic linkage determination. Abbreviations. Glc, glucose; Gal, galactose; GalA, galacturonic acid; GlcA, glucuronic acid; Ara, arabinose; Xyl, xylose; Man, mannose; Fru, fructose; Fuc, fucose; Rha, rhamnose; Rib, ribose; Hex, hexose; dHex, deoxyhexose; T, terminal; f, furanose; p, pyranose; X, undefined linkage.
Extended Data Fig. 2:
Extended Data Fig. 2:. The effects of dietary fibres in gnotobiotic mice colonized with nine different obese human donor microbiota and fed a HiSF-LoFV diet.
a, Experimental design. b, Higher-Order Singular Value Decomposition (HOSVD). Three-dimensional matrices are termed ‘tensors’. A tensor O with dimensions n, m, and p, where n represent subjects (mice or humans), m represents features (ASVs, CAZymes, mcSEED pathways), and p represents time, can be analysed by HOSVD where a ‘core tensor’ (G) is created—a tensor where the only non-zero values are along the diagonal (boxes shown in G). Each box represents a ‘tensor component’ (TC). Each TC relates the variation between each axis of the O tensor. Additionally, three new matrices are created that are related to each other through each TC; e.g., ‘Projection of variables onto TC1’ indicates that variation defined by TC1 is defined by variation across the first row of n, the first column of m, and the first column of p. c-e, HOSVD applied to CAZymes in faecal microbiomes of mice colonized with nine different obese human donor microbial communities (n=348 faecal samples analysed) during each of the three dietary fibre interventions in the diet oscillation experiment. f, Heatmap of discriminatory CAZymes whose log2 fold-changes in abundances were defined as statistically significant during at least one dietary intervention. The grand mean of the data is shown for animals containing the nine different human donor microbiomes sampled at the indicated time points and normalized to day 14 values (n=6–10 mice/group; n=232 faecal samples analysed). The order of CAZymes from left to right is based on their function (rows below) and magnitude of their change within and across fibre treatments. ‡, q-value < 0.10; *, q-value < 0.05 (linear-mixed effects model, FDR-corrected).
Extended Data Fig.3:
Extended Data Fig.3:. Responses of CAZymes and mcSEED metabolic pathways identified by HOSVD analysis as discriminatory for fibre snack consumption in gnotobiotic mice colonized with the nine different human donor faecal communities.
a,b, Heatmap of discriminatory CAZymes and mcSEED metabolic pathways whose changes in abundance were statistically significant during at least one dietary intervention. Data are averaged for animals containing a given human donor microbiota (n=6 to 10 mice/group; n=232 faecal samples analysed) sampled at the indicated time points and normalized to day 14 values. Note that the order of CAZymes from left to right of the heatmap in panel a follows the same order as in Extended Data Fig. 2f, while the order of mcSEED pathways from top to bottom in panel b follows the same order as shown in Fig. 1d. Hierarchical clustering (Euclidean distances) of CAZyme and mcSEED metabolic pathway profiles was used to group donor microbiomes.
Extended Data Fig. 4:
Extended Data Fig. 4:. HOSVD applied to mcSEED metabolic pathway and ASV datasets generated from the faecal microbial communities of mice harboring obese human donor microbial communities during the pea, orange and barley bran fibre phases of the diet oscillation.
a, Microbiome configurations as defined by the representation of mcSEED metabolic pathways on TC1 and TC2 during pea fibre, orange fibre, and barley bran phase of diet oscillation. b, Projections of microbiota configuration as defined by representation of bacterial taxa (ASVs) on TC1 and TC2 during pea fibre, orange fibre and barley bran phases of the diet oscillation protocol. (n=9 human microbiomes; n=6–10 mouse recipients of each human microbiome; n=228 faecal samples analysed for data presented in panels a,b).
Extended Data Fig.5:
Extended Data Fig.5:. Responses of bacterial taxa (ASVs) identified by HOSVD as discriminatory for dietary fibre consumption in gnotobiotic mice colonized with human donor microbiota, and in human participants enrolled in the controlled diet studies.
a, Bray-Curtis dissimilarity distances calculated from the ASV content of communities sampled at all time points (days 4, 9, 14, 19, 24, 29, 34, 39, 44, 49, 54, 59, and 64 post-colonization) from a given group of recipient mice compared to the ASV content of their corresponding human donor community prior to transplantation (Bray-Curtis distances calculated from ASV abundances in faecal samples collected from each group of mice (n=6–10 animals; n=752 faecal samples in total) compared to the abundances of these ASVs in each of their corresponding nine human donor faecal communities). ****, P-value <0.0001 (one-way ANOVA, Šídák’s correction). b, Heatmap of statistically significant log2 fold-changes in the abundances of discriminatory ASVs in gnotobiotic mice during at least one of the fibre interventions. The heatmap on the left shows the grand mean for data obtained from all groups of animals while the heatmap on the right shows averaged data for animals containing a given donor microbiota (n=6 to 10 mice/group; n=232 faecal samples obtained at the indicated time points with data normalized to day 14 values). Hierarchical clustering (Euclidean distances) of ASV profiles was used to group donor microbiota with similar responses to each fibre supplement. c, ASVs whose log2 fold changes in abundance were statistically significant in human participants after at least one of the fibre snack interventions. The left panel shows mean values for participants enrolled in each study, while the three panels to the right show changes in ASV abundances in individual participants after consumption of each of the fibre snacks. Data are normalized to pre-treatment timepoints, i.e., day 14 (study 1) and day 11 (study 2) (n=12 and 14 participants for study 1 and 2, respectively, n=66 faecal samples analysed). Hierarchical clustering (Euclidean distances) of ASV profiles was used to group participants with similar responses to a given fibre snack. ‡ q-value < 0.1, * q-value < 0.05 (linear-mixed effects model, FDR-corrected).
Extended Data Fig.6:
Extended Data Fig.6:. Identification by HOSVD of fibre snack-discriminatory CAZymes and mcSEED metabolic pathways in human participants in the controlled diet studies.
a,b, CAZymes and mcSEED metabolic pathways whose log2 fold-changes in abundance were statistically significant during at least one of the 3 fibre snack interventions. Data are shown for each participant after consumption of each fibre snack type and are normalized to pretreatment timepoints, i.e., day 14 (study 1) and day 11 (study 2) (n=12 and 14 participants for study 1 and 2, respectively, n=66 faecal samples analysed). Hierarchical clustering (Euclidean distances) of CAZyme and mcSEED metabolic pathway profiles was used to group participants with similar responses to each fibre snack type. CAZymes marked with a ‘+’ were also fibre-treatment discriminatory in the gnotobiotic mouse studies.
Extended Data Fig.7:
Extended Data Fig.7:. Spearman-rank cross-correlation analysis of the representation of CAZymes, monosaccharides and glycosidic linkages in the faecal communities of participants consuming the pea fibre snack prototype.
a,b, Correlations between the log2 fold-change of statistically significant, HOSVD-defined discriminatory CAZyme gene abundances (matched by time and participant) to the log2 fold-change in levels of monosaccharides and glycosidic linkages at days 25 and 35 (fibre snack consumption), and days 45 and 49 (post-intervention phase) normalized to day 14 (pre-intervention phase; n=72 faecal samples analysed; 12 participants). Green boxes in panel a highlight a significant correlation between GH43_37 (arabinofuranosidase) and arabinose, a prominent monosaccharide component of pea fibre. Panel b provides evidence that participant microbiomes contain CAZymes that cleave multiple branches of pea fibre arabinan, resulting in accumulation of its 1,5-arabinofuranose backbone in faeces. See Supplementary Results for further details. *, P <0.05; **, P<0.01. Abbreviations: glucose (Glc), galacturonic acid (GalA), arabinose (Ara), xylose (Xyl), galactose (Gal), mannose (Man), rhamnose (Rha), fucose (Fuc), fructose (Fru), glucuronic acid (GlcA), N-acetylglucosamine (GlcNAc), N-acetylgalactosamine (GalNAc), allose (All), ribose (Rib), hexose (Hex), deoxyhexose (dHex); terminal (T), pyranose (p), furanose (f), undefined linkage (X).
Extended Data Fig.8:
Extended Data Fig.8:. Schematic of the analytic pipeline for identifying associations between changes in the plasma proteome and CAZyme responses after fibre snack consumption.
Step 1 shows cross-correlation analysis between plasma proteins and discriminatory CAZymes whose changes in abundance were statistically significant. Step 2 shows SVD analysis of Spearman’s Rho values of the cross-correlation matrix. Proteins with projections along Singular Vector (SV) 1 are plotted in a histogram to identify those proteins most correlated with discriminatory CAZymes (those within the 10th and 90th percentile, α<0.1). Step 3 represents a CompBio-based analysis of groups of proteins with SV1 projections within the 10th and 90th percentiles. Biological themes enriched in proteins binned in the 10th and 90th percentile are generated [threshold cutoff for enrichment score (log2) > 14.8]. Step 4 is an SVD analysis of protein profiles within each biological theme for all participants, followed by cross-correlation between SVD projections (SV1) of themed proteins and discriminatory CAZyme responses to treatment.
Extended Data Fig.9:
Extended Data Fig.9:. CAZyme-associated plasma proteome responses to consumption of the 4-fibre snack prototype.
a-c, Contextual language processing literature analysis (CompBio) of proteins whose abundances were significantly correlated with treatment-discriminatory CAZymes in participants consuming the 4-fibre snack. The analysis procedure is summarized in Extended Data Fig.5. Treatment-responsive proteins, identified by CC-SVD as having projections at the extremes of singular vector 1 (10th and 90th percentiles of the distribution), are grouped into biological themes identified by CompBio, based on a conditional probability analysis, as being significantly enriched for contextually-associated biological ‘concepts’ (processes/pathways) over those that occur by random sampling of the literature. Themes with enrichment scores (log2) > 14.8 in the plasma proteomes of participants who consumed the 4-fibre snack are shown in panels b and c (see Supplementary Table10d-f for a comprehensive list of themes associated with this and the other fibre snacks). d,e, Biological themes based on proteins positioned in 10th and 90th percentiles (panels d and e, respectively) are portrayed as spheres. The size of a sphere is related to its enrichment score in the plasma proteome after consumption of the 4-fibre snack. The thickness of the blue lines connecting themes signifies the number of proteins shared between them. Component proteins of exemplary themes (orange spheres) are listed in boxes and coloured by their median log2 fold-change in response to consumption of the snack (blue, decrease; red, increase).
Extended Data Fig.10:
Extended Data Fig.10:. Connecting host responses defined by plasma proteomic features to microbiome responses defined by CAZyme features in participants consuming the 4-fibre snack.
Cross-Correlation Singular Value Decomposition (CC-SVD) analysis of the plasma proteome with significantly changed discriminatory CAZymes in all participants after consuming the 4-fibre snack. Two distinct group of proteins with significant correlations with CAZymes are shown; one group with SV1 projections situated in the 10th percentile (top) and the other in the 90th percentile (bottom). CompBio analysis revealed biological themes that were significantly correlated with these CAZymes. Themes, their enrichment scores (log2), the number of proteins comprising each theme and the cross-correlation (Spearman’s Rho) values between SV1 projections of themes and discriminatory CAZymes are presented. Each circle represents the correlation between a biological theme and a fibre-responsive CAZyme, with larger and darker circles indicating stronger correlations (positive correlations are coloured in red while negative correlations are coloured in blue).
Extended Data Fig.11:
Extended Data Fig.11:. Individual responses of the plasma proteome of participants consuming the 4-fibre snack prototype.
a,b, Heatmaps plotting the projections on SV1 of changes in the representation of biological themes during consumption of the 4-fibre snack. c, Heatmap plotting the log2 fold-change in the levels of plasma proteins enriched in the ‘Glucose Metabolism’ theme. Data for each participant is shown, normalized to the last day of the pretreatment phase on day 11. Note that the 4-fibre snack produced the greatest reduction in HOMA-IR among the three different snacks tested (Supplementary Table5c). However, this reduction did not achieve statistical significance (P=0.078, linear-mixed effects model) after the short period of snack consumption in this study. d-f, LC-QTOF-MS analysis of a biomarker of orange fibre consumption present in faecal samples obtained from gnotobiotic mice and humans. Panel d compares levels of the m/z 274.1442 analyte in colonized and germ-free mice fed the unsupplemented, orange fibre-supplemented or pea fibre-supplemented HiSF-LoFV diet for 10 days. The analyte is only detectable when orange fibre is consumed and is not dependent upon on the human donor microbiome for its generation. Bars represent mean values ± s.d. for biological replicates (n=5 mice/group). Panels d and e compare levels of the analyte in faecal samples obtained from participants in human study 2 on days 25 and 49 when they were consuming the maximum dose of the 2-fibre (pea and inulin) and 4-fibre (pea fibre, inulin, orange fibre plus barley bran) snack food prototypes. The bar graph in panel e represents mean values ± s.d. for technical replicates (n=14 participants). The horizontal dashed line in panel f denotes a baseline value operationally defined as the highest level of detection of the analyte in participants consuming the 2-fibre snack food prototype lacking orange fibre.
Extended Data Fig.12:
Extended Data Fig.12:. Plasma proteins with statistically significant changes in their abundances as a function of fibre treatment type and participant.
Heatmap plotting the log2 fold-change in the abundances of plasma proteins in participants consuming the indicated fibre snack prototype. Data from the nine participants in study 1 (pea fibre snack) who were also enrolled in study 2 (2- and 4-fibre snacks) are shown. Changes in protein levels are referenced to their abundances on the last day of the pretreatment phase (day 14 and day 11 in study 1 and study 2, respectively) (n=66 blood plasma samples analysed). *, P<0.05; ** P<0.01; *** P<0.001 (linear model, limma).
Fig. 1:
Fig. 1:. Controlled diet study of the effects of fibre snack food prototypes on the faecal microbiomes of overweight and obese humans.
a,b, Study designs. c, Heatmap plotting discriminatory CAZymes for all three fibre snack treatments whose log2-fold change in abundance was statistically significant during at least one dietary intervention in the faecal microbiomes of participants during consumption of either of the fibre snacks relative to last day of the pretreatment phase. Data are averaged for all participants during each dietary intervention period (n=12 and 14 participants for study 1 and 2, respectively, n=66 faecal samples analysed). d, Heatmap of discriminatory mcSEED pathways represented in the microbiomes of gnotobiotic mice and human participants whose changes in abundance were statistically significant during at least one of the dietary fibre interventions. The heatmap depicted on the left shows the grand mean of the log2 fold-change in abundances of mcSEED pathways in animals containing the nine different human donor communities (n=6 to 10 mice/donor microbiome; n=232 faecal samples analysed), while the heatmap on the right shows the mean log2 fold-change in the abundances of mcSEED pathways in participants consuming the pea fibre, 2-fibre or 4-fibre snacks (n=12 and 14 for studies 1 and 2, respectively; n=66 faecal samples analysed). The order of mcSEED pathways from top to bottom is based on hierarchical clustering (Euclidean distances). ‡ q-value <0.1, * q-value <0.05 (linear-mixed effects model, FDR-corrected). CAZymes marked with a ‘+’ were also fibre-treatment discriminatory in the gnotobiotic mouse studies.

Comment in

References

    1. NCD Risk Factor Collaboration (NCD-RisC). Trends in adult body-mass index in 200 countries from 1975 to 2014: a pooled analysis of 1698 population-based measurement studies with 19·2 million participants. The Lancet 387, 1377–1396 (2016). - PMC - PubMed
    1. GBD 2017 Diet Collaborators. Health effects of dietary risks in 195 countries, 1990–2017: a systematic analysis for the Global Burden of Disease Study 2017. The Lancet 393, 1958–1972 (2019). - PMC - PubMed
    1. Willett W et al. Food in the Anthropocene: the EAT–Lancet Commission on healthy diets from sustainable food systems. The Lancet 393, 447–492 (2019). - PubMed
    1. Hauner H et al. Evidence-based guideline of the German Nutrition Society: carbohydrate intake and prevention of nutrition-related diseases. Ann. Nutr. Metab 60, 1–58 (2012). - PubMed
    1. Reynolds A et al. Carbohydrate quality and human health: a series of systematic reviews and meta-analyses. The Lancet 393, 434–445 (2019). - PubMed

Publication types

MeSH terms