Review
. 2021 Jun 7:15:638007.
doi: 10.3389/fncir.2021.638007. eCollection 2021.

Locus Coeruleus Norepinephrine in Learned Behavior: Anatomical Modularity and Spatiotemporal Integration in Targets

Affiliations
Review

Locus Coeruleus Norepinephrine in Learned Behavior: Anatomical Modularity and Spatiotemporal Integration in Targets

Vincent Breton-Provencher et al. Front Neural Circuits. .

Abstract

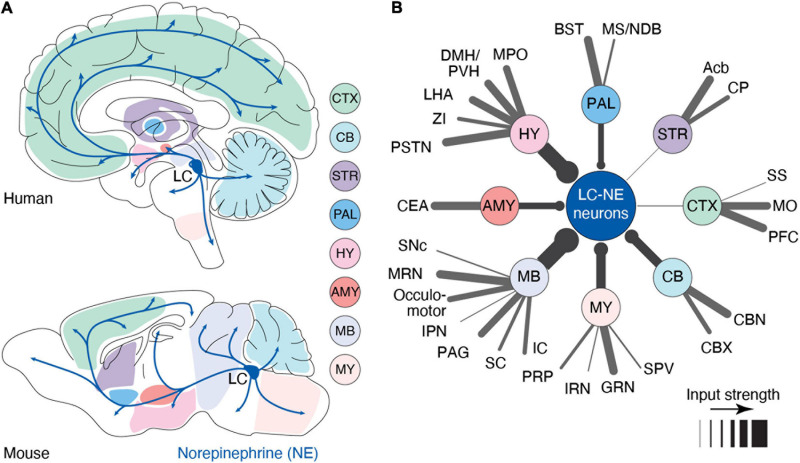
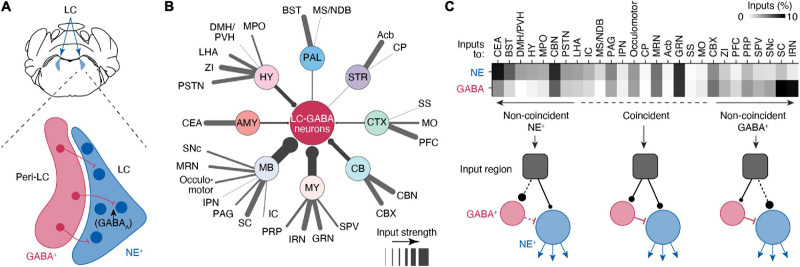
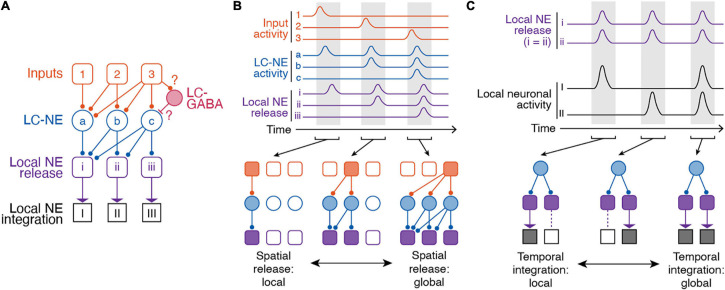
The locus coeruleus (LC), a small brainstem nucleus, is the primary source of the neuromodulator norepinephrine (NE) in the brain. The LC receives input from widespread brain regions, and projects throughout the forebrain, brainstem, cerebellum, and spinal cord. LC neurons release NE to control arousal, but also in the context of a variety of sensory-motor and behavioral functions. Despite its brain-wide effects, much about the role of LC-NE in behavior and the circuits controlling LC activity is unknown. New evidence suggests that the modular input-output organization of the LC could enable transient, task-specific modulation of distinct brain regions. Future work must further assess whether this spatial modularity coincides with functional differences in LC-NE subpopulations acting at specific times, and how such spatiotemporal specificity might influence learned behaviors. Here, we summarize the state of the field and present new ideas on the role of LC-NE in learned behaviors.

Keywords: arousal; inhibition; learned behavior; learning; locus coeruleus; neuromodulation; noradrenaline (norepinephrine).


Conflict of interest statement

The authors declare that the research was conducted in the absence of any commercial or financial relationships that could be construed as a potential conflict of interest.

Figures

FIGURE 1
FIGURE 1
Anatomy of the LC-NE system. (A) Anatomy of the outputs originating from the LC nucleus in human and mouse. Shaded areas indicate major sub-regions that potentially send input to LC. In this illustration, we have assumed that input regions identified in mouse are similar in humans (B) Distal inputs to LC-NE neurons obtained by retrograde tracing using rabies virus targeted at LC-NE neurons in mice. Input regions are grouped by: cortex (CTX), striatum (STR), pallidum (PAL), hypothalamus (HY), amygdala (AMY), midbrain (MB), medulla (MY), and cerebellum (CB). The thickness of each line represents the strength of the input from each region. Input strength was calculated by counting the number of cells retrogradely labeled in a specific area and dividing it by the total number of retrogradely labeled neurons. Regions providing less than 0.5% of inputs were left out of this diagram. Local inputs from the pons were also excluded. PFC, prefrontal cortex; MO, motor area; SS, somatosensory area; Acb, nucleus accumbens; CP, caudoputamen; BST, bed nucleus of stria terminalis; MS/NDB, medial septal/diagonal band nucleus; MPO, medial preoptic area; DMH/PVH, dorsomedial/paraventricular nucleus; LHA, lateral hypothalamic area; ZI, zona incerta; PSTN, parasubthalamic nucleus; CEA, central amygdala; SNc, substantia nigra; MRN, midbrain reticular nucleus; IPN, interpeduncular nucleus; PAG, periaqueductal gray; SC, superior colliculus; IC, inferior colliculus; PRP, nucleus prepositus; IRN, intermediate reticular nucleus; GRN, gigantocellular reticular nucleus; SPV, spinal nucleus of the trigeminal; CBX, cerebellar cortex; and CBN, cerebellar nuclei. Data in (B) from Breton-Provencher and Sur (2019).
FIGURE 2
FIGURE 2
Circuits controlling local inhibition of LC-NE+ neurons. (A) Illustration of a coronal view of the LC and medial pericoeruleus area showing the location of LC-GABA and -NE neurons. (B) Distal inputs to LC-GABA neurons obtained by retrograde tracing using rabies virus targeted at LC-NE neurons. Input regions are grouped by: cortex (CTX), striatum (STR), pallidum (PAL), hypothalamus (HY), amygdala (AMY), midbrain (MB), medulla (MY), and cerebellum (CV). The thickness of each line represents the strength of the input from each region. Input strength was calculated by counting the number of cells retrogradely labeled in a specific area and dividing it by the total number of retrogradely labeled neurons. Regions providing less than 0.5% of inputs were left out of this diagram. Local inputs from the pons were also excluded. (C) Comparison between the input strength to LC-NE versus LC-GABA for all distal brain regions targeting the LC area. The darkness of each square in the top graph represents the fraction of input each region contributes to total input. Regions are divided between three types depending on whether they send coincident or non-coincident inputs to LC-NE or LC-GABA neurons. See Figure 1 for a list of abbreviations. Data in (B,C) from Breton-Provencher and Sur (2019).
FIGURE 3
FIGURE 3
Spatiotemporal dynamics of the LC-NE system. (A) Anatomical organization of inputs to and outputs of LC. Note, LC-GABA neurons were included in this illustration as potential mechanism for nuancing local LC-NE activity, but, so far, no data exist on the relationship between local LC-GABA and specific LC-NE outputs. (B) Spatial modularity of LC-NE release. Top – Example activity of inputs to LC-NE neurons (orange), LC-NE neurons (blue), and local LC-NE release (purple). Bottom – Local versus global release of NE in output regions is dependent on which LC-NE neurons are activated by a given input. (C) Temporal modularity of LC-NE neuromodulation. Top – activity of local NE release in two given output regions and underlying neuronal activity in each region. Note, we assume that NE release is spatially global for simplicity. We also assume that NE neuromodulation increases neuronal activity in both target regions. Bottom – Due to differential NE receptor expression in brain regions, heterogenous expression of NE receptors on different types of brain cells, or the underlying function of a specific brain region, temporal integration can be local or global.

References

    1. Arnsten A. F. T. (2011). Catecholamine influences on dorsolateral prefrontal cortical networks. Biol. Psychiatry 69 e89–e99. 10.1016/j.biopsych.2011.01.027 - DOI - PMC - PubMed
    1. Arnsten A. F. T., Raskind M. A., Taylor F. B., Connor D. F. (2015). The effects of stress exposure on prefrontal cortex: translating basic research into successful treatments for post-traumatic stress disorder. Neurobiol. Stress 1 89–99. 10.1016/j.ynstr.2014.10.002 - DOI - PMC - PubMed
    1. Aston-Jones G., Bloom F. E. (1981a). Activity of norepinephrine-containing locus coeruleus neurons in behaving rats anticipates fluctuations in the sleep-waking cycle. J. Neurosci. 1 876–886. 10.1523/jneurosci.01-08-00876.1981 - DOI - PMC - PubMed
    1. Aston-Jones G., Bloom F. E. (1981b). Norepinephrine-containing locus coeruleus neurons in behaving rats exhibit pronounced responses to non-noxious environmental stimuli. J. Neurosci. 1 887–900. 10.1523/jneurosci.01-08-00887.1981 - DOI - PMC - PubMed
    1. Aston-Jones G., Cohen J. D. (2005). An integrative theory of locus coeruleus-norepinephrine function: adaptive gain and optimal performance. Annu. Rev. Neurosci. 28 403–450. 10.1146/annurev.neuro.28.061604.135709 - DOI - PubMed

Publication types