. 2021 Jun 7:12:686676.
doi: 10.3389/fimmu.2021.686676. eCollection 2021.

Pregnancy Induces an Immunological Memory Characterized by Maternal Immune Alterations Through Specific Genes Methylation

Affiliations

Pregnancy Induces an Immunological Memory Characterized by Maternal Immune Alterations Through Specific Genes Methylation

Xiaobo Huang et al. Front Immunol. .

Abstract

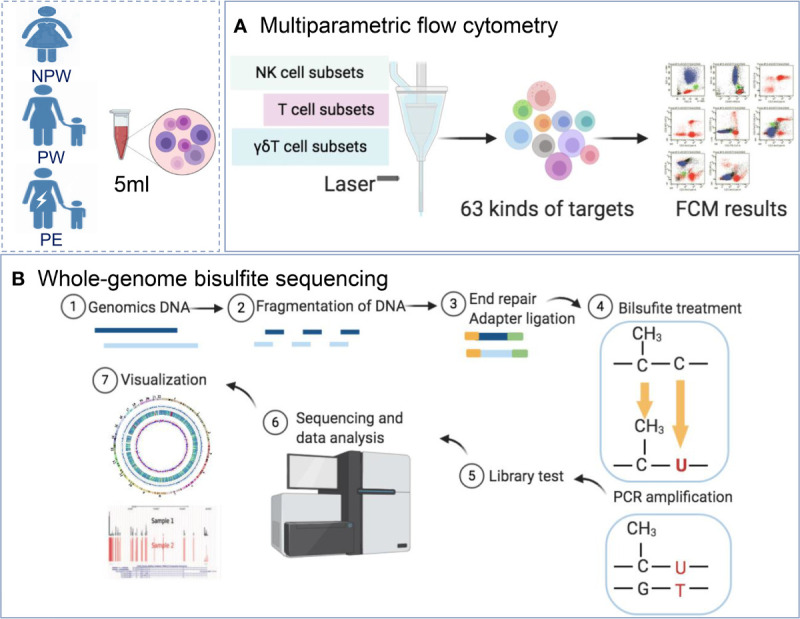
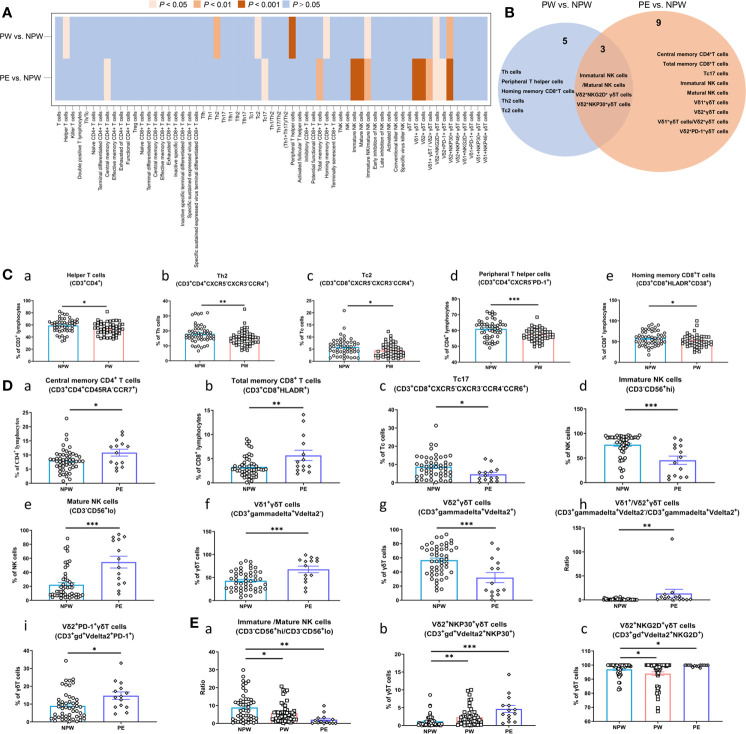
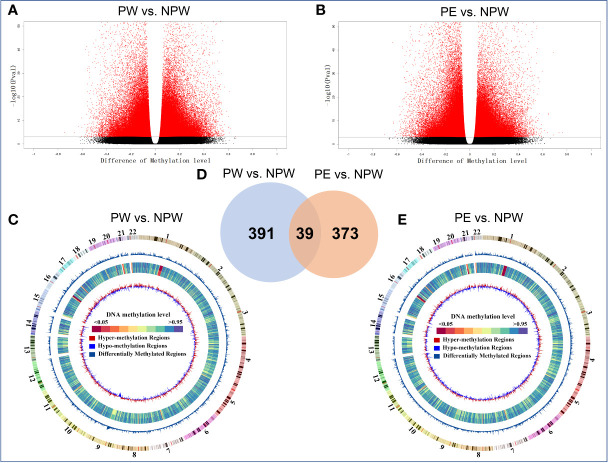
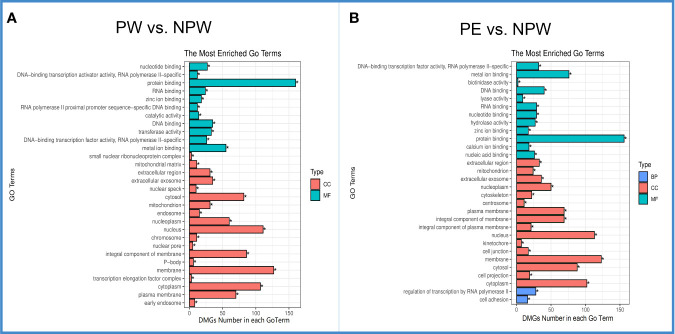
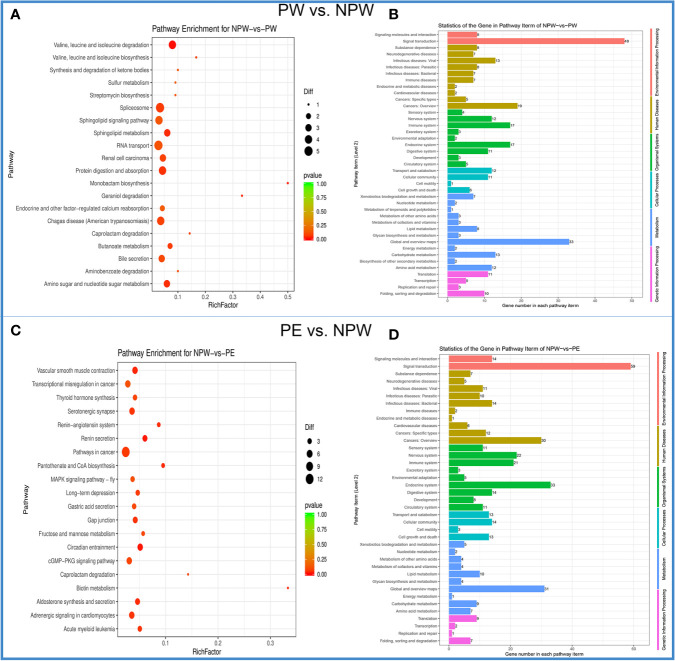
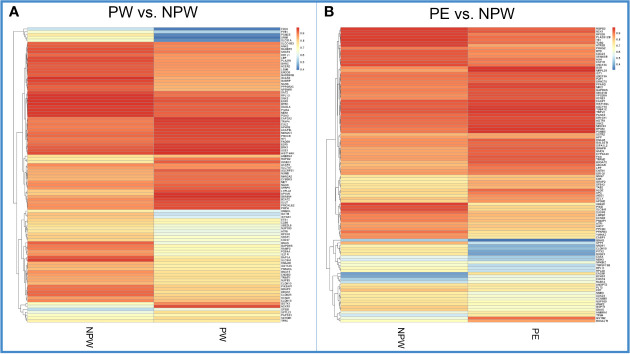
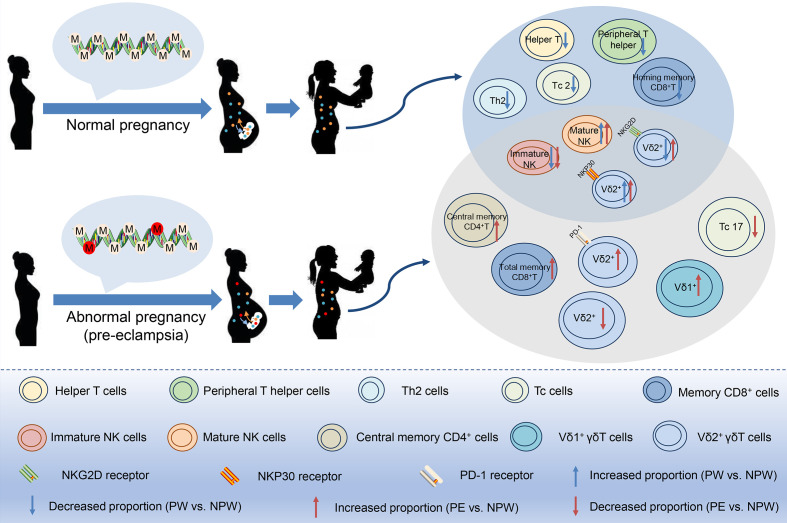
During pregnancy, the maternal immune system undergoes major adaptive modifications that are necessary for the acceptance and protection of the fetus. It has been postulated that these modifications are temporary and limited to the time of pregnancy. Growing evidence suggests that pregnancy has a long-term impact on maternal health, especially among women with pregnancy complications, such as preeclampsia (PE). In addition, the presence of multiple immunological-associated changes in women that remain long after delivery has been reported. To explain these long-term modifications, we hypothesized that pregnancy induces long-term immunological memory with effects on maternal well-being. To test this hypothesis, we evaluated the immunological phenotype of circulating immune cells in women at least 1 year after a normal pregnancy and after pregnancy complicated by PE. Using multiparameter flow cytometry (FCM) and whole-genome bisulfite sequencing (WGBS), we demonstrate that pregnancy has a long-term effect on the maternal immune cell populations and that this effect differs between normal pregnancy and pregnancy complicated by PE; furthermore, these modifications are due to changes in the maternal methylation status of genes that are associated with T cell and NK cell differentiation and function. We propose the existence of an "immunological memory of pregnancy (IMOP)" as an evolutionary advantage for the success of future pregnancies and the proper adaptation to the microchimeric status established during pregnancy. Our findings demonstrate that the type of immune cell populations modified during pregnancy may have an impact on subsequent pregnancy and future maternal health.

Keywords: epigenetic; immune cells; immunological memory; preeclampsia; pregnancy.


Conflict of interest statement

The authors declare that the research was conducted in the absence of any commercial or financial relationships that could be construed as a potential conflict of interest.

Figures

Figure 1
Figure 1
Study design. (A) Women were recruited into the NPW (n = 50), PW (n = 50) and PE (n = 14) groups. A total of 63 immunological parameters, including T cell, NK cell and γδT cell subsets in peripheral blood, were assessed using multiparameter flow cytometry. (B) Whole-blood DNA methylation in the NPW (n = 5), PW (n = 5) and PE (n = 5) groups was detected using WGBS. NPW, nonparous woman; PW, pregnant woman; PE, preeclampsia; WGBS, whole-genome bisulfite sequencing.
Figure 2
Figure 2
Immune modifications after normal or abnormal pregnancies. Lymphocyte composition and immunophenotypic characterization of T cells, NK cells and γδT cells in the NPW (n = 50), PW (n = 50) and PE (n = 14) groups were analyzed by multiparameter flow cytometry. (A) Heatmap showing the comparison of 63 immune parameters of T cells, NK cells and γδT cells in the PW and PE groups compared with the NPW group; (B) Venn diagram showing both unique and overlapping modified immune parameters in the PW and PE groups compared with the NPW group. (C) Changed immune cell subsets in women who experienced normal pregnancies (a–e); (D) Changed immune cell subsets in women who experienced pregnancies complicated by PE (a–i); (E) Common changed immune cell subsets in women who experienced pregnancy [normal (PW) or abnormal (PE)]. The Mann–Whitney U test was used to determine significant differences between the PW or PE groups and the NPW group (a–c). All the data are shown as the mean ± SEM; *P < 0.05; **P < 0.01; ***P < 0.001.
Figure 3
Figure 3
Whole-genome DNA methylation profiles of the PW and PE groups. (A, B) Methylated sites of PW and PE groups in a volcano plot. Most detected sites were methylated in immune cells in the PW and PE groups compared with the NPW group. Red and black plots represent significantly differentially and not differentially methylated sites, respectively. The dots on the left and right sides of each volcano represent hypo- and hypermethylation levels. (C, E) Circus plot of methylation levels in the PW and PE groups compared with the NPW group. There are five circles from the outer side to the inner side, which represent the methylation in the chromosome, DMR, mean methylation levels in the NPW group and PW group, and hypo- and hypermethylation distribution in the PW group compared with the NPW group. Red represents the hypomethylated region, and blue represents the hypermethylated region. (A, C) PW vs. NPW. (B, E) PE vs. NPW. P < 0.05. (D) The 430 DMGs that occurred after normal pregnancy are shown in blue (PW vs. NPW), and the 412 DMGs after PE are shown in yellow (PE vs. NPW). A total of 39 common genes were methylated after normal pregnancy and PE and are shown in the blue-yellow overlap. (A) PW vs. NPW. (B) PE vs. NPW. P < 0.05.
Figure 4
Figure 4
Gene ontology (GO) of DMGs in the PW and PE groups. (A) The top 30 significantly different GO terms in the PW group were mainly in the cell component (CC) and molecular function (MF) categories. Green represents MF, and red represents CC. (B) The top 30 significantly differentially expressed GO terms in the PE group were in the CC, MF and biological process (BP) categories. Red represents CC, blue BP and green MF. *q < 0.05.
Figure 5
Figure 5
Kyoto Encyclopedia of Genes and Genomes (KEGG) enrichment of DMGs in the PW and PE groups. (A) The scatter plot of the KEGG signaling pathway for PW vs. NPW. The ordinate represents the degree of enrichment, while the abscissa represents 20 KEGG signaling pathways. The black dots indicate the number of genes contained in the signal pathway, and the color of the dots represents the size of the P value. The reddish color indicates a stronger correlation. (B) KEGG signaling pathway histogram. The ordinate on the left represents 41 KEGG signal pathways, and the abscissa demonstrates the statistics of genes in each pathway term for PW vs. NPW. The ordinate in the left and color represents the different first-level KEGG pathways. (C) The scatter plot of the KEGG signaling pathway for PE vs. NPW. The ordinate represents the degree of enrichment, while the abscissa represents 20 KEGG signaling pathways. The black dots indicate the number of genes contained in the signaling pathway, and the color of the dots represents the size of the P value. The reddish color indicates a stronger correlation. (D) KEGG signaling pathway histogram. The ordinate on the left represents 41 KEGG signaling pathways, and the abscissa demonstrates the statistics of genes in each pathway term for PE vs. NPW. The ordinate in the left and color represent the different first-level KEGG pathways.
Figure 6
Figure 6
Heatmap of methylation levels of significant DMGs in each KEGG pathway in the PW and PE groups. (A) Methylation levels of the significant DMGs in 201 KEGG pathways in the PW and NPW groups. Blue color represents lower methylation levels. Red represents higher methylation levels. (B) Methylation levels of the significant DMGs in 196 KEGG pathways in the PE and NPW groups. Blue color represents lower methylation levels. Red represents higher methylation levels.
Figure 7
Figure 7
Network diagram of methylation levels of significant DMGs and cell subset modification related DMGs in each KEGG pathway in the PW and PE groups. (A) Methylation levels of the significant DMGs in 201 KEGG pathways in the PW group compared to those in the NPW group. The larger the node is, the higher the methylation level of the genes in the PW group compared to the NPW group. The gray line between two genes represents the near-identical methylation changes (both increased and decreased) between the two compared groups, while the red line represents opposite methylation changes between the groups. (B) Methylation levels of the significant DMGs in 196 KEGG pathways in the PE group compared to the NPW group. The larger the node is, the higher the methylation level of the gene in the PE group compared to the NPW group. The gray line between two genes represents the near-identical methylation changes (both increased and decreased) between the two compared groups, while the red line represents opposite methylation changes (one hypermethylated gene and one hypomethylated) between the two compared groups. (C) Average methylation levels of T cell- and NK cell-related DMGs in the PW and NPW groups. (D) Average methylation level of T cell-related DMGs in the PE and NPW groups.
Figure 8
Figure 8
Pregnancy-mediated DNA methylation modification may contribute to the long-term impact of normal and abnormal pregnancies on maternal peripheral immune cell subsets. In normal or preeclamptic pregnancies that resulted in the birth of a healthy baby, methylation modifications in peripheral immune cells were different and persisted at least one year postpartum, as well as did differences in the immune cell subsets including T, NK and γδT cell subsets. Therefore, we speculate that pregnancy-induced differential methylation of genes in peripheral blood may be related to the altered proportion of immune cell subsets. Red circles in DNA: epigenetic changes in abnormal pregnancy.

Similar articles

Cited by

References

    1. Mor G, Aldo P, Alvero AB. The Unique Immunological and Microbial Aspects of Pregnancy. Nat Rev Immunol (2017) 17:469–82. 10.1038/nri.2017.64 - DOI - PubMed
    1. Rijnink EC, Penning ME, Wolterbeek R, Wilhelmus S, Zandbergen M, van Duinen SG, et al. . Tissue Microchimerism Is Increased During Pregnancy: A Human Autopsy Study. Mol Hum Reprod (2015) 21:857–64. 10.1093/molehr/gav047 - DOI - PubMed
    1. Neiger R. Long-Term Effects of Pregnancy Complications on Maternal Health: A Review. J Clin Med (2017) 6:76. 10.3390/jcm6080076 - DOI - PMC - PubMed
    1. Mor G, Cardenas I. The Immune System in Pregnancy: A Unique Complexity. Am J Reprod Immunol (2010) 63:425–33. 10.1111/j.1600-0897.2010.00836.x - DOI - PMC - PubMed
    1. Kinder JM, Stelzer IA, Arck PC, Way SS. Immunological Implications of Pregnancy-Induced Microchimerism. Nat Rev Immunol (2017) 17:483–94. 10.1038/nri.2017.38 - DOI - PMC - PubMed

Publication types

MeSH terms