

Rapid and ultrasensitive electrochemical detection of circulating tumor DNA by hybridization on the network of gold-coated magnetic nanoparticles
- PMID: 34163756
- PMCID: PMC8179593
- DOI: 10.1039/d1sc01044a
Rapid and ultrasensitive electrochemical detection of circulating tumor DNA by hybridization on the network of gold-coated magnetic nanoparticles
Abstract
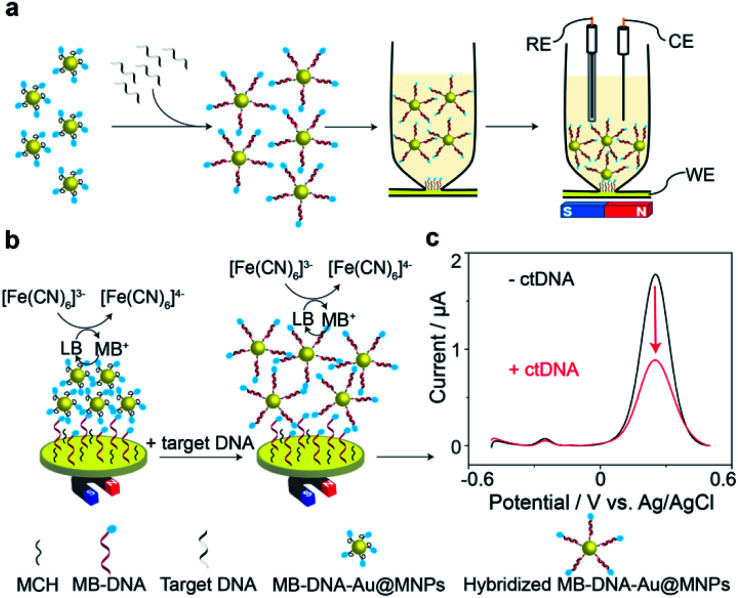
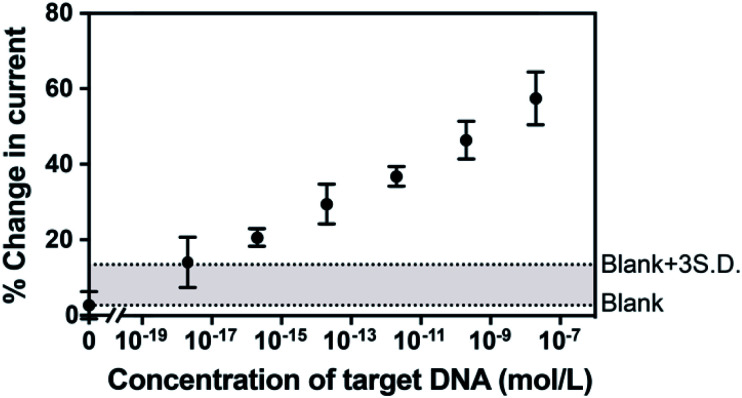
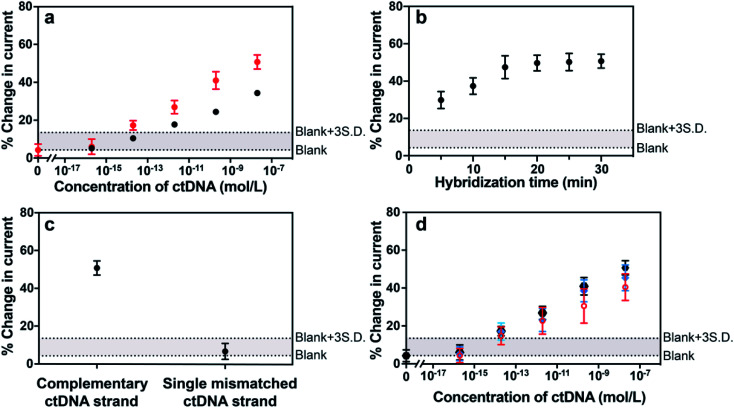
An accurate and robust method for quantifying the levels of circulating tumor DNA (ctDNA) is vital if this potential biomarker is to be used for the early diagnosis of cancer. The analysis of ctDNA presents unique challenges because of its short half-life and ultralow abundance in early stage cancers. Here we develop an ultrasensitive electrochemical biosensor for rapid detection of ctDNA in whole blood. The sensing of ctDNA is based on hybridization on a network of probe DNA modified gold-coated magnetic nanoparticles (DNA-Au@MNPs). This DNA-Au@MNPs biosensor can selectively detect short- and long-strand DNA targets. It has a broad dynamic range (2 aM to 20 nM) for 22 nucleotide DNA target with an ultralow detection limit of 3.3 aM. For 101 nucleotide ctDNA target, a dynamic range from 200 aM to 20 nM was achieved with a detection limit of 5 fM. This DNA-Au@MNPs based sensor provides a promising method to achieve 20 min response time and minimally invasive cancer early diagnosis.
This journal is © The Royal Society of Chemistry.
Conflict of interest statement
J. J. G., D. C., and Y. W. have filed a provisional patent application pertaining to the results presented in this paper. The authors declare no other competing interests.
Figures
Similar articles
-
Rapid and ultrasensitive electrochemical detection of DNA methylation for ovarian cancer diagnosis.Biosens Bioelectron. 2022 Jun 15;206:114126. doi: 10.1016/j.bios.2022.114126. Epub 2022 Feb 26. Biosens Bioelectron. 2022. PMID: 35240438
-
Electrochemical Biosensor Based on l-Arginine and rGO-AuNSs Deposited on the Electrode Combined with DNA Probes for Ultrasensitive Detection of the Gastric Cancer-Related PIK3CA Gene of ctDNA.ACS Appl Bio Mater. 2022 Nov 21;5(11):5094-5103. doi: 10.1021/acsabm.2c00393. Epub 2022 Oct 31. ACS Appl Bio Mater. 2022. PMID: 36315410
-
Conductive metal-organic framework based label-free electrochemical detection of circulating tumor DNA.Mikrochim Acta. 2022 Sep 23;189(10):391. doi: 10.1007/s00604-022-05482-4. Mikrochim Acta. 2022. PMID: 36138259
-
Nucleic acid hybridization on an electrically reconfigurable network of gold-coated magnetic nanoparticles enables microRNA detection in blood.Nat Nanotechnol. 2018 Nov;13(11):1066-1071. doi: 10.1038/s41565-018-0232-x. Epub 2018 Aug 27. Nat Nanotechnol. 2018. PMID: 30150634
-
Recent advances in ctDNA detection using electrochemical biosensor for cancer.Discov Oncol. 2024 Oct 2;15(1):517. doi: 10.1007/s12672-024-01365-7. Discov Oncol. 2024. PMID: 39356360 Free PMC article. Review.
Cited by
-
Detection of Tumor DNA in Human Plasma with a Functional PLL-Based Surface Layer and Plasmonic Biosensing.ACS Sens. 2021 Jun 25;6(6):2307-2319. doi: 10.1021/acssensors.1c00360. Epub 2021 May 25. ACS Sens. 2021. PMID: 34032412 Free PMC article.
-
Advances in Noble-Metal Nanoparticle-Based Fluorescence Detection of Organophosphorus Chemical Warfare Agents.ACS Omega. 2022 Jul 29;7(31):27079-27089. doi: 10.1021/acsomega.2c03645. eCollection 2022 Aug 9. ACS Omega. 2022. PMID: 35967060 Free PMC article. Review.
-
Leveraging electrochemical sensors to improve efficiency of cancer detection.World J Clin Oncol. 2024 Mar 24;15(3):360-366. doi: 10.5306/wjco.v15.i3.360. World J Clin Oncol. 2024. PMID: 38576591 Free PMC article.
-
Circulating Tumor DNA-A Novel Biomarker of Tumor Progression and Its Favorable Detection Techniques.Cancers (Basel). 2022 Dec 7;14(24):6025. doi: 10.3390/cancers14246025. Cancers (Basel). 2022. PMID: 36551512 Free PMC article. Review.
-
Label-Free Electrochemiluminescence Nano-aptasensor for the Ultrasensitive Detection of ApoA1 in Human Serum.ACS Omega. 2022 Oct 20;7(43):38709-38716. doi: 10.1021/acsomega.2c04300. eCollection 2022 Nov 1. ACS Omega. 2022. PMID: 36340071 Free PMC article.
References
-
- Mouliere F. Chandrananda D. Piskorz A. M. Moore E. K. Morris J. Ahlborn L. B. Mair R. Goranova T. Marass F. Heider K. Wan J. C. M. Supernat A. Hudecova I. Gounaris I. Ros S. Jimenez-Linan M. Garcia-Corbacho J. Patel K. Ostrup O. Murphy S. Eldridge M. D. Gale D. Stewart G. D. Burge J. Cooper W. N. van der Heijden M. S. Massie C. E. Watts C. Corrie P. Pacey S. Brindle K. M. Baird R. D. Mau-Sorensen M. Parkinson C. A. Smith C. G. Brenton J. D. Rosenfeld N. Sci. Transl. Med. 2018;10:eaat4921. - PMC - PubMed
-
- Wan J. C. M. Massie C. Garcia-Corbacho J. Mouliere F. Brenton J. D. Caldas C. Pacey S. Baird R. Rosenfeld N. Nat. Rev. Cancer. 2017;17:223–238. - PubMed
-
- Aravanis A. M. Lee M. Klausner R. D. Cell. 2017;168:571–574. - PubMed
-
- Das J. Kelley S. O. Angew. Chem. Int. Ed. 2020;59:2554–2564. - PubMed
-
- Rodda A. E. Parker B. J. Spencer A. Corrie S. R. ACS Sens. 2018;3:540–560. - PubMed
LinkOut - more resources
Full Text Sources