Hydroxy-bridged resting states of a [NiFe]-hydrogenase unraveled by cryogenic vibrational spectroscopy and DFT computations
- PMID: 34163984
- PMCID: PMC8179317
- DOI: 10.1039/d0sc05022a
Hydroxy-bridged resting states of a [NiFe]-hydrogenase unraveled by cryogenic vibrational spectroscopy and DFT computations
Abstract
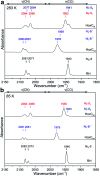
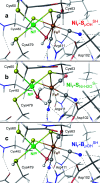
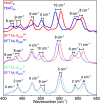
The catalytic mechanism of [NiFe]-hydrogenases is a subject of extensive research. Apart from at least four reaction intermediates of H2/H+ cycling, there are also a number of resting states, which are formed under oxidizing conditions. Although not directly involved in the catalytic cycle, the knowledge of their molecular structures and reactivity is important, because these states usually accumulate in the course of hydrogenase purification and may also play a role in vivo during hydrogenase maturation. Here, we applied low-temperature infrared (cryo-IR) and nuclear resonance vibrational spectroscopy (NRVS) to the isolated catalytic subunit (HoxC) of the heterodimeric regulatory [NiFe]-hydrogenase (RH) from Ralstonia eutropha. Cryo-IR spectroscopy revealed that the HoxC protein can be enriched in almost pure resting redox states suitable for NRVS investigation. NRVS analysis of the hydrogenase catalytic center is usually hampered by strong spectral contributions of the FeS clusters of the small, electron-transferring subunit. Therefore, our approach to investigate the FeS cluster-free, 57Fe-labeled HoxC provided an unprecedented insight into the [NiFe] site modes, revealing their contributions in a spectral range otherwise superimposed by FeS cluster-derived bands. Rationalized by density functional theory (DFT) calculations, our data provide structural descriptions of the previously uncharacterized hydroxy- and water-containing resting states. Our work highlights the relevance of cryogenic vibrational spectroscopy and DFT to elucidate the structure of barely defined redox states of the [NiFe]-hydrogenase active site.
This journal is © The Royal Society of Chemistry.
Conflict of interest statement
There are no conflicts to declare.
Figures


Similar articles
-
The large subunit of the regulatory [NiFe]-hydrogenase from Ralstonia eutropha - a minimal hydrogenase?Chem Sci. 2020 Apr 27;11(21):5453-5465. doi: 10.1039/d0sc01369b. Chem Sci. 2020. PMID: 34094072 Free PMC article.
-
Nuclear resonance vibrational spectroscopy reveals the FeS cluster composition and active site vibrational properties of an O2-tolerant NAD+-reducing [NiFe] hydrogenase.Chem Sci. 2015;6(2):1055-1060. doi: 10.1039/c4sc02982h. Chem Sci. 2015. PMID: 25678951 Free PMC article.
-
Key hydride vibrational modes in [NiFe] hydrogenase model compounds studied by resonance Raman spectroscopy and density functional calculations.Inorg Chem. 2012 Nov 5;51(21):11787-97. doi: 10.1021/ic3017276. Epub 2012 Oct 5. Inorg Chem. 2012. PMID: 23039071
-
Proton Transfer in the Catalytic Cycle of [NiFe] Hydrogenases: Insight from Vibrational Spectroscopy.ACS Catal. 2017 Apr 7;7(4):2471-2485. doi: 10.1021/acscatal.6b03182. Epub 2017 Feb 23. ACS Catal. 2017. PMID: 28413691 Free PMC article. Review.
-
X-ray Crystallography and Vibrational Spectroscopy Reveal the Key Determinants of Biocatalytic Dihydrogen Cycling by [NiFe] Hydrogenases.Angew Chem Int Ed Engl. 2019 Dec 16;58(51):18710-18714. doi: 10.1002/anie.201908258. Epub 2019 Oct 25. Angew Chem Int Ed Engl. 2019. PMID: 31591784 Free PMC article. Review.
Cited by
-
Synechocystis sp. PCC 6803 Requires the Bidirectional Hydrogenase to Metabolize Glucose and Arginine Under Oxic Conditions.Front Microbiol. 2022 May 31;13:896190. doi: 10.3389/fmicb.2022.896190. eCollection 2022. Front Microbiol. 2022. PMID: 35711753 Free PMC article.
-
Nuclear Resonance Vibrational Spectroscopy: A Modern Tool to Pinpoint Site-Specific Cooperative Processes.Crystals (Basel). 2021 Aug;11(8):909. doi: 10.3390/cryst11080909. Epub 2021 Aug 2. Crystals (Basel). 2021. PMID: 35582460 Free PMC article.
-
Optimization of Culture Conditions for Oxygen-Tolerant Regulatory [NiFe]-Hydrogenase Production from Ralstonia eutropha H16 in Escherichia coli.Microorganisms. 2021 May 31;9(6):1195. doi: 10.3390/microorganisms9061195. Microorganisms. 2021. PMID: 34073092 Free PMC article.
-
Developing high-affinity, oxygen-insensitive [NiFe]-hydrogenases as biocatalysts for energy conversion.Biochem Soc Trans. 2023 Oct 31;51(5):1921-1933. doi: 10.1042/BST20230120. Biochem Soc Trans. 2023. PMID: 37743798 Free PMC article. Review.
-
Implementation of a high cell density fed-batch for heterologous production of active [NiFe]-hydrogenase in Escherichia coli bioreactor cultivations.Microb Cell Fact. 2022 Sep 19;21(1):193. doi: 10.1186/s12934-022-01919-w. Microb Cell Fact. 2022. PMID: 36123684 Free PMC article.
References
Grants and funding
LinkOut - more resources
Full Text Sources
Miscellaneous

