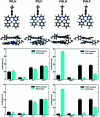
Ligand-controlled and nanoconfinement-boosted luminescence employing Pt(ii) and Pd(ii) complexes: from color-tunable aggregation-enhanced dual emitters towards self-referenced oxygen reporters
- PMID: 34164096
- PMCID: PMC8179353
- DOI: 10.1039/d0sc06126c
Ligand-controlled and nanoconfinement-boosted luminescence employing Pt(ii) and Pd(ii) complexes: from color-tunable aggregation-enhanced dual emitters towards self-referenced oxygen reporters
Abstract
In this work, we describe the synthesis, structural and photophysical characterization of four novel Pd(ii) and Pt(ii) complexes bearing tetradentate luminophoric ligands with high photoluminescence quantum yields (Φ L) and long excited state lifetimes (τ) at room temperature, where the results were interpreted by means of DFT calculations. Incorporation of fluorine atoms into the tetradentate ligand favors aggregation and thereby, a shortened average distance between the metal centers, which provides accessibility to metal-metal-to-ligand charge-transfer (3MMLCT) excimers acting as red-shifted energy traps if compared with the monomeric entities. This supramolecular approach provides an elegant way to enable room-temperature phosphorescence from Pd(ii) complexes, which are otherwise quenched by a thermal population of dissociative states due to a lower ligand field splitting. Encapsulation of these complexes in 100 nm-sized aminated polystyrene nanoparticles enables concentration-controlled aggregation-enhanced dual emission. This phenomenon facilitates the tunability of the absorption and emission colors while providing a rigidified environment supporting an enhanced Φ L up to about 80% and extended τ exceeding 100 μs. Additionally, these nanoarrays constitute rare examples for self-referenced oxygen reporters, since the phosphorescence of the aggregates is insensitive to external influences, whereas the monomeric species drop in luminescence lifetime and intensity with increasing triplet molecular dioxygen concentrations (diffusion-controlled quenching).
This journal is © The Royal Society of Chemistry.
Conflict of interest statement
There are no conflicts to declare.
Figures


Similar articles
-
Room-Temperature Phosphorescence from Pd(II) and Pt(II) Complexes as Supramolecular Luminophores: The Role of Self-Assembly, Metal-Metal Interactions, Spin-Orbit Coupling, and Ligand-Field Splitting.J Am Chem Soc. 2023 Feb 13. doi: 10.1021/jacs.2c09775. Online ahead of print. J Am Chem Soc. 2023. PMID: 36780431
-
Long-lived emissive intra-ligand triplet excited states (3IL): next generation luminescent oxygen sensing scheme and a case study with red phosphorescent diimine Pt(II) bis(acetylide) complexes containing ethynylated naphthalimide or pyrene subunits.Analyst. 2010 Nov;135(11):2832-40. doi: 10.1039/c0an00404a. Epub 2010 Sep 13. Analyst. 2010. PMID: 20835478
-
Photophysics and Excited State Dynamics of Cyclometalated [M(Phbpy)(CN)] (M = Ni, Pd, Pt) Complexes: A Theoretical and Experimental Study.Inorg Chem. 2021 Jun 21;60(12):8777-8789. doi: 10.1021/acs.inorgchem.1c00680. Epub 2021 Jun 7. Inorg Chem. 2021. PMID: 34097403
-
The Effect of Monodentate Co-Ligands on the Properties of Pt(II) Complexes Bearing a Tridentate C^N*N-Luminophore.Molecules. 2023 Nov 29;28(23):7834. doi: 10.3390/molecules28237834. Molecules. 2023. PMID: 38067570 Free PMC article.
-
From luminescence quenching to high-efficiency phosphorescence: a theoretical study on the monomeric and dimeric forms of platinum(II) complexes with both 2-pyridylimidazol-2-ylidene and bipyrazolate chelates.Phys Chem Chem Phys. 2021 Mar 11;23(9):5652-5664. doi: 10.1039/d0cp06269c. Phys Chem Chem Phys. 2021. PMID: 33656501
Cited by
-
Conformational Locking of the Geometry in Photoluminescent Cyclometalated N^C^N Ni(II) Complexes.Molecules. 2025 Apr 24;30(9):1901. doi: 10.3390/molecules30091901. Molecules. 2025. PMID: 40363710 Free PMC article.
-
Pt(II) Complexes with Tetradentate C^N*N^C Luminophores: From Supramolecular Interactions to Temperature-Sensing Materials with Memory and Optical Readouts.Molecules. 2023 Oct 30;28(21):7353. doi: 10.3390/molecules28217353. Molecules. 2023. PMID: 37959770 Free PMC article.
-
Exploring Simple Particle-Based Signal Amplification Strategies in a Heterogeneous Sandwich Immunoassay with Optical Detection.Anal Chem. 2024 Apr 2;96(13):5078-5085. doi: 10.1021/acs.analchem.3c03691. Epub 2024 Mar 18. Anal Chem. 2024. PMID: 38498677 Free PMC article.
-
Luminescence and Palladium: The Odd Couple.Molecules. 2023 Mar 15;28(6):2663. doi: 10.3390/molecules28062663. Molecules. 2023. PMID: 36985639 Free PMC article. Review.
-
Luminescent Anionic Cyclometalated Organoplatinum (II) Complexes with Terminal and Bridging Cyanide Ligand: Structural and Photophysical Properties.Inorg Chem. 2023 Jan 30;62(4):1513-1529. doi: 10.1021/acs.inorgchem.2c03668. Epub 2023 Jan 18. Inorg Chem. 2023. PMID: 36651903 Free PMC article.
References
LinkOut - more resources
Full Text Sources

