

Characteristics of hypoxic tumor microenvironment in non-small cell lung cancer, involving molecular patterns and prognostic signature
- PMID: 34164265
- PMCID: PMC8182713
- DOI: 10.21037/tlcr-20-1314
Characteristics of hypoxic tumor microenvironment in non-small cell lung cancer, involving molecular patterns and prognostic signature
Abstract
Background: The mechanisms of hypoxia or immune microenvironment in cancer have been studied respectively, but the role of hypoxia immune microenvironment in non-small cell lung cancer (NSCLC) still needs further exploration.
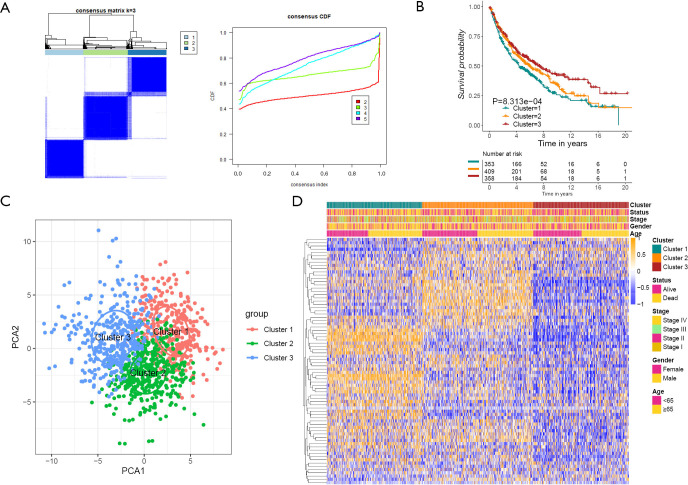
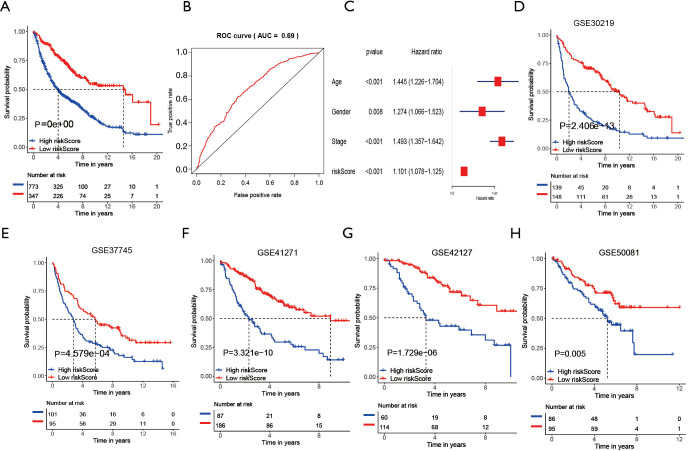
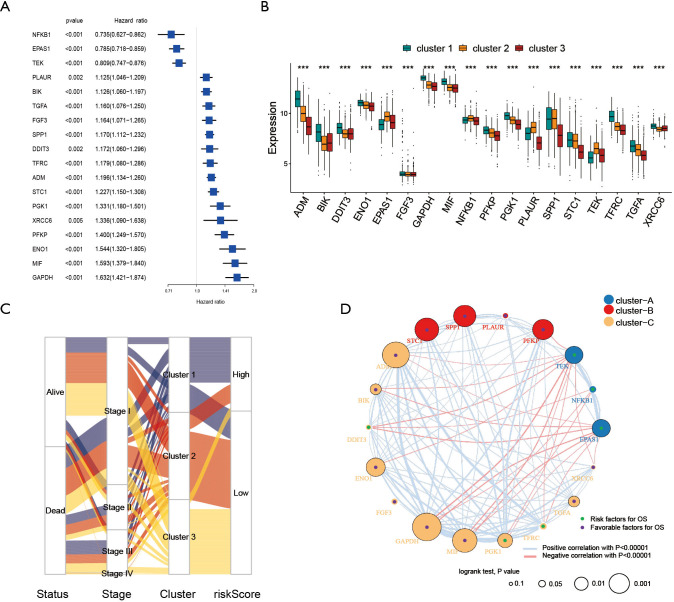
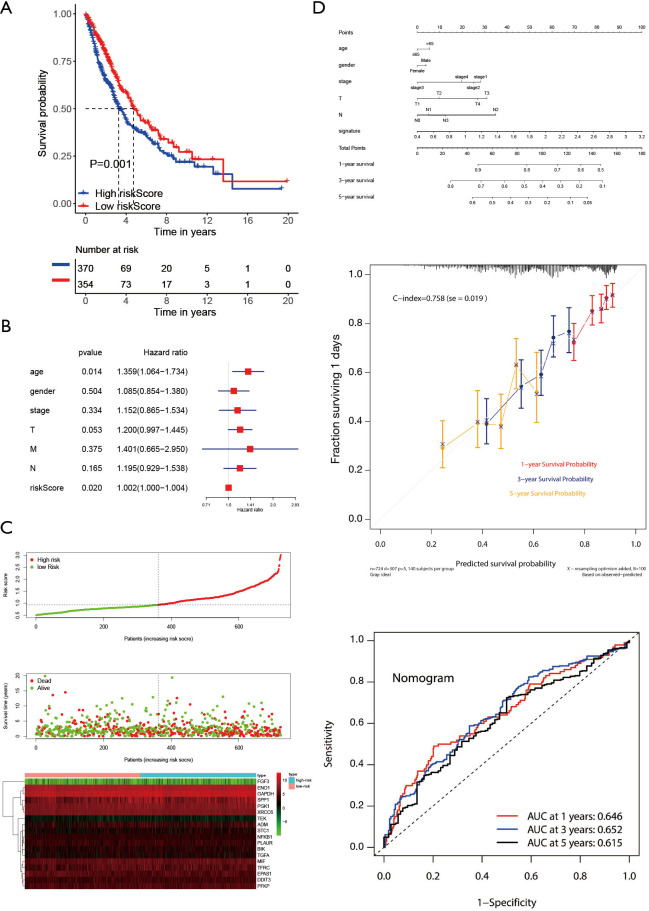
Methods: By applying the K-means algorithm, 1,121 patients with NSCLC were divided into three categories. We evaluated the constructed signature in order to link it with the prognosis, which was constructed by univariate and least absolute shrinkage operator (LASSO) Cox regression analysis.
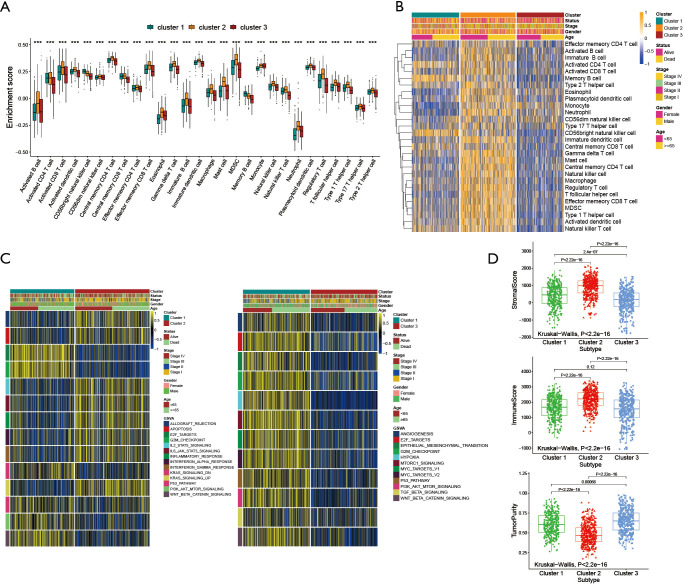
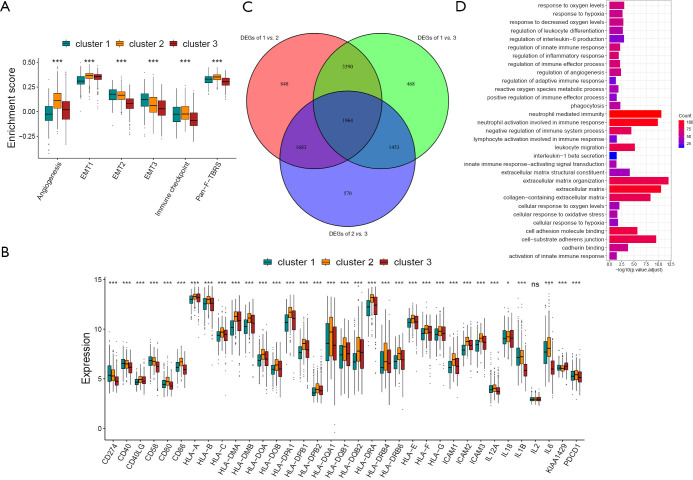
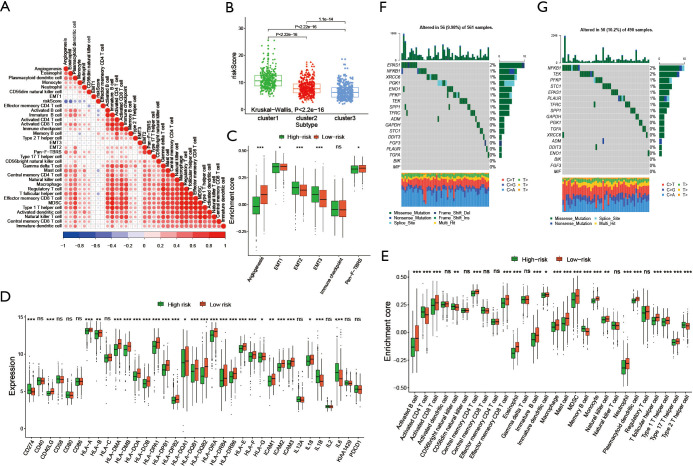
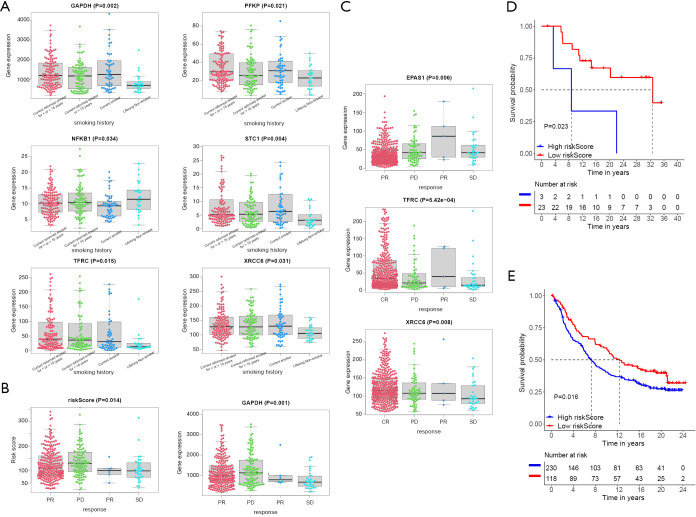
Results: A total of three clusters were obtained by clustering five Gene Expression Omnibus (GEO) data sets. Gene Set Variation Analysis (GSVA) and immune infiltration analysis were performed to explore the biological behavior. Cluster one presented an activated state of oncogenic pathways, and compared with the other two clusters, the median risk score was the highest, which was the reason for its poor survival. Cluster three showed that the immune pathway was active and the median risk score was the lowest, so the survival was the best. However, cluster two presented a state in which both immune and matrix pathways were activate. This was manifested as mutual antagonism, and its risk score was in the middle. Its survival was in the middle.
Conclusions: This work revealed the role of hypoxia related genes (HRGs) modification in tumor microenvironment, which was conducive to our comprehensive analysis of the prognosis of NSCLC, and provided direction and guidance for clinical immunotherapy.
Keywords: Gene Set Variation Analysis (GSVA); Hypoxia related genes (HRGs); immune infiltration; prognosis.
2021 Translational Lung Cancer Research. All rights reserved.
Conflict of interest statement
Conflicts of Interest: All authors have completed the ICMJE uniform disclosure form (available at http://dx.doi.org/10.21037/tlcr-20-1314). The authors have no conflicts of interest to declare.
Figures
Similar articles
-
Novel hypoxia-related gene signature for predicting prognoses that correlate with the tumor immune microenvironment in NSCLC.Front Genet. 2023 Apr 6;14:1115308. doi: 10.3389/fgene.2023.1115308. eCollection 2023. Front Genet. 2023. PMID: 37091782 Free PMC article.
-
A combined hypoxia and immune gene signature for predicting survival and risk stratification in triple-negative breast cancer.Aging (Albany NY). 2021 Aug 2;13(15):19486-19509. doi: 10.18632/aging.203360. Epub 2021 Aug 2. Aging (Albany NY). 2021. PMID: 34341184 Free PMC article.
-
The Landscape of the Tumor Microenvironment in Skin Cutaneous Melanoma Reveals a Prognostic and Immunotherapeutically Relevant Gene Signature.Front Cell Dev Biol. 2021 Oct 1;9:739594. doi: 10.3389/fcell.2021.739594. eCollection 2021. Front Cell Dev Biol. 2021. PMID: 34660598 Free PMC article.
-
Identification of prognostic gene signature associated with microenvironment of lung adenocarcinoma.PeerJ. 2019 Nov 29;7:e8128. doi: 10.7717/peerj.8128. eCollection 2019. PeerJ. 2019. PMID: 31803536 Free PMC article.
-
A signature of tumor immune microenvironment genes associated with the prognosis of non‑small cell lung cancer.Oncol Rep. 2020 Mar;43(3):795-806. doi: 10.3892/or.2020.7464. Epub 2020 Jan 14. Oncol Rep. 2020. PMID: 32020214
Cited by
-
Identification of esophageal cancer tumor antigens and immune subtypes for guiding vaccine development.J Thorac Dis. 2025 May 30;17(5):3380-3399. doi: 10.21037/jtd-2025-233. Epub 2025 May 28. J Thorac Dis. 2025. PMID: 40529738 Free PMC article.
-
The Effect of Hypoxia and Hypoxia-Associated Pathways in the Regulation of Antitumor Response: Friends or Foes?Front Immunol. 2022 Feb 8;13:828875. doi: 10.3389/fimmu.2022.828875. eCollection 2022. Front Immunol. 2022. PMID: 35211123 Free PMC article. Review.
-
Clinical Application Perspectives of Lung Cancers 3D Tumor Microenvironment Models for In Vitro Cultures.Int J Mol Sci. 2022 Feb 18;23(4):2261. doi: 10.3390/ijms23042261. Int J Mol Sci. 2022. PMID: 35216378 Free PMC article. Review.
-
Advances in Genomic Data and Biomarkers: Revolutionizing NSCLC Diagnosis and Treatment.Cancers (Basel). 2023 Jul 3;15(13):3474. doi: 10.3390/cancers15133474. Cancers (Basel). 2023. PMID: 37444584 Free PMC article. Review.
References
LinkOut - more resources
Full Text Sources