

A Ferroptosis-Related lncRNAs Signature Predicts Prognosis and Immune Microenvironment for Breast Cancer
- PMID: 34164433
- PMCID: PMC8215711
- DOI: 10.3389/fmolb.2021.678877
A Ferroptosis-Related lncRNAs Signature Predicts Prognosis and Immune Microenvironment for Breast Cancer
Abstract
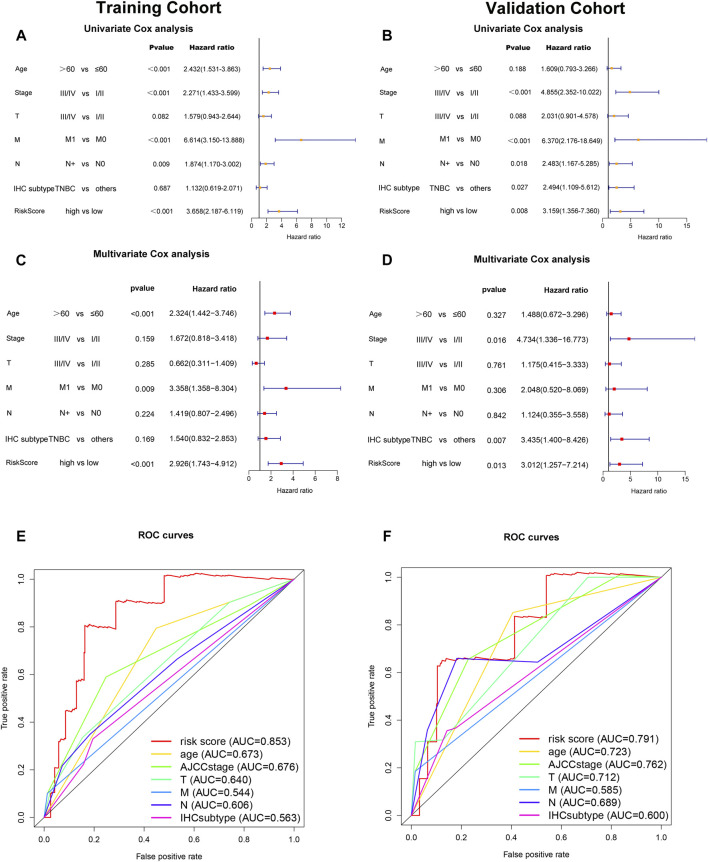
Background: Ferroptosis, a regulated cell death which is driven by the iron-dependent peroxidation of lipids, plays an important role in cancer. However, studies about ferroptosis-related Long non-coding RNAs (lncRNAs) in breast cancer (BC) are limited. Besides, the prognostic role of ferroptosis-related lncRNAs and their relationship to immune microenvironment in breast cancer remain unclear. This study aimed to explore the potential prognostic value of ferroptosis-related lncRNAs and their relationship to immune microenvironment in breast cancer. Methods: RNA-sequencing data of female breast cancer patients were downloaded from TCGA database. 937 patients were randomly separated into training or validation cohort in 2:1 ratio. Ferroptosis-related lncRNAs were screened by Pearson correlation analysis with 239 reported ferroptosis-related genes. A ferroptosis-related lncRNAs signature was constructed with univariate and multivariate Cox regression analyses in the training cohort, and its prognostic value was further tested in the validation cohort. Results: An 8-ferroptosis-related-lncRNAs signature was developed by multivariate Cox regression analysis to divide patients into two risk groups. Patients in the high-risk group had worse prognosis than patients in the low-risk group. Multivariate Cox regression analysis showed the risk score was an independent prognostic indicator. Receiver operating characteristic curve (ROC) analysis proved the predictive accuracy of the signature. The area under time-dependent ROC curve (AUC) reached 0.853 at 1 year, 0.802 at 2 years, 0.740 at 5 years in the training cohort and 0.791 at 1 year, 0.778 at 2 years, 0.722 at 5 years in the validation cohort. Further analysis demonstrated that immune-related pathways were significantly enriched in the high-risk group. Analysis of the immune cell infiltration landscape showed that breast cancer in the high-risk group tended be immunologically "cold". Conclusion: We identified a novel ferroptosis-related lncRNA signature which could precisely predict the prognosis of breast cancer patients. Ferroptosis-related lncRNAs may have a potential role in the process of anti-tumor immunity and serve as therapeutic targets for breast cancer.
Keywords: breast cancer; ferroptosis; lncRNA; prognostic signature; tumor immune microenvironment.
Copyright © 2021 Zhang, Ping, Du, Liang, Huang, Li, Deng and Tang.
Conflict of interest statement
The authors declare that the research was conducted in the absence of any commercial or financial relationships that could be construed as a potential conflict of interest.
Figures


Similar articles
-
A Novel Pyroptosis-Associated Long Non-coding RNA Signature Predicts Prognosis and Tumor Immune Microenvironment of Patients With Breast Cancer.Front Cell Dev Biol. 2021 Sep 20;9:727183. doi: 10.3389/fcell.2021.727183. eCollection 2021. Front Cell Dev Biol. 2021. PMID: 34616734 Free PMC article.
-
Construction of a ferroptosis-related five-lncRNA signature for predicting prognosis and immune response in thyroid carcinoma.Cancer Cell Int. 2022 Sep 29;22(1):296. doi: 10.1186/s12935-022-02674-z. Cancer Cell Int. 2022. PMID: 36175889 Free PMC article.
-
Predictive role of ferroptosis-related long non-coding RNAs in bladder cancer and their association with immune microenvironment and immunotherapy response.World J Surg Oncol. 2022 Feb 24;20(1):47. doi: 10.1186/s12957-022-02514-4. World J Surg Oncol. 2022. PMID: 35209909 Free PMC article.
-
Ferroptosis-related long non-coding RNA signature predicts the prognosis of hepatocellular carcinoma: A Review.Medicine (Baltimore). 2022 Nov 25;101(47):e31747. doi: 10.1097/MD.0000000000031747. Medicine (Baltimore). 2022. PMID: 36451456 Free PMC article. Review.
-
Role of ferroptosis and ferroptosis-related long non'coding RNA in breast cancer.Cell Mol Biol Lett. 2024 Mar 26;29(1):40. doi: 10.1186/s11658-024-00560-2. Cell Mol Biol Lett. 2024. PMID: 38528461 Free PMC article. Review.
Cited by
-
Expression of Ferroptosis-Related Genes is Correlated with Immune Microenvironment in Diabetic Kidney Disease.Diabetes Metab Syndr Obes. 2022 Dec 28;15:4049-4064. doi: 10.2147/DMSO.S388724. eCollection 2022. Diabetes Metab Syndr Obes. 2022. PMID: 36597492 Free PMC article.
-
Prognostic Model Construction and Immune Microenvironment Analysis of Breast Cancer Based on Ferroptosis-Related lncRNAs.Int J Gen Med. 2021 Dec 17;14:9817-9831. doi: 10.2147/IJGM.S342783. eCollection 2021. Int J Gen Med. 2021. PMID: 34949938 Free PMC article.
-
Novel insights into the pathogenesis of thyroid eye disease through ferroptosis-related gene signature and immune infiltration analysis.Aging (Albany NY). 2024 Mar 25;16(7):6008-6034. doi: 10.18632/aging.205685. Epub 2024 Mar 25. Aging (Albany NY). 2024. PMID: 38536014 Free PMC article.
-
Identification of cuproptosis-related subtypes, construction of a prognosis model, and tumor microenvironment landscape in gastric cancer.Front Immunol. 2022 Nov 21;13:1056932. doi: 10.3389/fimmu.2022.1056932. eCollection 2022. Front Immunol. 2022. PMID: 36479114 Free PMC article.
-
m6A-Related lncRNAs Predict Overall Survival of Patients and Regulate the Tumor Immune Microenvironment in Osteosarcoma.Comput Intell Neurosci. 2022 Aug 8;2022:9315283. doi: 10.1155/2022/9315283. eCollection 2022. Comput Intell Neurosci. 2022. PMID: 35978902 Free PMC article.
References
LinkOut - more resources
Full Text Sources