

Elderly Male With Cardiovascular-Related Comorbidities Has a Higher Rate of Fatal Outcomes: A Retrospective Study in 602 Patients With Coronavirus Disease 2019
- PMID: 34164443
- PMCID: PMC8215131
- DOI: 10.3389/fcvm.2021.680604
Elderly Male With Cardiovascular-Related Comorbidities Has a Higher Rate of Fatal Outcomes: A Retrospective Study in 602 Patients With Coronavirus Disease 2019
Abstract
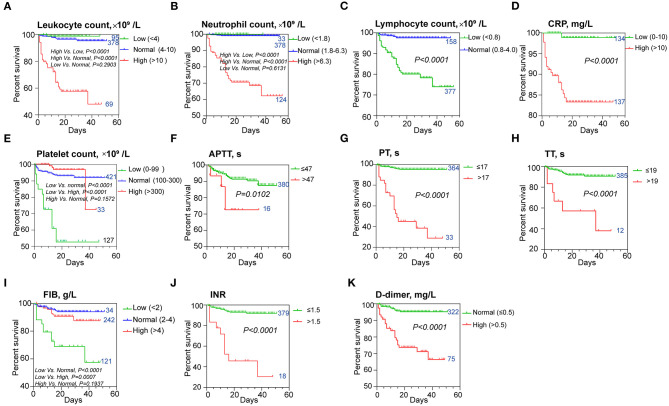
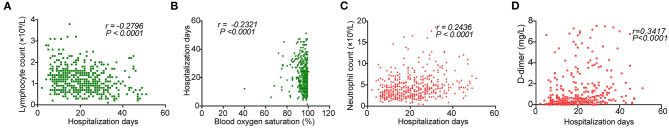
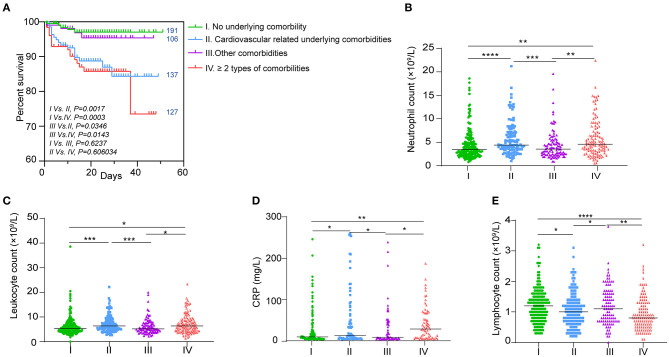
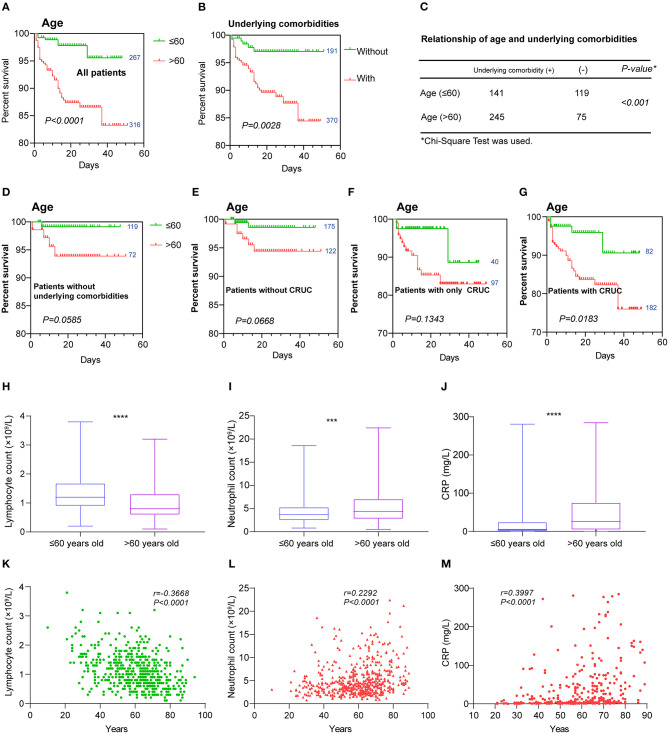
Elderly with comorbidities have shown a higher rate of fatal outcomes when suffering coronavirus disease 2019 (COVID-19). However, a delineation of clinical significances of hematologic indices and underlying comorbidities in the progression and outcome of COVID-19 remains undefined. Six hundred two COVID-19 patients with established clinical outcomes (discharged or deceased) from Hankou Hospital of Wuhan, China between January 14, 2020 and February 29, 2020 were retrospectively analyzed. Of the 602 patients with COVID-19, 539 were discharged and 63 died in the hospital. The deceased group showed higher leukocyte and neutrophil counts but lower lymphocyte and platelet counts. Longer activated partial thromboplastin time (APTT) and prothrombin time (PT), as well as higher D-dimer and C-reactive protein levels, were found in non-survivors. Our observations suggest that these parameters could serve as potential predictors for the fatal outcome and in the discharged group. A higher neutrophil count and D-dimer level but lower lymphocyte were associated with a longer duration of hospitalization. A multivariable Cox regression analysis showed that higher neutrophil count, prolonged PT, and low lymphocyte count were risk factors for patients with COVID-19. Also, we found an association of lower lymphocyte count and higher C-reactive protein levels with the elderly group and those with cardiovascular-related comorbidities. The significantly different hematologic profiles between survivors and non-survivors support that distinct hematologic signatures in COVID-19 patients will dictate different outcomes as a prognostic marker for recovery or fatality. Lymphopenia and aggressive inflammatory response might be major causes for fatal outcomes in the elderly male and especially those with cardiovascular-related comorbidities.
Keywords: COVID-19; aggressive inflammatory response; cardiovascular-related comorbidities; elderly male; lymphopenia.
Copyright © 2021 Zhan, Li, Hu, Li, Kong, Ng, Chen, He, Huang and Yang.
Conflict of interest statement
The authors declare that the research was conducted in the absence of any commercial or financial relationships that could be construed as a potential conflict of interest.
Figures


Similar articles
-
Prognostic Factors in COVID-19 Patients With New Neurological Manifestations: A Retrospective Cohort Study in a Romanian Neurology Department.Front Aging Neurosci. 2021 Jun 17;13:645611. doi: 10.3389/fnagi.2021.645611. eCollection 2021. Front Aging Neurosci. 2021. PMID: 34220483 Free PMC article.
-
Hematologic predictors of mortality in hospitalized patients with COVID-19: a comparative study.Hematology. 2020 Dec;25(1):383-388. doi: 10.1080/16078454.2020.1833435. Hematology. 2020. PMID: 33124971
-
Prolonged prothrombin time at admission predicts poor clinical outcome in COVID-19 patients.World J Clin Cases. 2020 Oct 6;8(19):4370-4379. doi: 10.12998/wjcc.v8.i19.4370. World J Clin Cases. 2020. PMID: 33083396 Free PMC article.
-
Risk factors influencing the prognosis of elderly patients infected with COVID-19: a clinical retrospective study in Wuhan, China.Aging (Albany NY). 2020 Jul 11;12(13):12504-12516. doi: 10.18632/aging.103631. Epub 2020 Jul 11. Aging (Albany NY). 2020. PMID: 32651993 Free PMC article.
-
Hematologic, biochemical and immune biomarker abnormalities associated with severe illness and mortality in coronavirus disease 2019 (COVID-19): a meta-analysis.Clin Chem Lab Med. 2020 Jun 25;58(7):1021-1028. doi: 10.1515/cclm-2020-0369. Clin Chem Lab Med. 2020. PMID: 32286245 Review.
Cited by
-
SERPINE1 rs6092 Variant Is Related to Plasma Coagulation Proteins in Patients with Severe COVID-19 from a Tertiary Care Hospital.Biology (Basel). 2022 Apr 14;11(4):595. doi: 10.3390/biology11040595. Biology (Basel). 2022. PMID: 35453794 Free PMC article.
-
Characteristics and outcomes of severe COVID-19 in hospitalized patients with cardiovascular diseases in the Amazonian region of Brazil: a retrospective cohort.Sci Rep. 2022 Nov 2;12(1):18472. doi: 10.1038/s41598-022-23365-9. Sci Rep. 2022. PMID: 36323818 Free PMC article.
References
LinkOut - more resources
Full Text Sources
Research Materials