. 2021 Jun 17;5(6):1436-1454.
doi: 10.1021/acsearthspacechem.1c00049. Epub 2021 May 13.

HCOOH in the remote atmosphere: Constraints from Atmospheric Tomography (ATom) airborne observations

Affiliations

HCOOH in the remote atmosphere: Constraints from Atmospheric Tomography (ATom) airborne observations

Xin Chen et al. ACS Earth Space Chem. .

Abstract

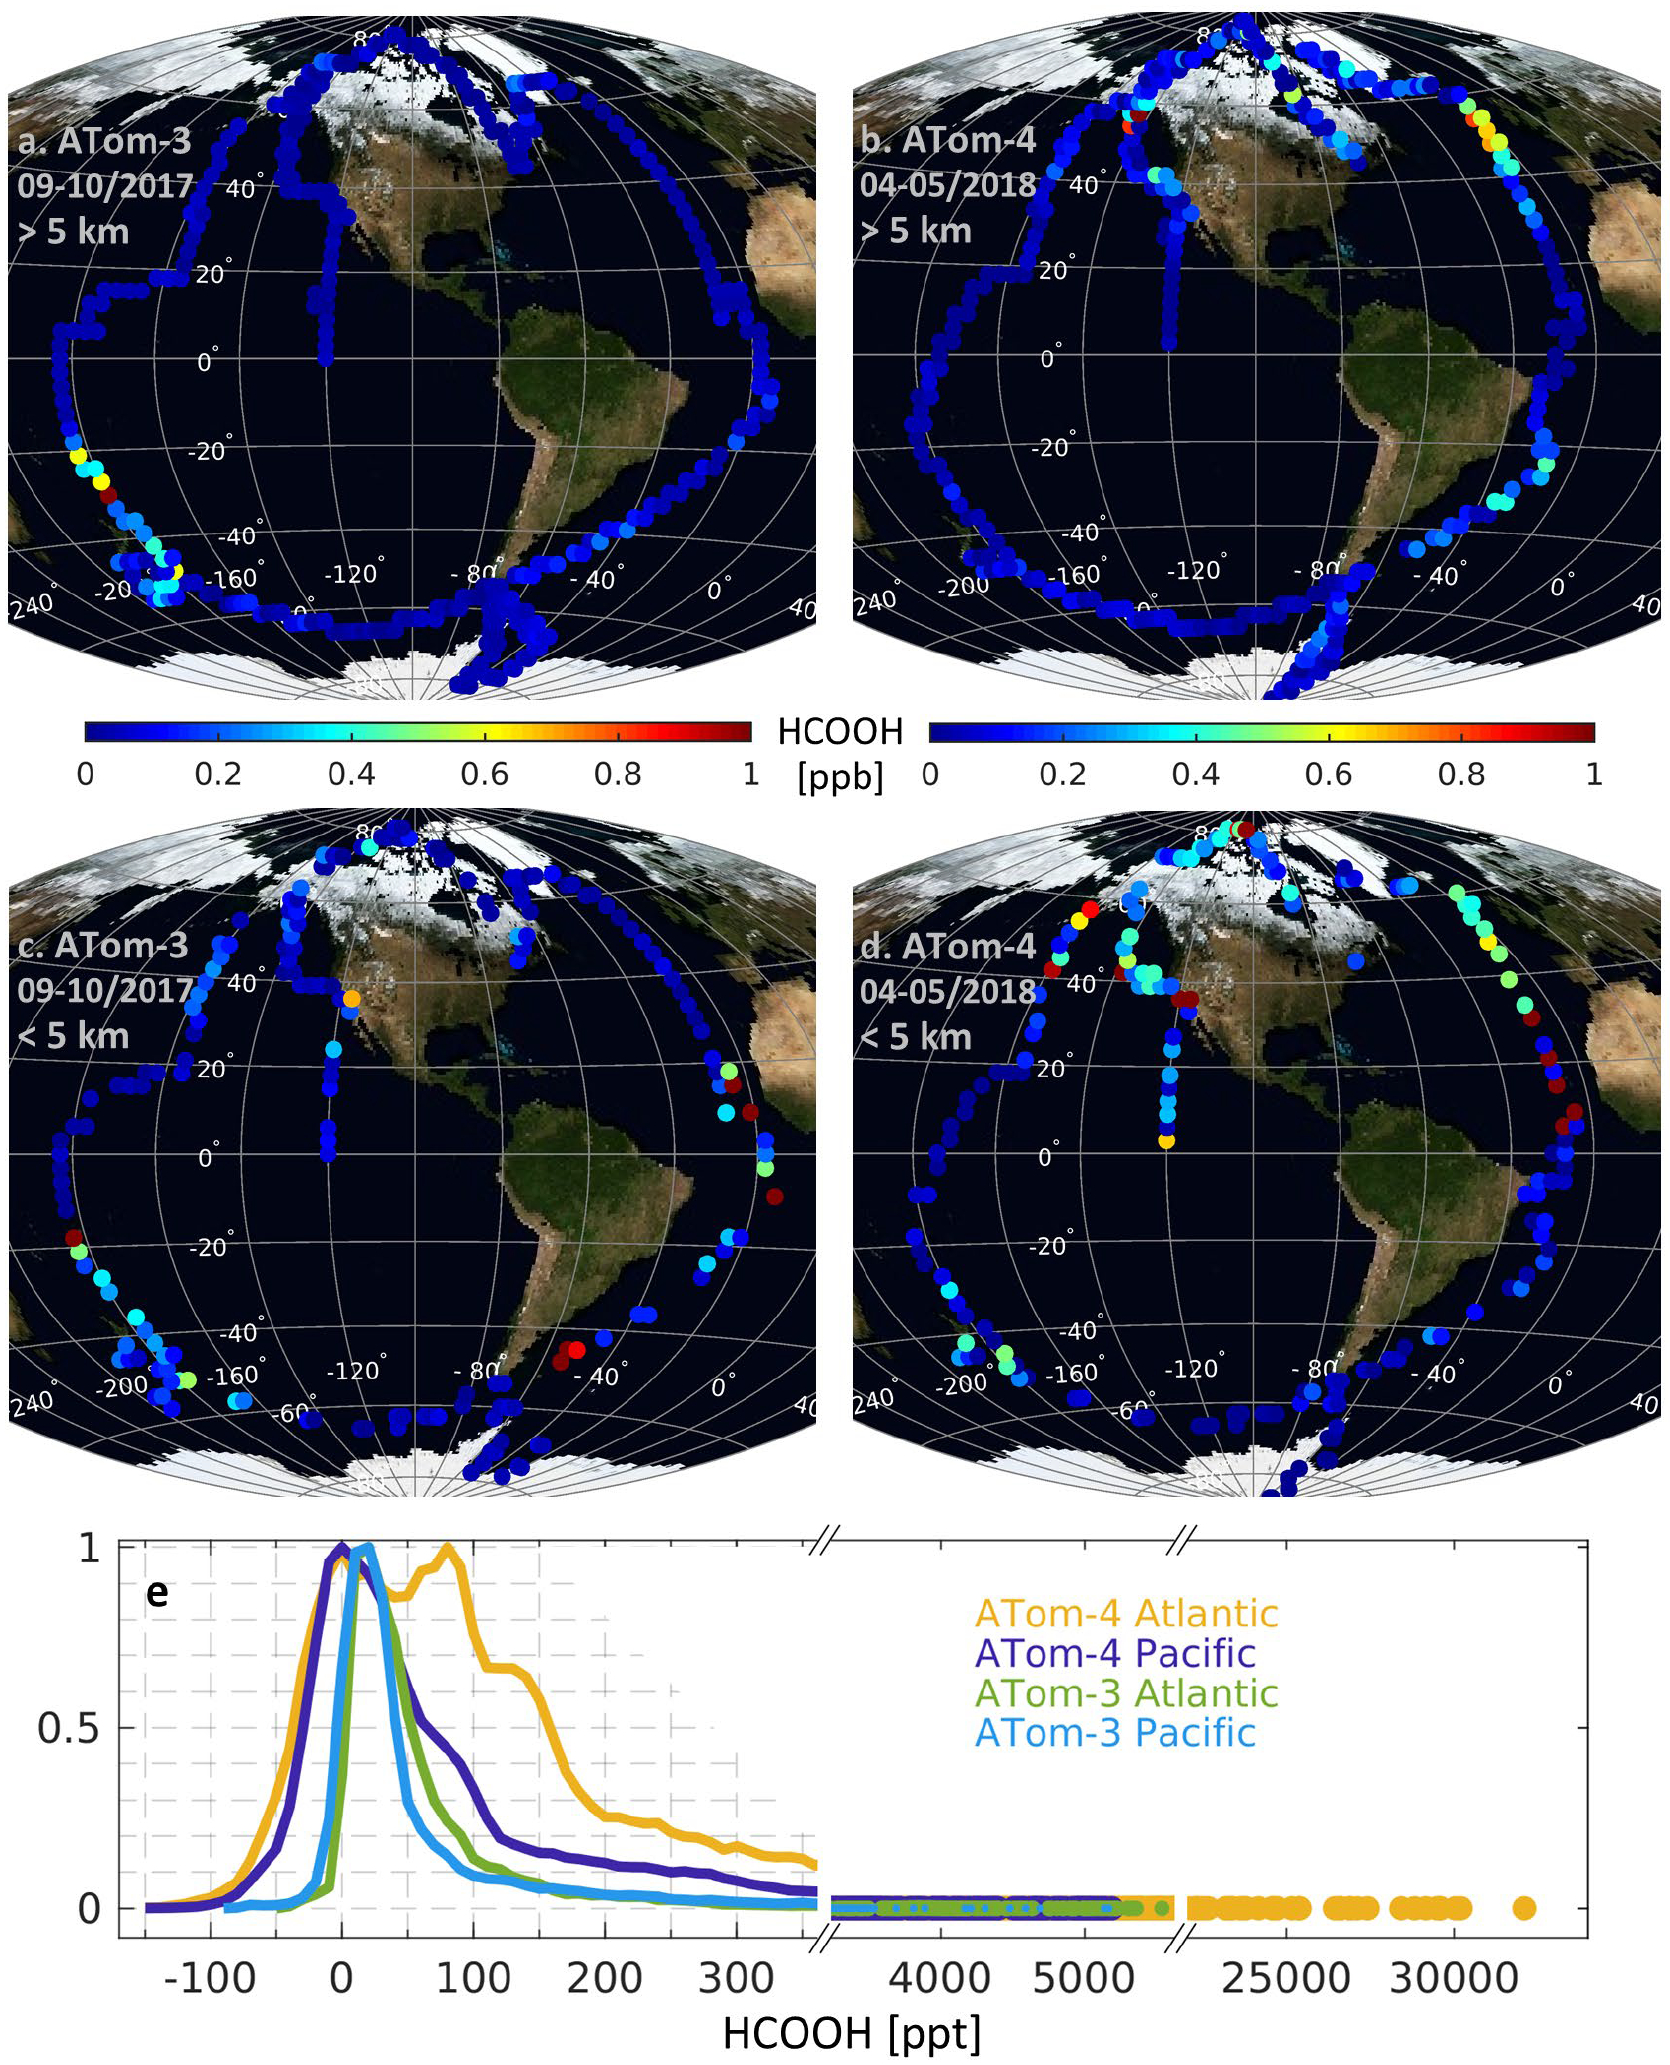
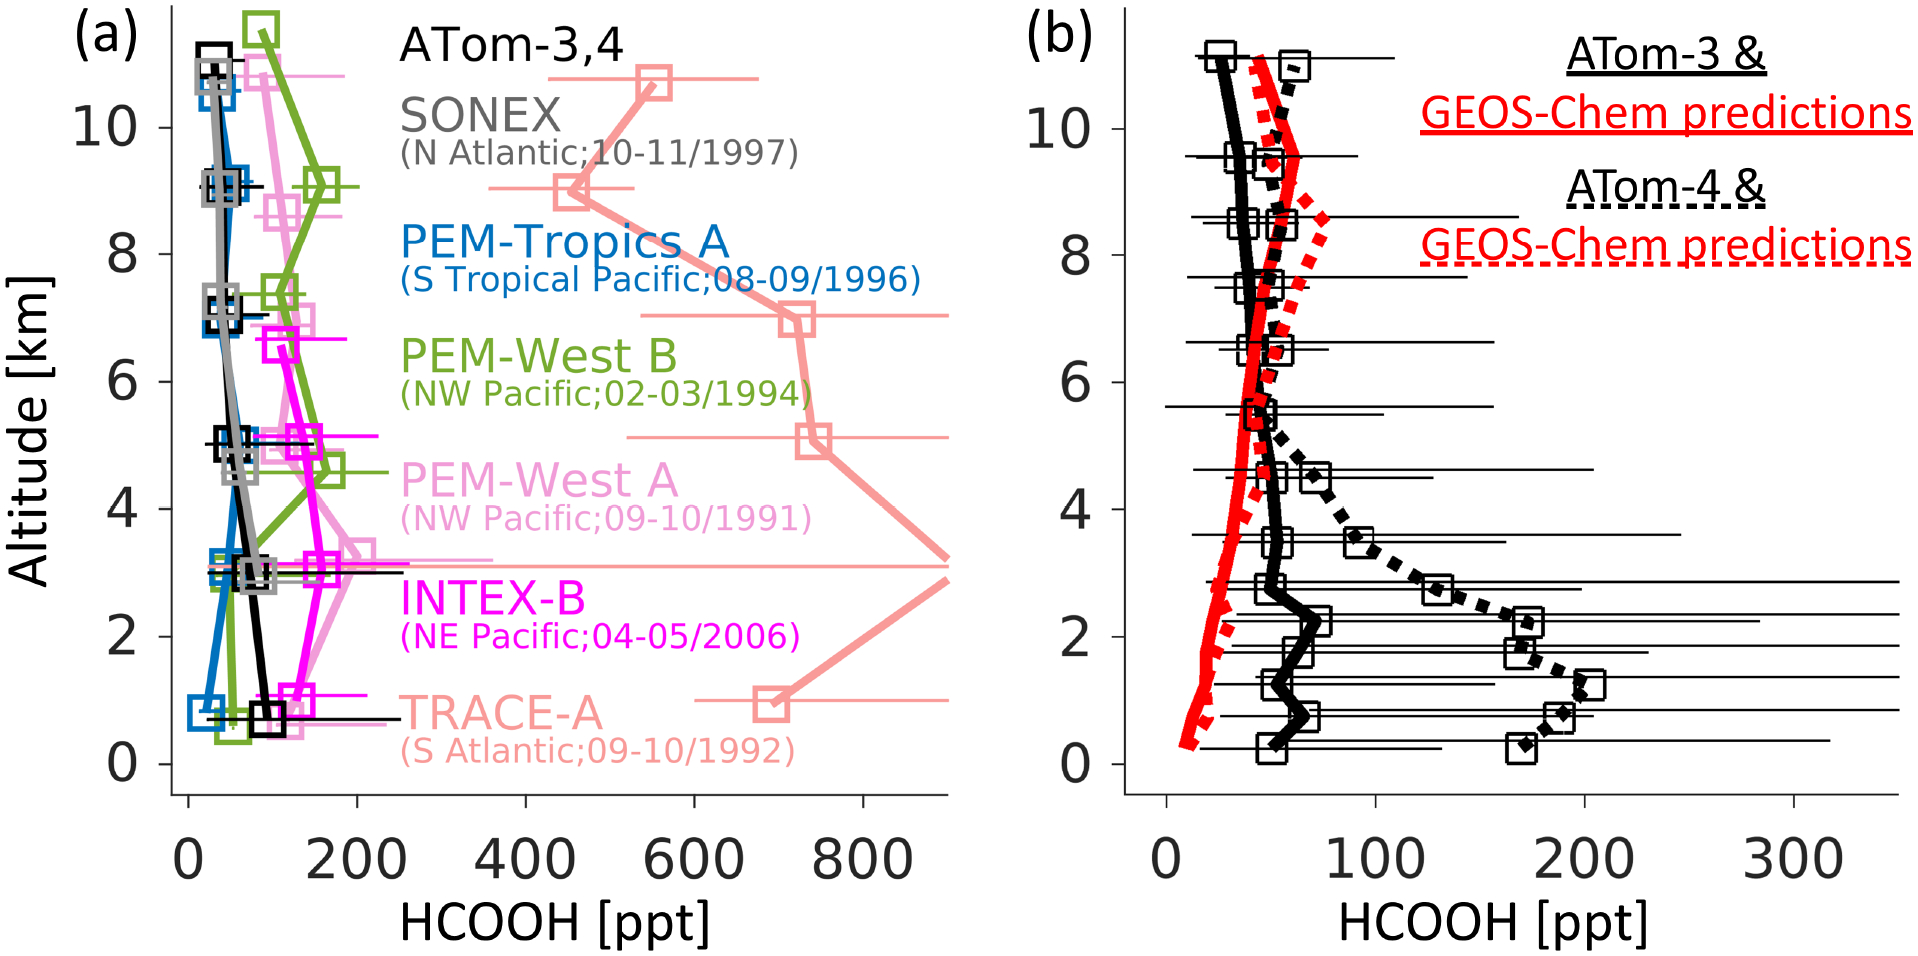
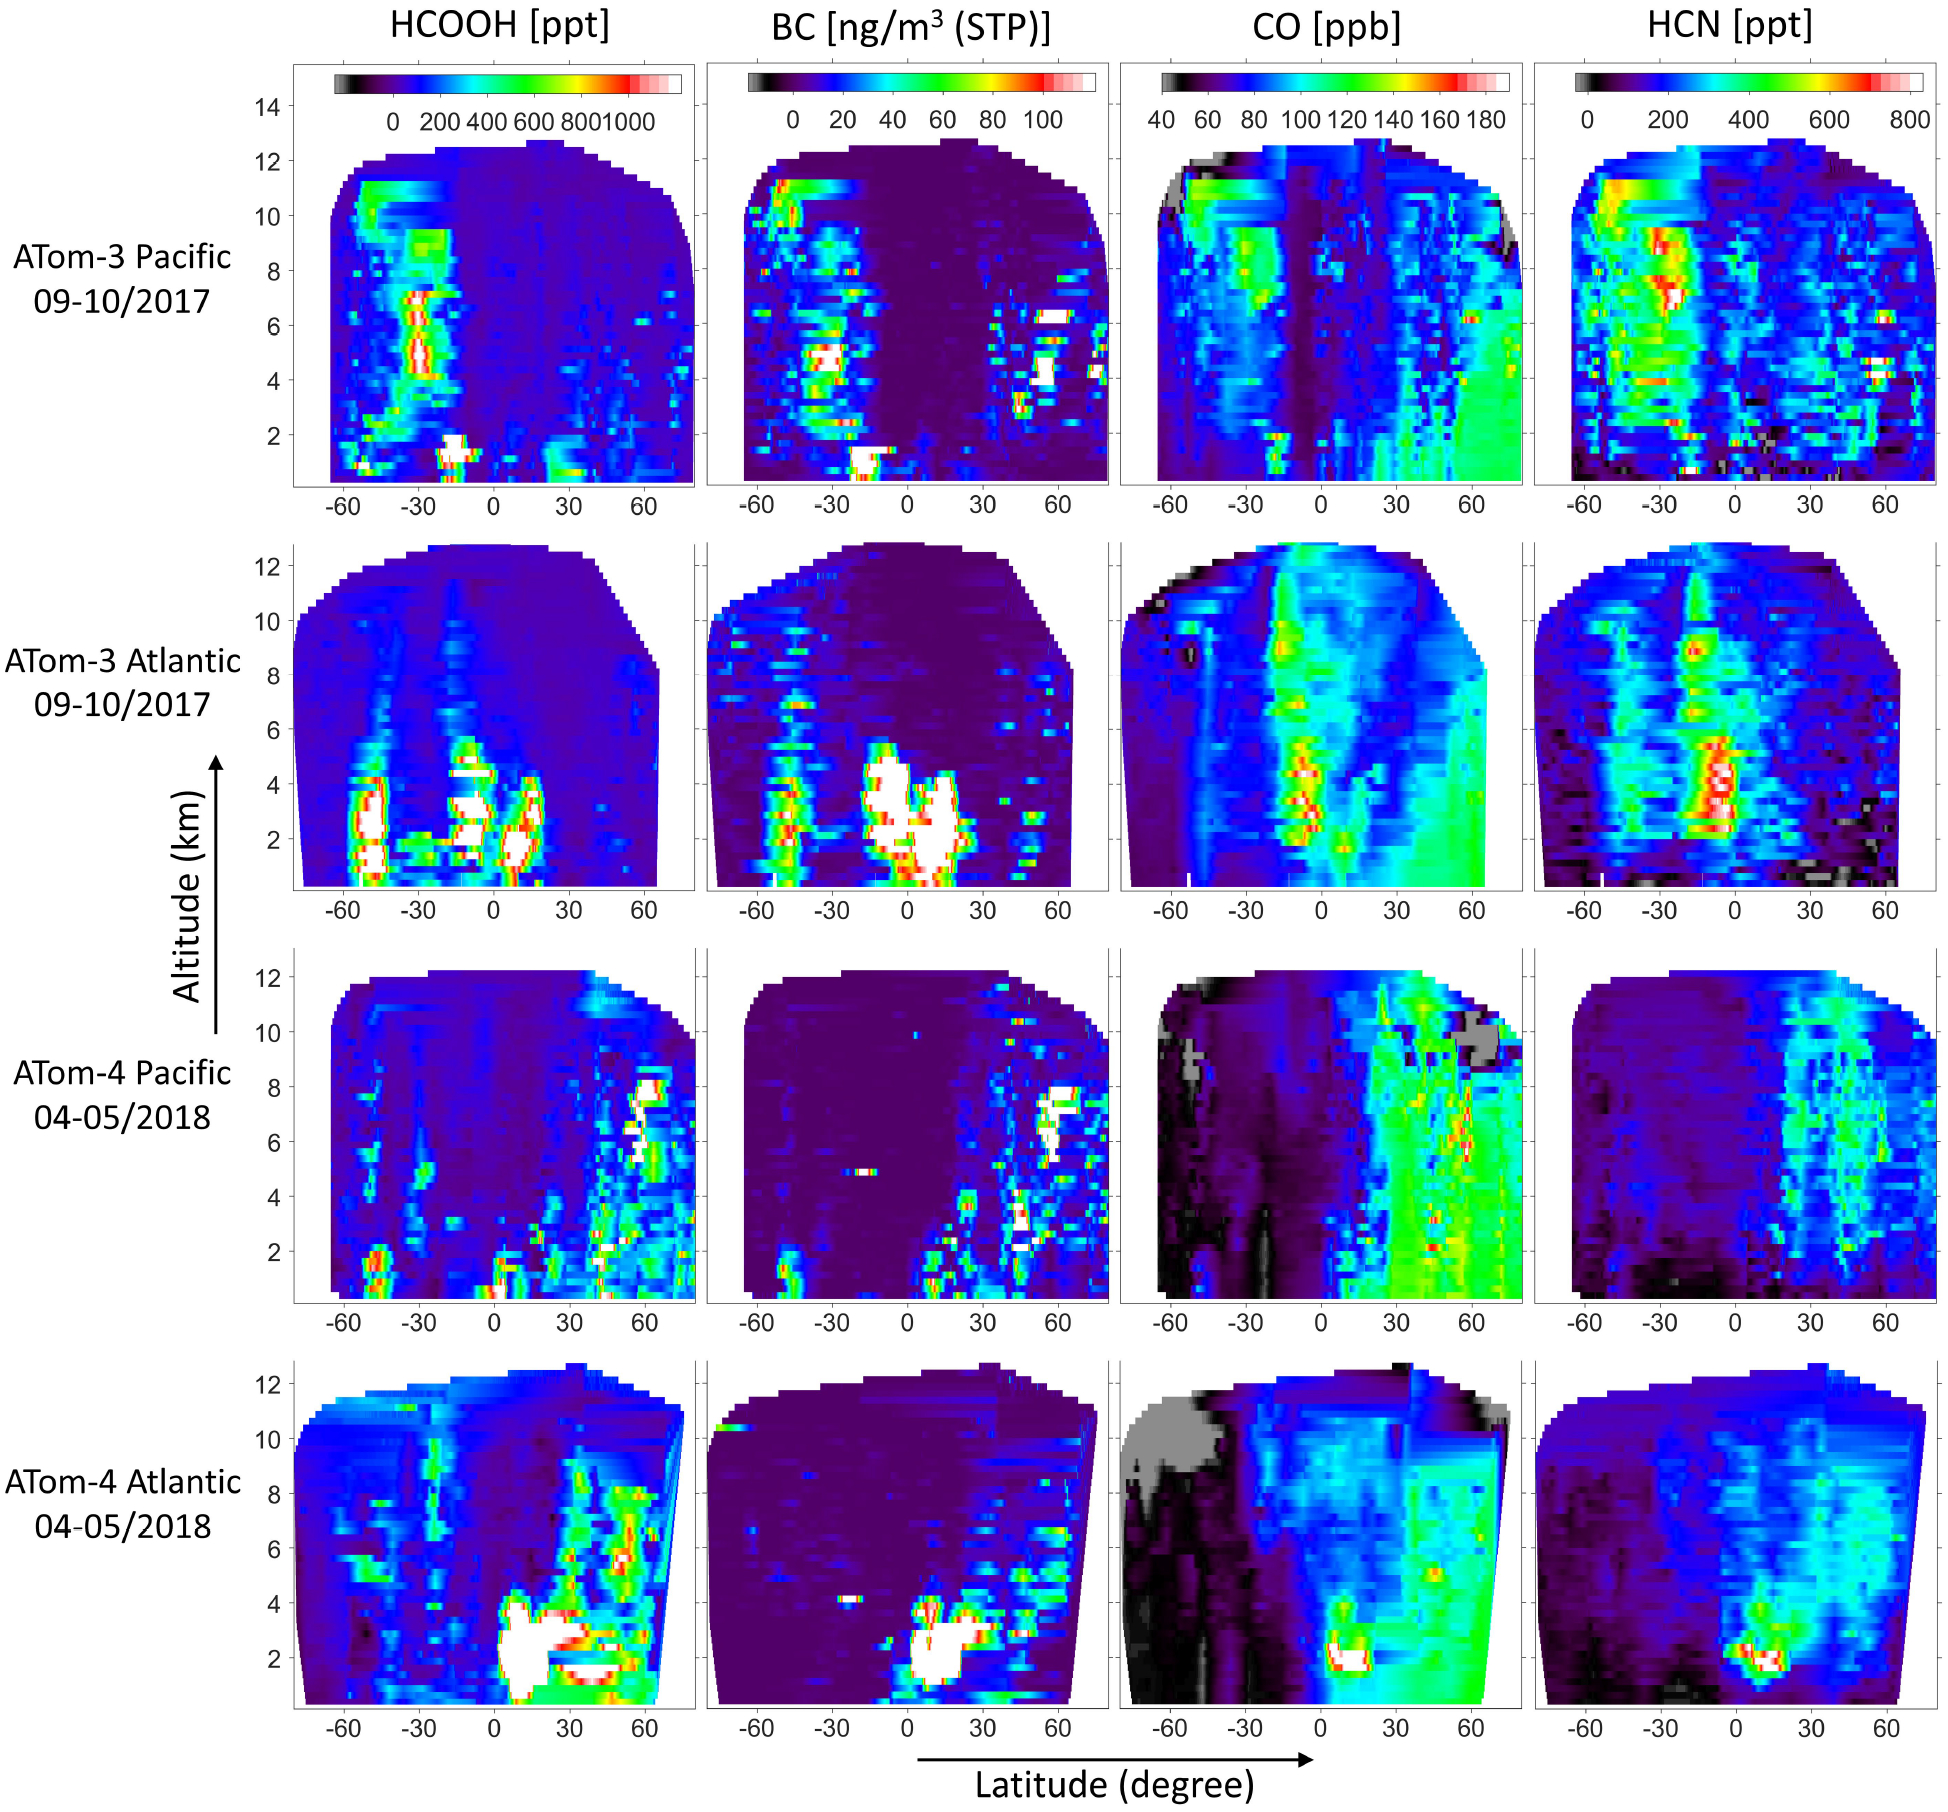
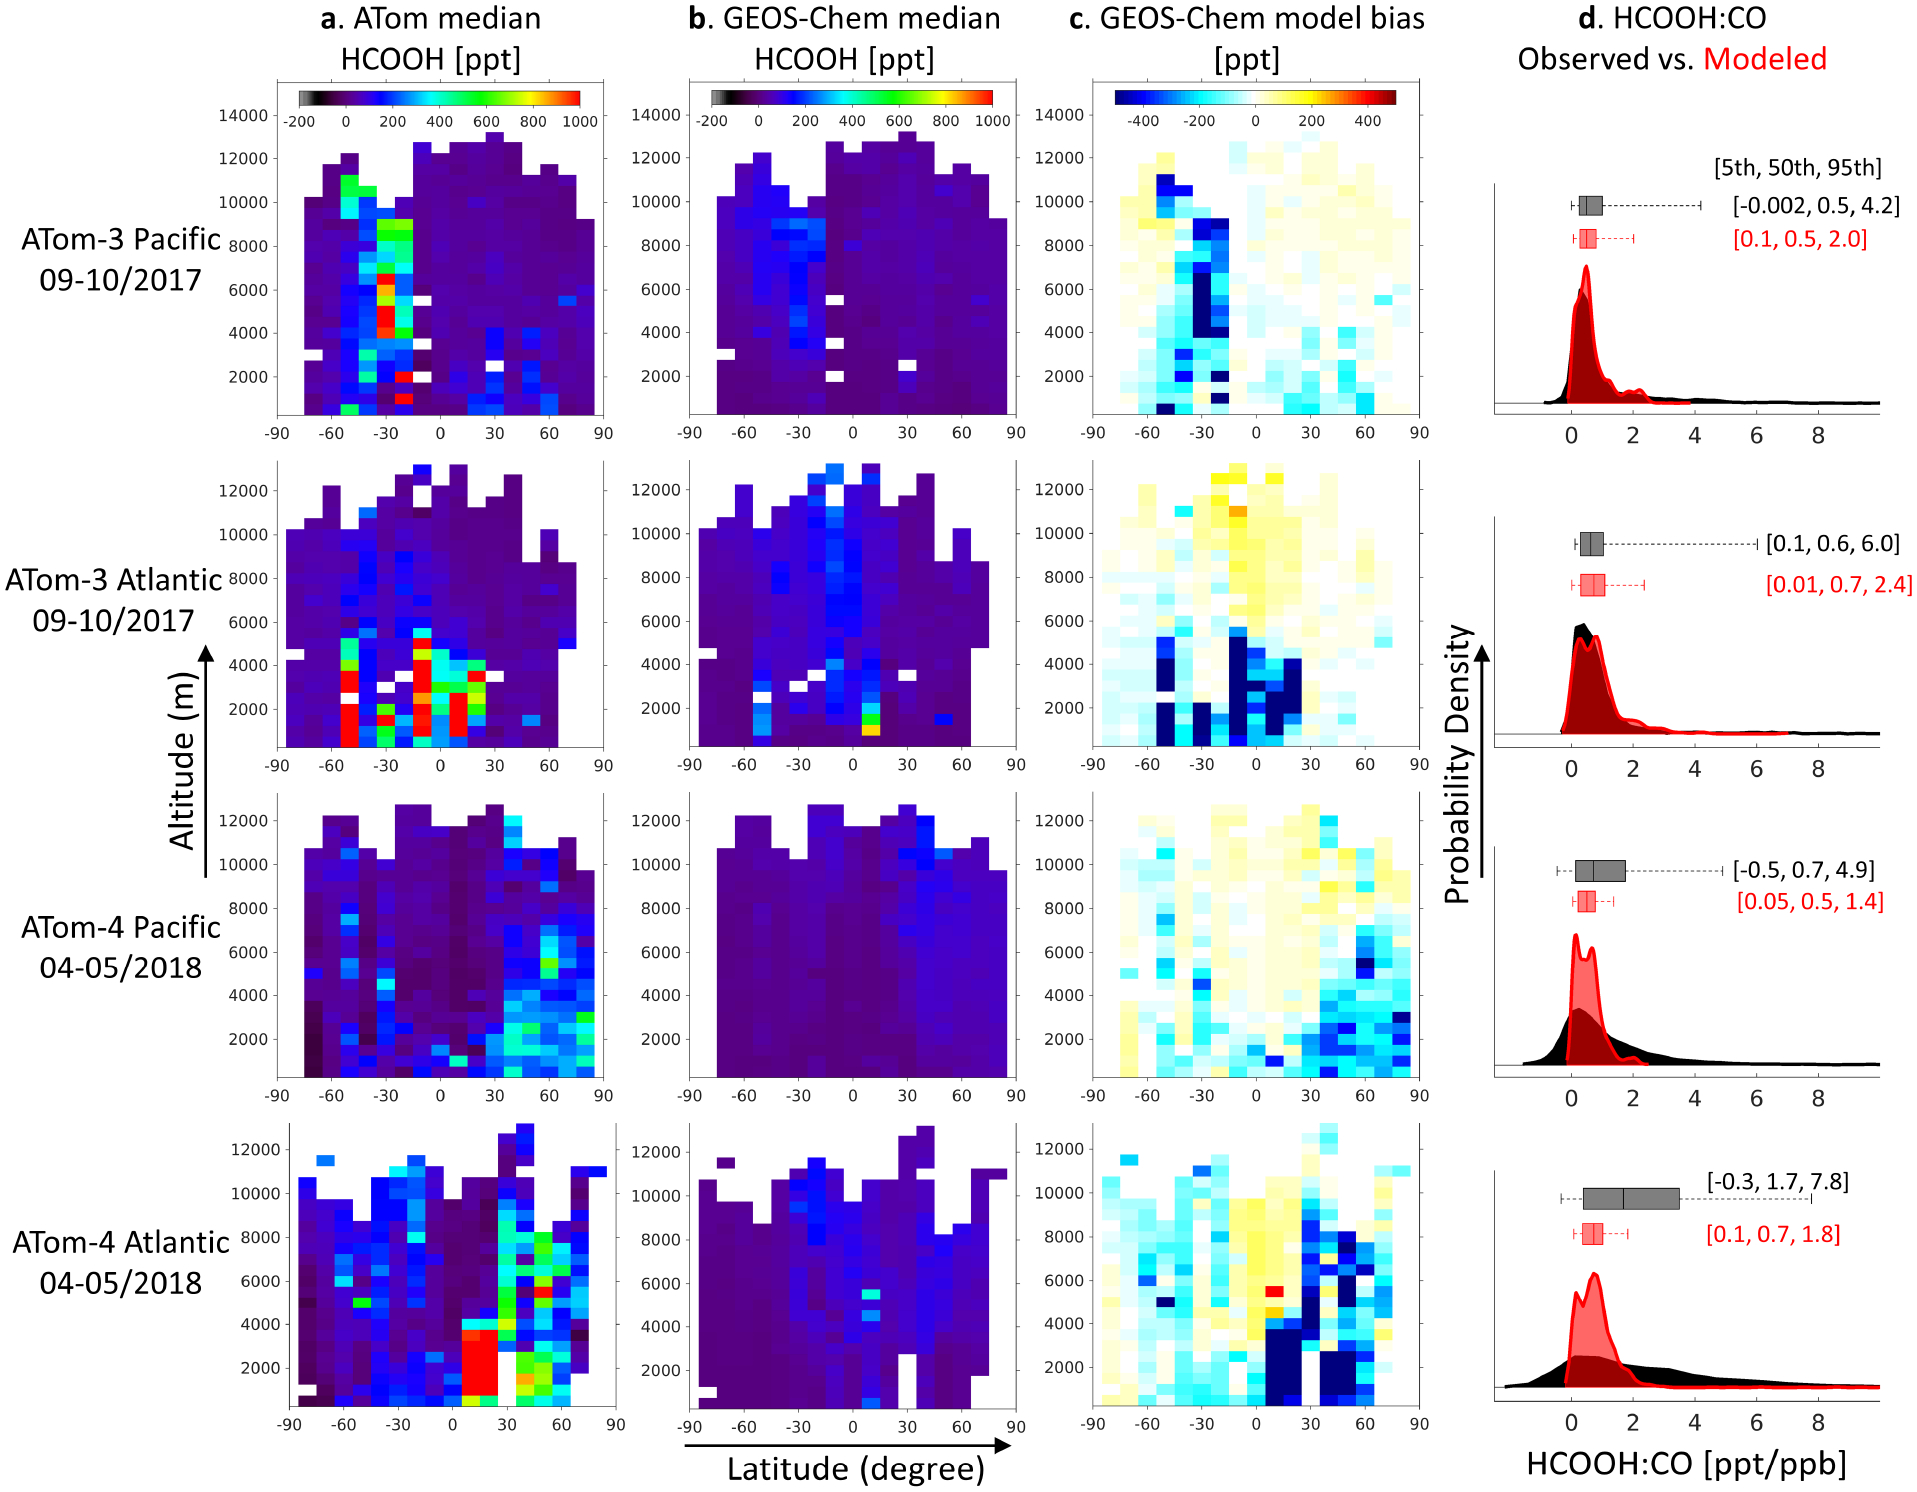
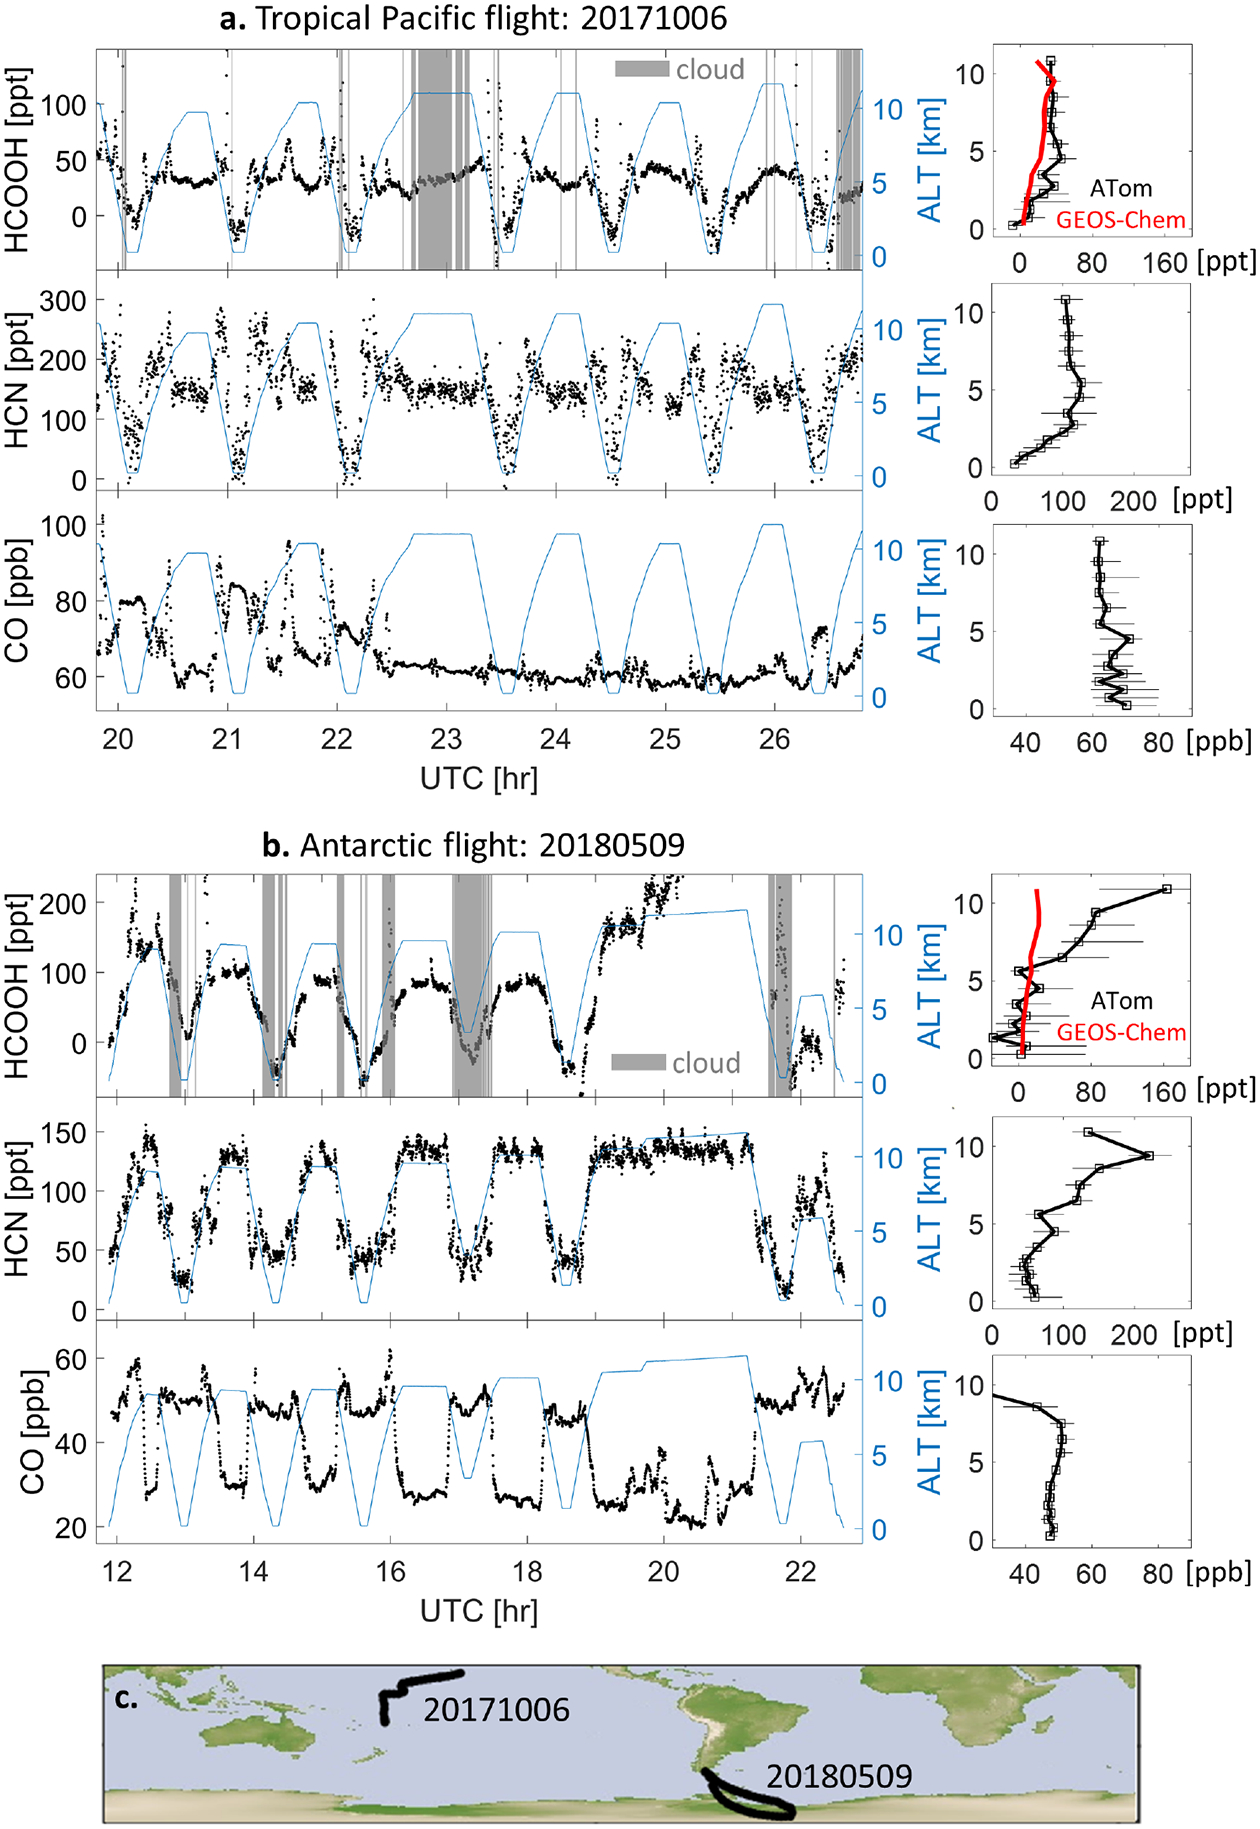
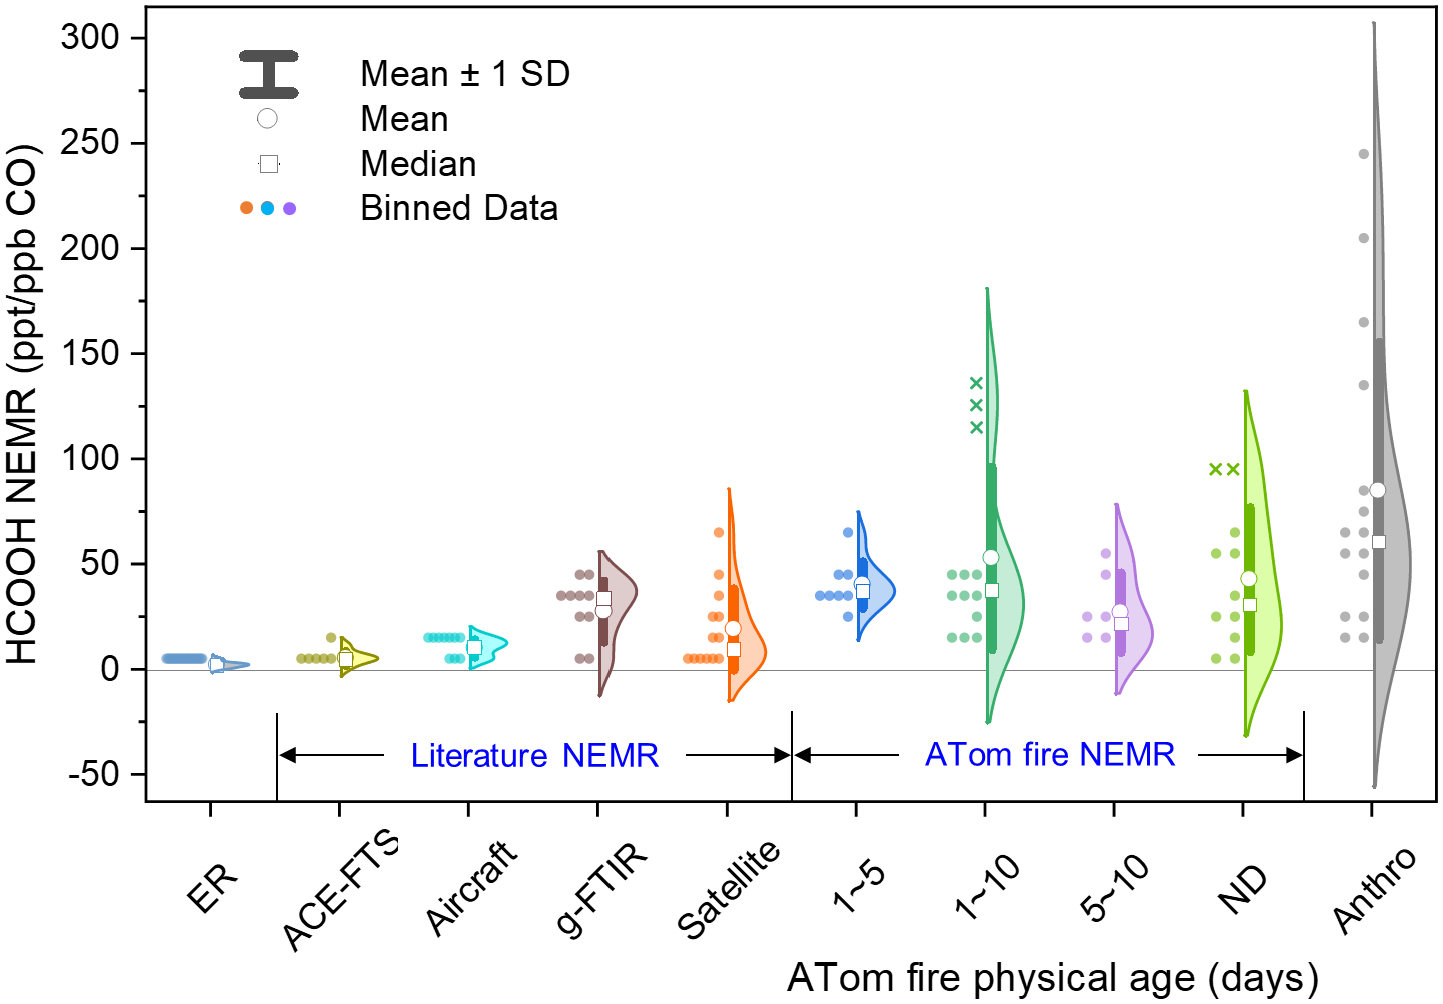
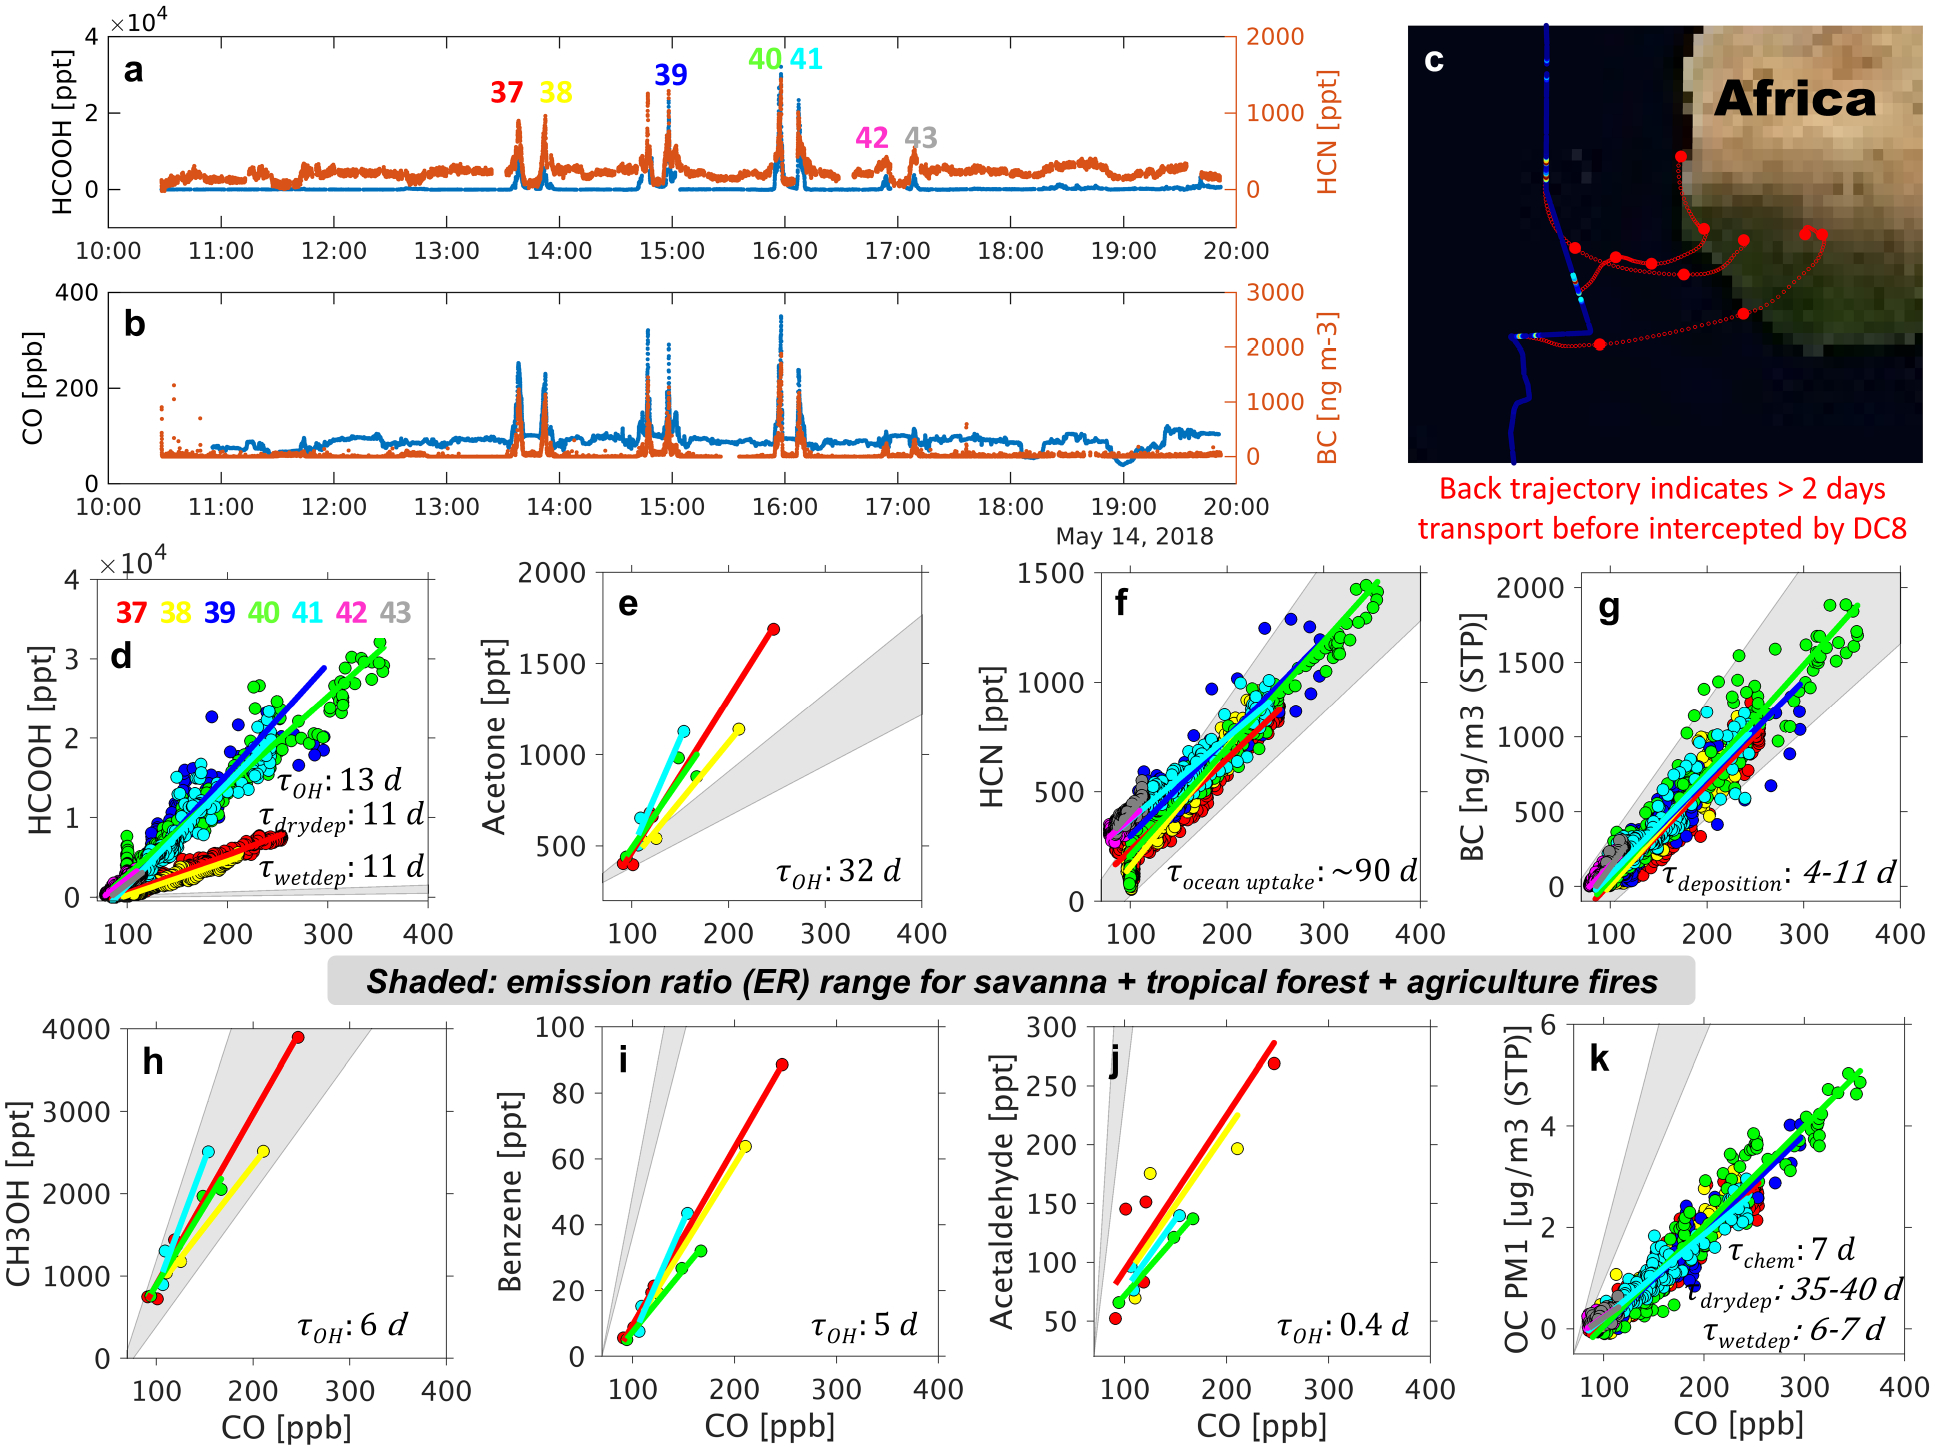
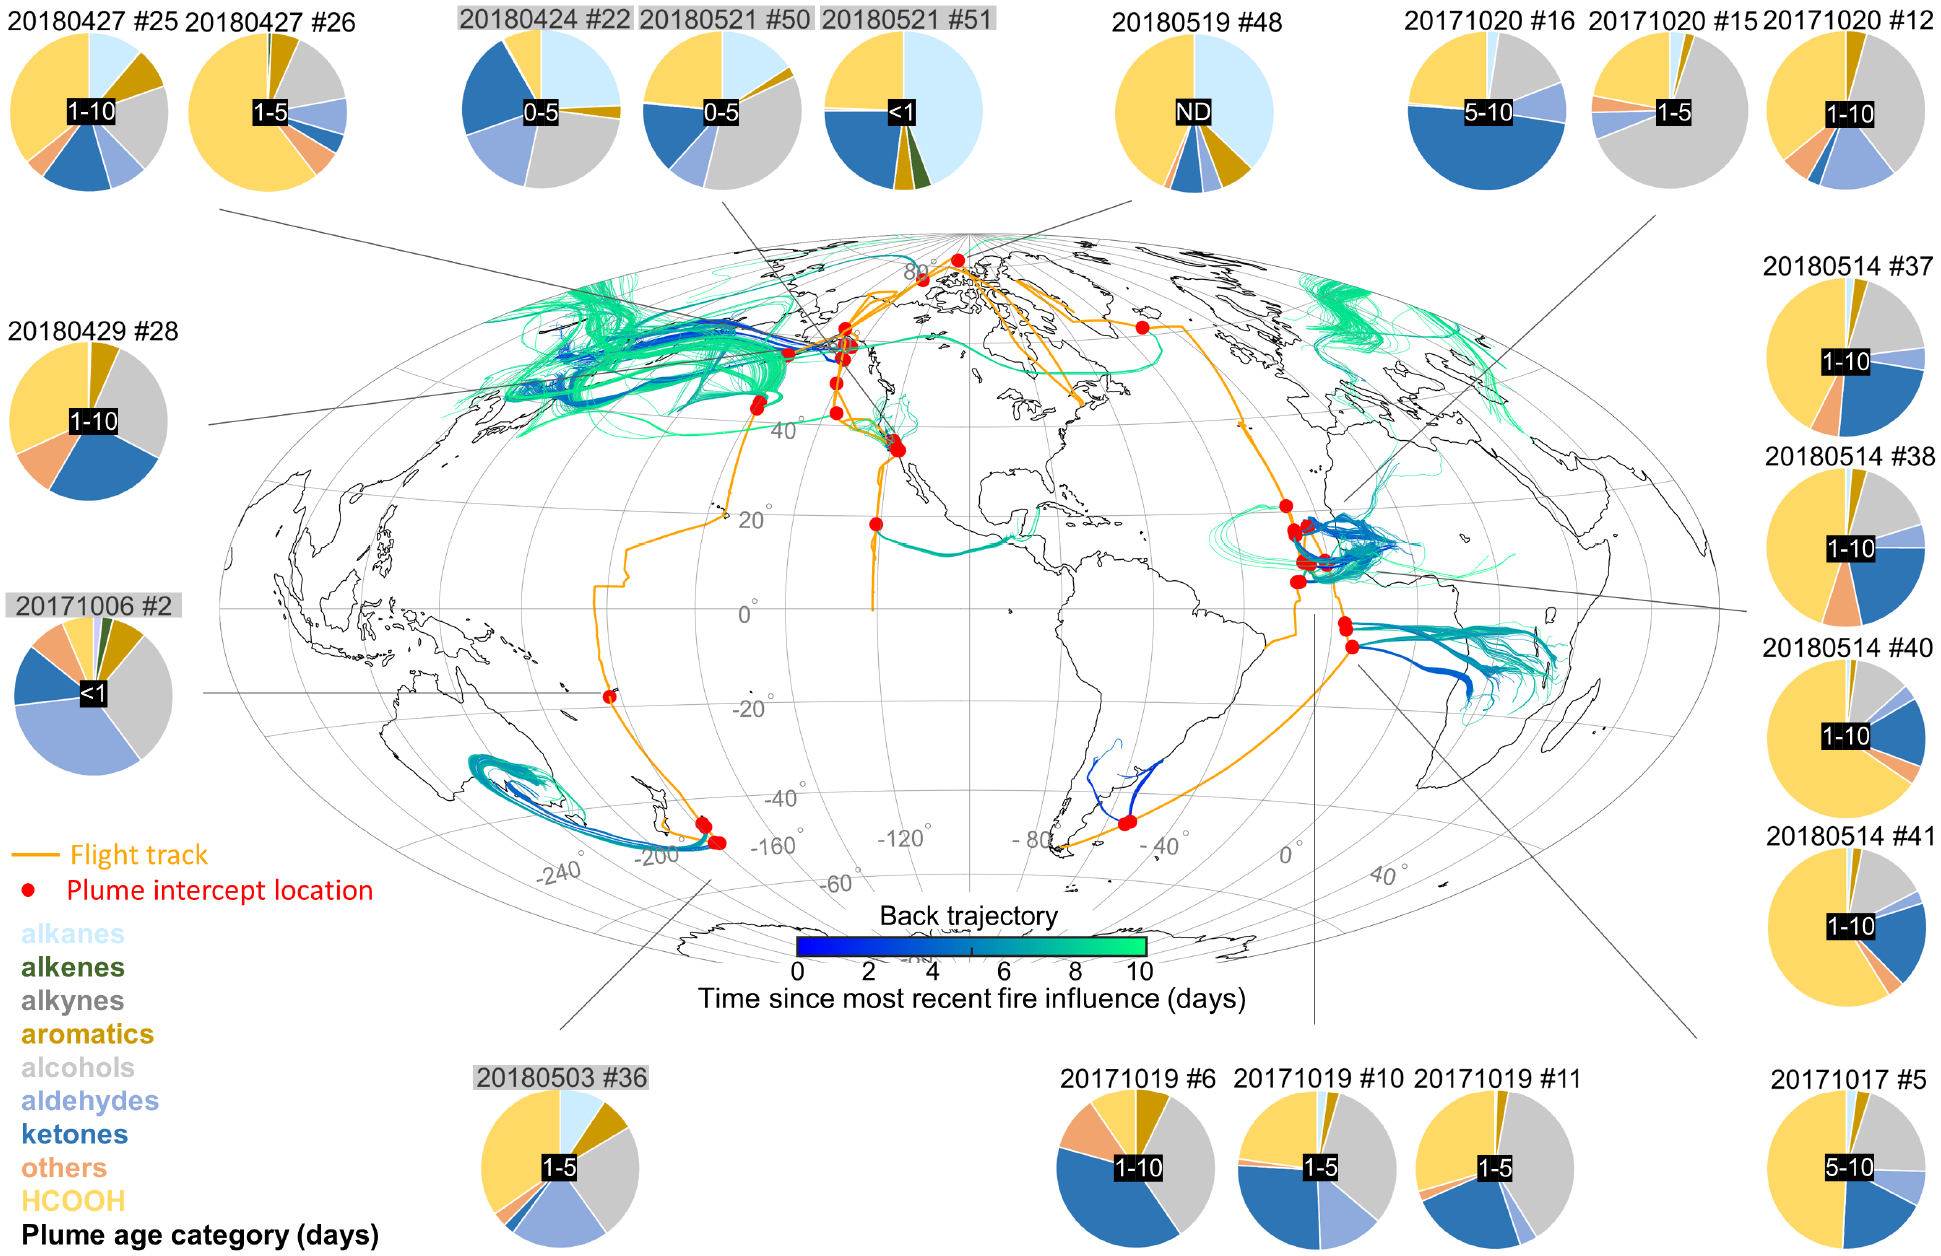
Formic acid (HCOOH) is an important component of atmospheric acidity but its budget is poorly understood, with prior observations implying substantial missing sources. Here we combine pole-to-pole airborne observations from the Atmospheric Tomography Mission (ATom) with chemical transport model (GEOS-Chem CTM) and back trajectory analyses to provide the first global in-situ characterization of HCOOH in the remote atmosphere. ATom reveals sub-100 ppt HCOOH concentrations over most of the remote oceans, punctuated by large enhancements associated with continental outflow. Enhancements correlate with known combustion tracers and trajectory-based fire influences. The GEOS-Chem model underpredicts these in-plume HCOOH enhancements, but elsewhere we find no broad indication of a missing HCOOH source in the background free troposphere. We conclude that missing non-fire HCOOH precursors inferred previously are predominantly short-lived. We find indications of a wet scavenging underestimate in the model consistent with a positive HCOOH bias in the tropical upper troposphere. Observations reveal episodic evidence of ocean HCOOH uptake, which is well-captured by GEOS-Chem; however, despite its strong seawater undersaturation HCOOH is not consistently depleted in the remote marine boundary layer. Over fifty fire and mixed plumes were intercepted during ATom with widely varying transit times and source regions. HCOOH:CO normalized excess mixing ratios in these plumes range from 3.4 to >50 ppt/ppb CO and are often over an order of magnitude higher than expected primary emission ratios. HCOOH is thus a major reactive organic carbon reservoir in the aged plumes sampled during ATom, implying important missing pathways for in-plume HCOOH production.

Keywords: Atmospheric Tomography Mission; back trajectory; chemical transport model; deposition; fire; formic acid; iodide CIMS; remote atmosphere.


Figures

Figure 1.
Figure 1.
Observed HCOOH distribution during ATom-3 and 4. Panels a and c map the HCOOH mixing ratios measured during ATom-3 above (a) and below (c) 5 km altitude. Panels (b) and (d) show the corresponding plots for ATom-4. Each datapoint in panels a–d is colored by the mean HCOOH mixing ratio for the surrounding 1.5° latitude × 1.5° longitude bin. Panel e shows normalized frequency distributions for the ATom HCOOH observations with different linear scales at the upper range of the distribution. Some negative values occur reflecting uncertainty and variability in the instrument background signal.
Figure 2.
Figure 2.
Median HCOOH vertical profiles measured during ATom-3 and 4, and comparison with (a) prior aircraft observations over ocean and (b) GEOS-Chem model predictions. The vertical bin resolution differs between panels (a) and (b) (a: 2 km; b: 0.5 km below 3 km altitude, 1 km above 3 km altitude) to reflect differing sampling densities between the campaigns. Horizontal bars indicate 25th-75th percentiles for each vertical bin. For panel (a) observations over land have been filtered out, and the SONEX dataset further employs ozone and latitude filters following Singh et al. (2000). See Table S1 for details on the aircraft campaigns plotted in panel (a).
Figure 3.
Figure 3.
Interpolated tracer latitude-altitude cross-sections based on ATom-3 (Northern Hemisphere fall) and 4 (Northern Hemisphere spring) in-situ observations. 1 Hz data are gridded and interpolated into 0.05° latitude × 250m altitude bins.
Figure 4.
Figure 4.
(a–c): Median gridded (10° latitude × 500m altitude) HCOOH cross-sections. Plotted are the (a) ATom observations, (b) GEOS-Chem model predictions, and (c) absolute model bias. (d): Kernel-smoothed probability density distributions and box-whisker plots (5th-25th-50th-75th-95th percentiles) for the HCOOH:CO ratio as measured during ATom (black) and modeled by GEOS-Chem (red) with numbers inset representing (left to right) the 5th, 50th, and 95th percentiles of the distribution.
Figure 5.
Figure 5.
Ocean uptake of HCOOH as evident during two background flights: (a) a tropical Pacific flight on 10/06/2017, and (b) an Antarctic flight on 05/09/2018. Left panels show timeseries for three trace gases (black) and altitude (blue). Shaded regions (grey) in the HCOOH panel indicate cloudy conditions (liquid-phase, mixed-phase, or cirrus clouds) based on CAPS observations. Right panels show the corresponding median observed vertical profiles for the entire flight (in black) with horizontal bars denoting the 25th–75th percentiles. The observed HCOOH profile is compared to GEOS-Chem model predictions (in red). Panel (c) shows the two flight tracks (black).
Figure 6.
Figure 6.
HCOOH normalized excess mixing ratios (NEMRs) relative to CO as a function of transport time for ATom plumes, and comparison to prior studies. Transport times (ND: not determined) are estimated based on back trajectory analysis as described in-text. Colored dots indicate fire plumes and plumes with anthropogenic influence (grey). Plumes marked with an “×” denote encounters after a mid-flight instrumental change on 05/14/2018 (see text). Also shown are primary HCOOH emission ratios (ER) as compiled by Andreae (2019) and Akagi et al. (2011), and HCOOH NEMR estimates inferred from prior atmospheric observations. These include: aircraft studies featuring downwind plume sampling (up to 4.5 hours aging), , , , ground-based remote sensing by Fourier transform infrared spectrometry (g-FTIR), –, and space-based observations from the ACE-FTS, , , , , , and TES/IASI satellite instruments, , .
Figure 7.
Figure 7.
Aged west African fire plumes sampled on 05/14/2018. Panels (a) and (b) show HCOOH, HCN, CO, and BC time series for the entire flight, with 7 plume intercepts (#37–43) marked inset. An additional plume (between #38 and #39) was encountered during an HCOOH instrumental zero and is therefore omitted. Panel (c) shows HYSPLIT back trajectories (red, 1-day interval marked) for 3 example plume intercepts. Panels (d)–(k) show correlations between select pyrogenic species and CO for all plume intercepts. The resulting NEMR range (obtained from the regression slopes for the 7 plume intercepts) is compared to expected primary emission ratios (ER, shaded in grey) for that species based on compiled data ranges for relevant fuel types (forests, savanna and grassland, and agricultural residue). For TOGA-measured species only plume intercepts including 3 or more data points (#37, #38, #40, #41) are retained for NEMR analysis. Convective influence is negligible for these plumes based on back trajectory analysis. The lifetime (unit: days) is shown for each species with respect to its dominant loss pathway, –. An OH concentration of 2×10⁶ molecule/cm3 is used to calculate nominal lifetimes to OH oxidation, .
Figure 8.
Figure 8.
Gas-phase reactive organic carbon (gROC) composition in ATom-3 and ATom-4 fire plumes. Grey shaded plume intercept numbers are plumes with anthropogenic influence. Identified plumes (filled red circles) are denoted along the flight tracks (orange lines) with associated back trajectory clusters colored by the time since most recent fire influence. Plumes and trajectories shown are restricted to those with identified fire influence within the previous 10 days. Pie charts show in-plume gROC speciation on an NEMR basis (ppt C/ppb CO). VOCs that are measured only with the WAS system are omitted here for consistency across plumes; Figure S5 includes such species when available. See Figure S6 for a version of this figure that includes submicron aerosol OC.

References

    1. Keene WC, Galloway JN, and Holden JD, Measurement of weak organic acidity in precipitation from remote areas of the world. J. Geophys. Res.: Oceans 1983, 88 (C9), 5122–5130, 10.1029/JC088iC09p05122. - DOI
    1. Andreae MO, Talbot RW, Andreae TW, and Harriss RC, Formic and acetic acid over the central Amazon region, Brazil: 1. Dry season. J. Geophys. Res.: Atmos 1988, 93 (D2), 10.1029/JD093iD02p01616. - DOI
    1. Galloway JN, Likens GE, Keene WC, and Miller JM, The composition of precipitation in remote areas of the world. J. Geophys. Res.: Oceans 1982, 87 (C11), 10.1029/JC087iC11p08771. - DOI
    1. Jacob DJ, Chemistry of OH in remote clouds and its role in the production of formic acid and peroxymonosulfate. J. Geophys. Res.: Atmos 1986, 91 (D9), 10.1029/JD091iD09p09807. - DOI
    1. Millet DB, Baasandorj M, Farmer DK, Thornton JA, Baumann K, Brophy P, Chaliyakunnel S, de Gouw JA, Graus M, Hu L, Koss A, Lee BH, Lopez-Hilfiker FD, Neuman JA, Paulot F, Peischl J, Pollack IB, Ryerson TB, Warneke C, Williams BJ, and Xu J, A large and ubiquitous source of atmospheric formic acid. Atmos. Chem. Phys 2015, 15 (11), 6283–6304, 10.5194/acp-15-6283-2015. - DOI

LinkOut - more resources