. 2021 Jun;2(6):643-657.
doi: 10.1038/s43018-021-00200-0. Epub 2021 Apr 26.

A systematic CRISPR screen defines mutational mechanisms underpinning signatures caused by replication errors and endogenous DNA damage

Collaborators, Affiliations

A systematic CRISPR screen defines mutational mechanisms underpinning signatures caused by replication errors and endogenous DNA damage

Xueqing Zou et al. Nat Cancer. 2021 Jun.

Abstract

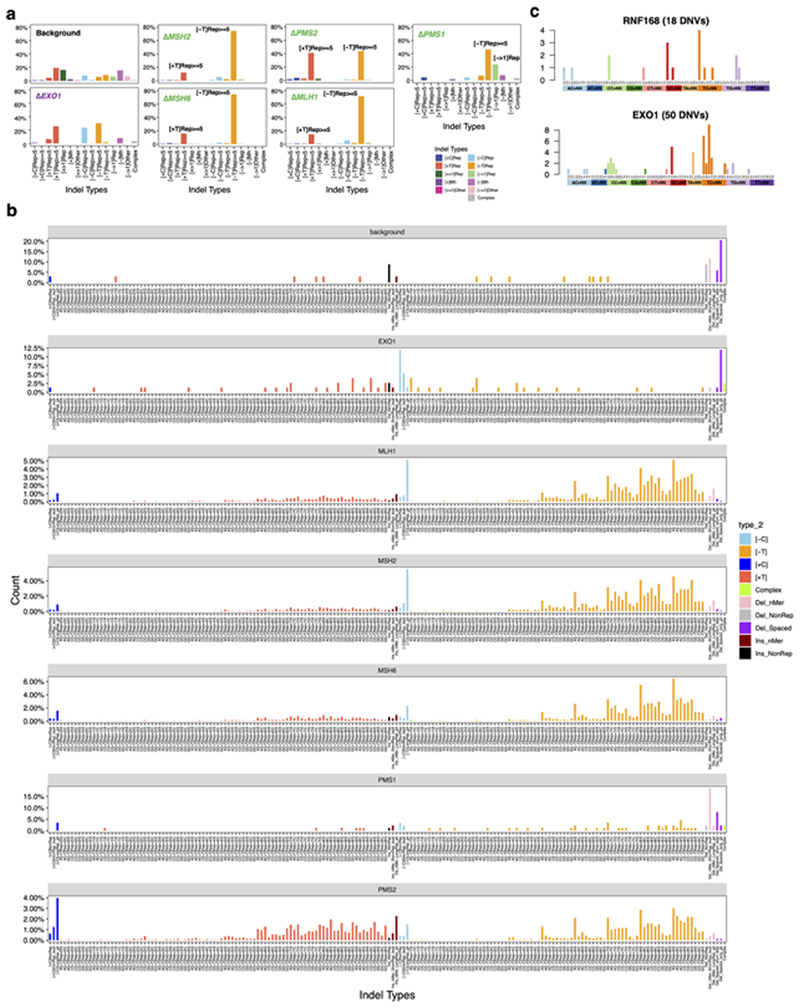
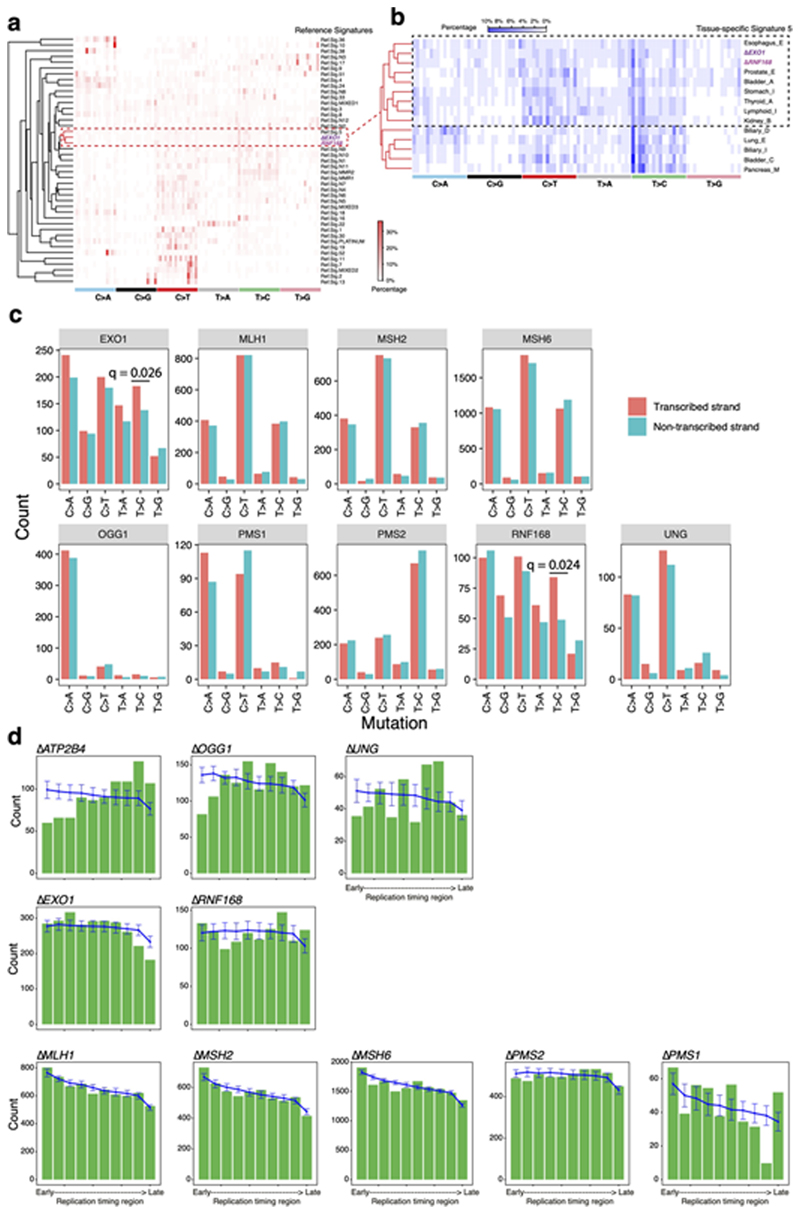
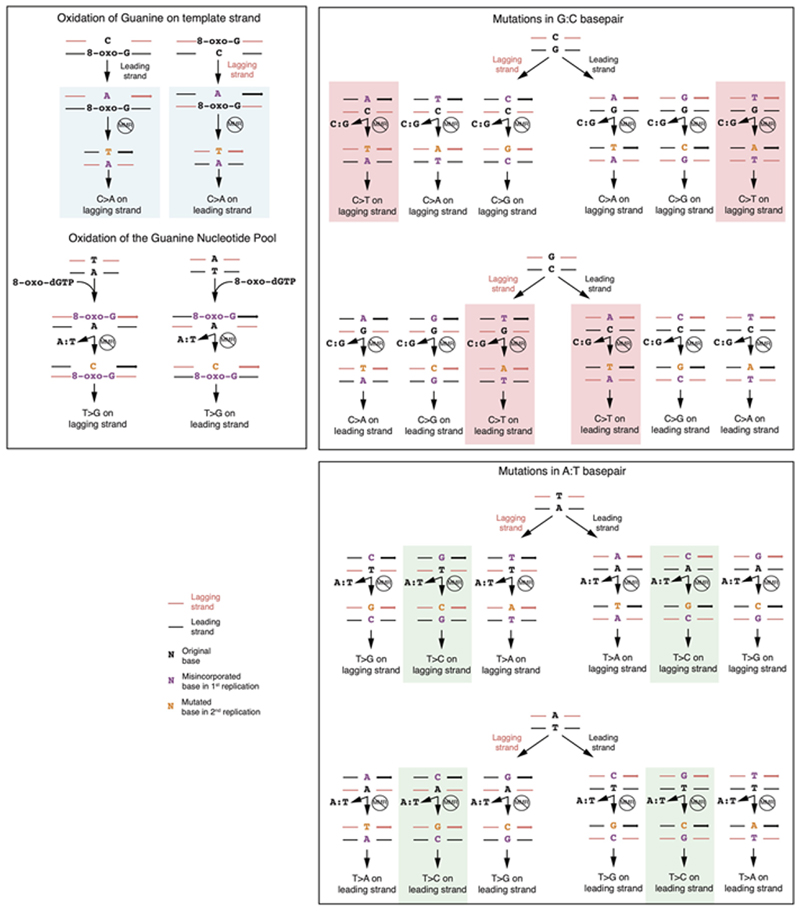
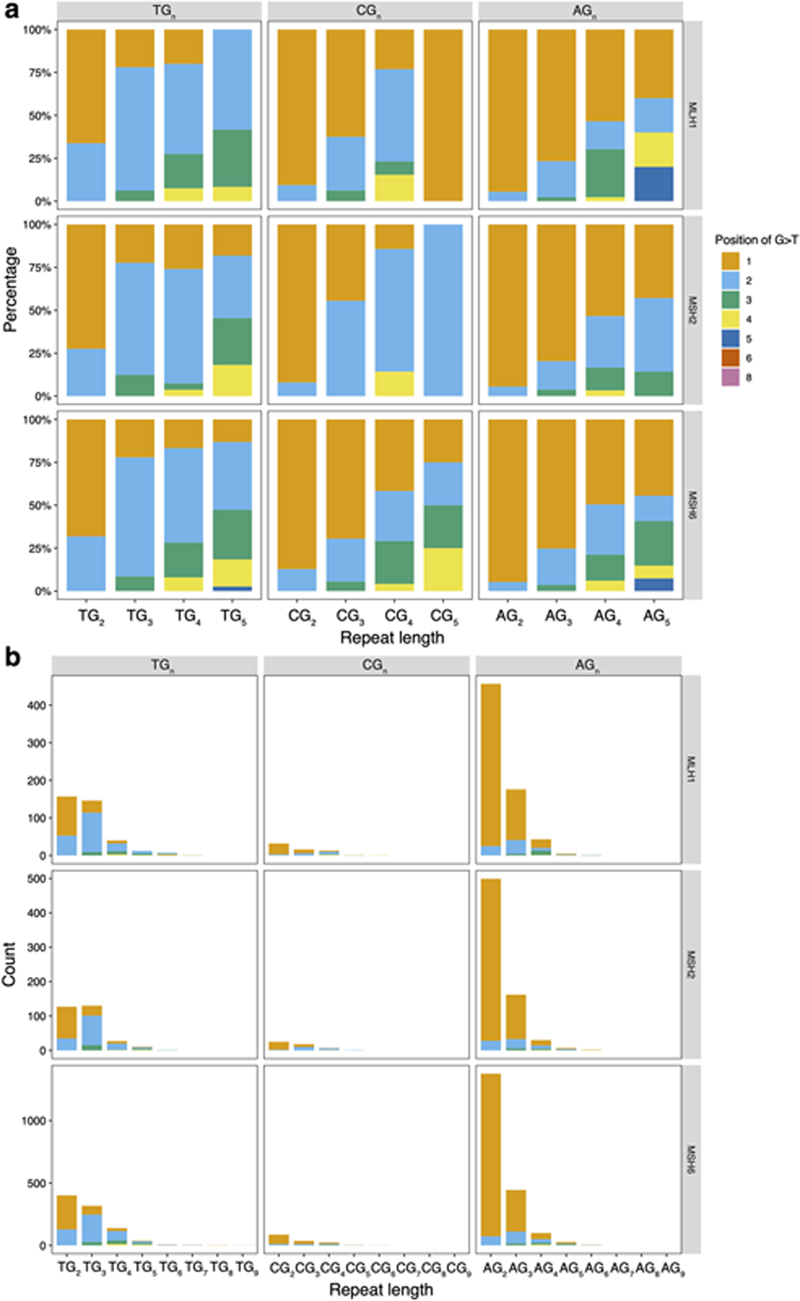
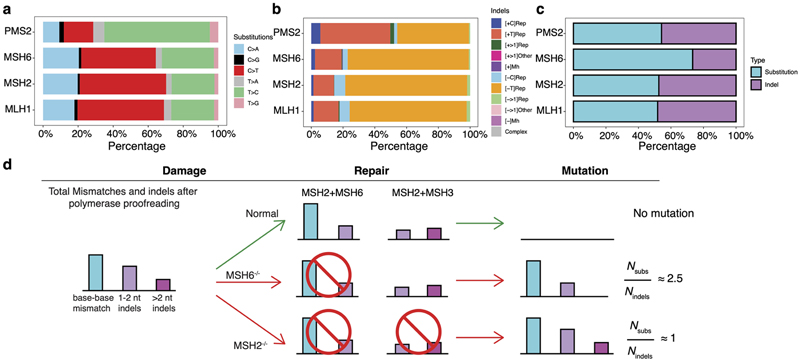
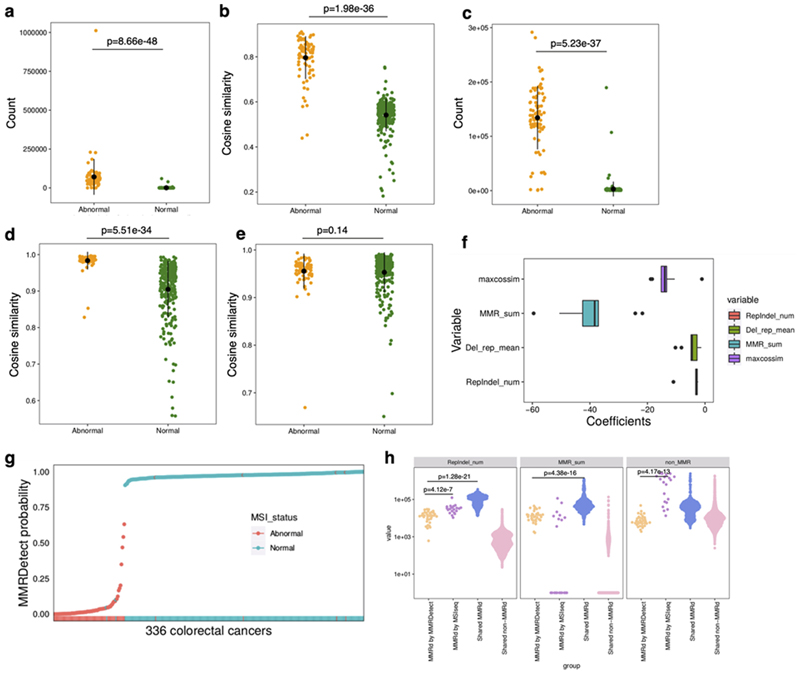
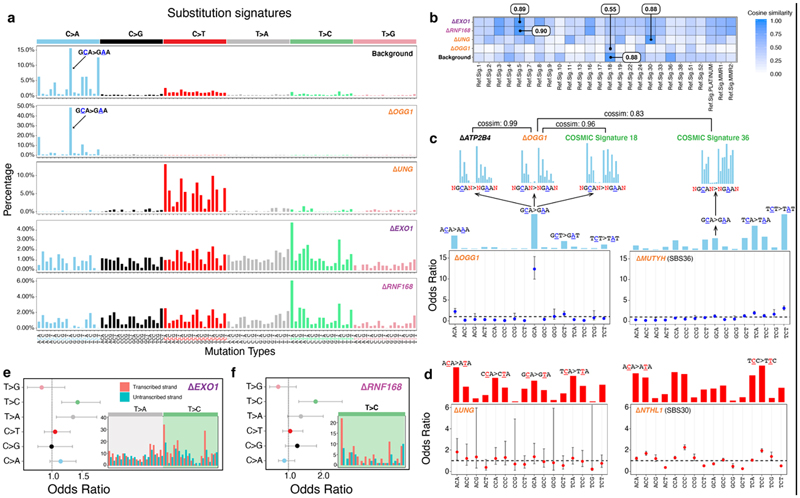
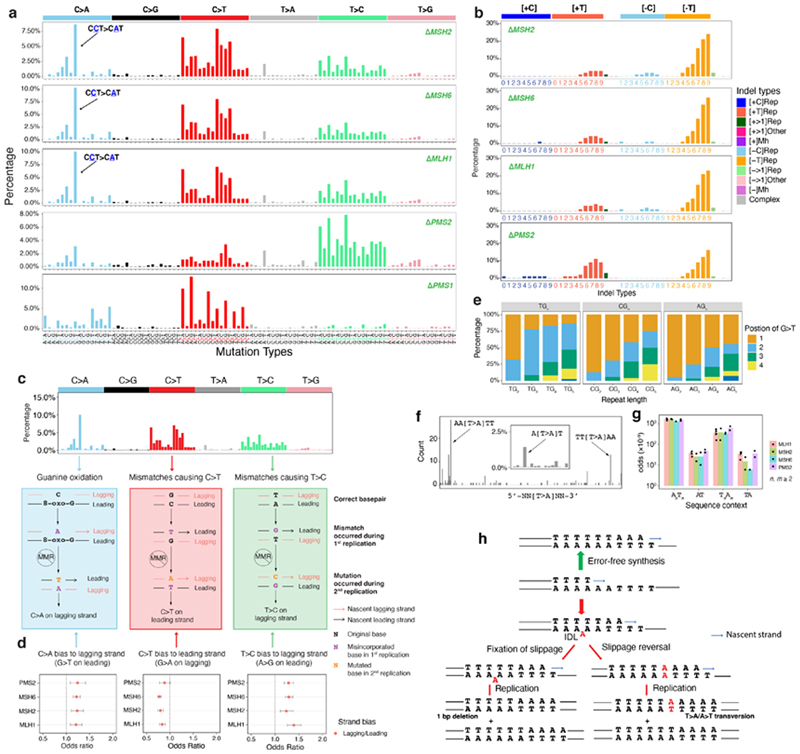
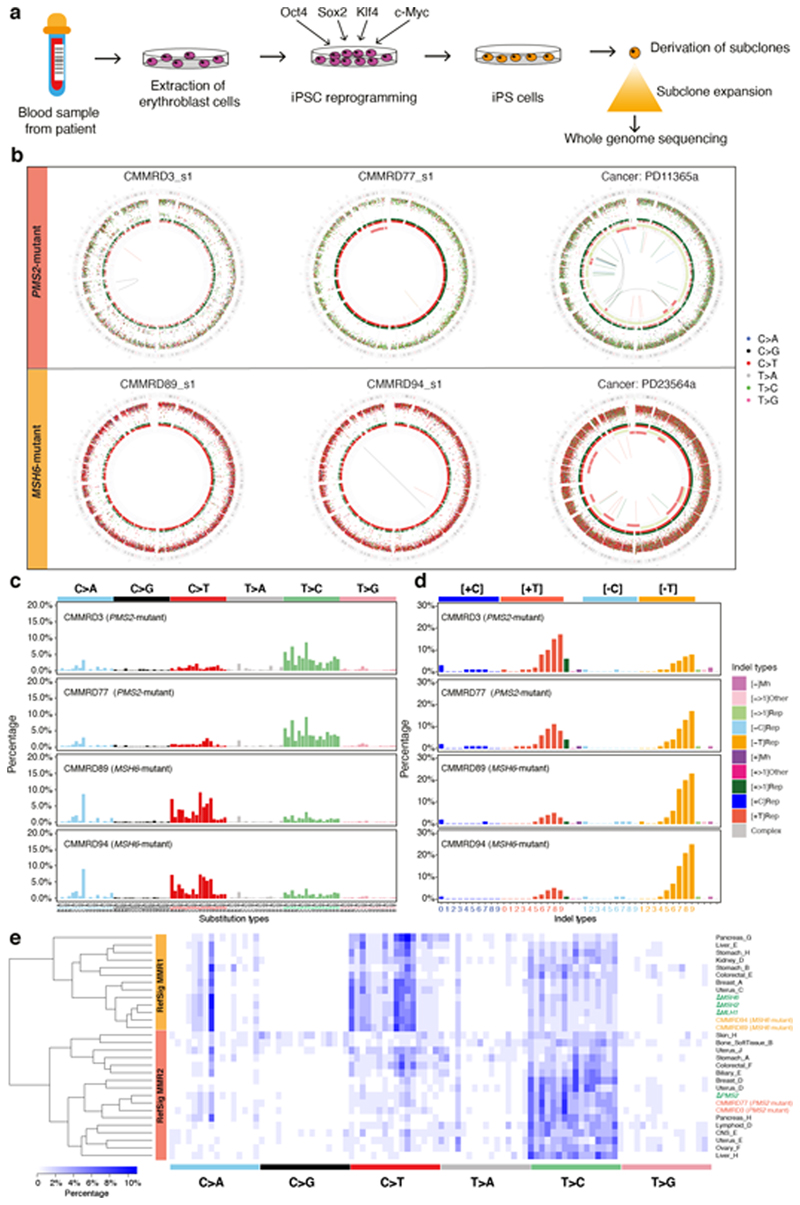
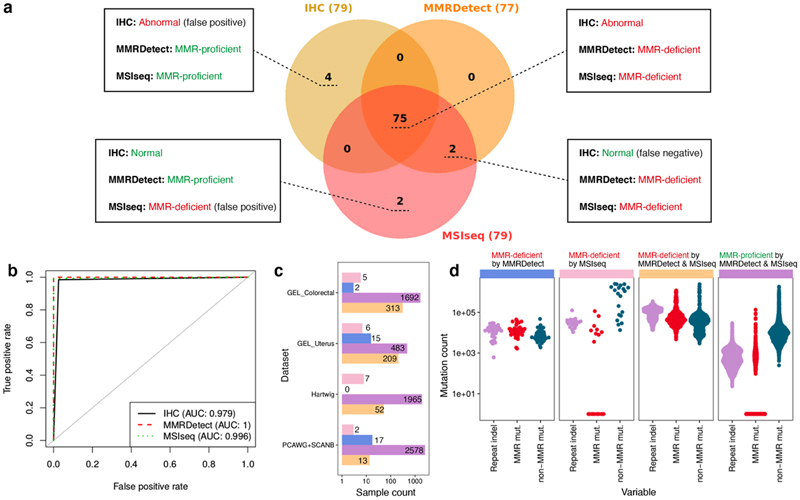
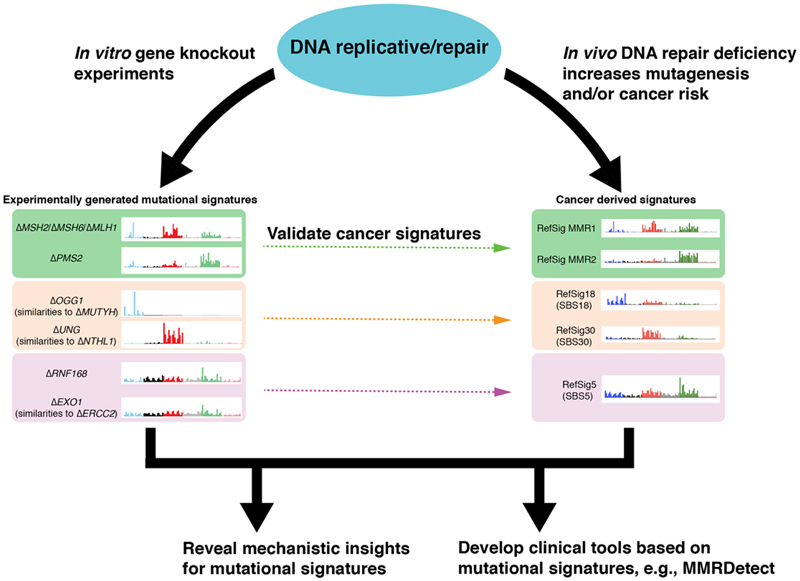
Mutational signatures are imprints of pathophysiological processes arising through tumorigenesis. We generated isogenic CRISPR-Cas9 knockouts (Δ) of 43 genes in human induced pluripotent stem cells, cultured them in the absence of added DNA damage, and performed whole-genome sequencing of 173 subclones. ΔOGG1, ΔUNG, ΔEXO1, ΔRNF168, ΔMLH1, ΔMSH2, ΔMSH6, ΔPMS1, and ΔPMS2 produced marked mutational signatures indicative of being critical mitigators of endogenous DNA modifications. Detailed analyses revealed mutational mechanistic insights, including how 8-oxo-dG elimination is sequence-context-specific while uracil clearance is sequence-context-independent. Mismatch repair (MMR) deficiency signatures are engendered by oxidative damage (C>A transversions), differential misincorporation by replicative polymerases (T>C and C>T transitions), and we propose a 'reverse template slippage' model for T>A transversions. ΔMLH1, ΔMSH6, and ΔMSH2 signatures were similar to each other but distinct from ΔPMS2. Finally, we developed a classifier, MMRDetect, where application to 7,695 WGS cancers showed enhanced detection of MMR-deficient tumors, with implications for responsiveness to immunotherapies.

Keywords: CRISPR-Cas9 systems; Genomic instability; cancer; cancer genomics.


Conflict of interest statement

Competing Interests Statement SNZ holds patents on clinical algorithms of mutational signatures and during the completion of this project, served advisory roles for Astra Zeneca, Artios Pharma Ltd and Scottish Genome Project.

Figures

Extended Data Fig. 1
Extended Data Fig. 1. Results of pilot study.
Three genes were selected for knockout (&#Δ): MSH6, UNG and ATP2B4 (negative control). Two genotypes per gene were obtained and grown in culture to gauge reproducibility of signatures between different genotypes of a gene-knockout. These lines were cultured under normoxic (20%) and hypoxic (3%) states, for defined culture times of ~15, 30 or 45 days. Two single-cell subclones were derived for whole genome sequencing for each parental line (equivalent to four subclones per gene edit). One of the UNG genotypes appeared to be heterozygous, which was excluded in downstream analysis. (a) Substitution burden for knockouts of ATP2B4, UNG and MSH6 under hypoxic and normoxic conditions as well as different culturing time. (b) The cosine similarities between the mutational profile of each subclone and background signature of culture. (c) Indel burden for knockouts of ATP2B4, UNG and MSH6 under hypoxic and normoxic conditions as well as different culturing time. (d) The cosine similarities between the mutational profile of each subclone with background signature of culture. Overall, the differences between normoxic and hypoxic conditions were not marked, although normoxic conditions produced slightly more mutations. Time in culture made only a marginal, non-linear difference to burden of mutagenesis. Given the results of the pilot, weighing up the costs and risks associated with prolonged culture time (risk of infection, risk of selection, marked increase in cost of experimental reagents) with the minimal return in terms of mutation number, and also intending to minimize transitions between hypoxic to normoxic conditions while handling cell cultures, we opted to proceed with the full-scale study under normoxic conditions and for 15 days for the rest of study.
Extended Data Fig. 2
Extended Data Fig. 2. Detecting mutational consequences of knockouts in the absence of added external DNA damage.
(a)(b) Schematic illustration of potential components of background signature (a) and Possible mutational consequences of the DNA repair gene knockouts for proteins that are critical mitigators of mutagenesis (b). (c)-(e) Mutation burden of whole-genome-sequenced subclones of gene knockouts. (c) Substitution, (d) indel and (e) double substitution. Bars represent the mean. Individual data points are shown in orange dots. In all comparative analyses, all gene knockouts were cultured for 15 days and only daughter subclones that were fully clonal (i.e., clearly derived from a single cell) were included. N = 2~4, which is the number of clonal knockout subclones cultured under normoxic condition for 15 days (see Supplementary Table 2). (f) 96-channel substitution mutation profiles of 173 gene knockout subclones.
Extended Data Fig. 3
Extended Data Fig. 3. Results of contrastive principal component analysis and t-SNE.
(a) Contrastive principal component analysis (cPCA) was employed to discriminate knockout profiles from control profiles (&#ΔATP2B4). Each figure contains six different genes. Nine gene knockouts separate from the controls. Using this method, &#ΔADH5 did not separate clearly from &#ΔATP2B4, indicative of either having no signature or a weak signature. Dot colours indicate the repair/replicative pathway that each gene is involved: in black - control; green - MMR; orange – BER; dark purple – HR and HR regulation; light purple - checkpoint. Each dot represents a subclone. The number of subclones for each gene knockout (N = 2~4) can be found in Supplementary Table 2. (b) The t-SNE algorithm was applied to discriminate the mutational profiles of gene knockouts from those of control knockouts. Gene knockouts that produce mutational signatures separate clearly from control subclones and other knockouts which do not have signatures. Subclones of the gene knockouts which produce signatures are clustered together, indicating consistency between subclones.
Extended Data Fig. 4
Extended Data Fig. 4. Oxidative damage-associated mutational signatures.
(a) Relative mutation frequency of G>T/C>A in 256 possible channels which take two adjacent bases 5’ and 3’ of each mutated base (4×4×4×4=256) for &#ΔATP2B4, &#ΔOGG1, a head and neck cancer with strong Signature 18 and COSMIC Signature 18. (b) Left: tSNE plot of tissue-specific mutational signature 18. Two groups are featured with predominant peaks at TGC>TTC/GCA>GAA (highlighted in green) and AGA>ATA/TCT>TAT (highlighted in purple), respectively. Right: heatmap of 21 tissue-specific mutational signatures at C>A. We compared experimental signatures to previously published cancer-derived signatures, focusing on 21 tissue-specific variations of Signature 18. Interestingly, we found two distinct groups of Signature 18. Signatures of &#Δ OGG1, cellular models and signatures derived from head and neck tumors, pancreas, myeloid, bladder, uterus, cervix, lymphoid tumors were most similar to each other, with the predominant G>T/C>A peak at TGC>TTC/GCA>GAA. By contrast, an alternative version of this signature with a predominant G>T/C>A peak at AGA>ATA/TCT>TAT was noted in colorectal, esophagus, stomach, bone, lung, CNS, breast, skin, prostate, liver, head and neck tumors (Signature Head_neck_G), ovary, biliary and kidney cancers. Indeed, there are many types of oxidative species which could fluctuate between tissues, variably affecting trinucleotides resulting in the variation observed in Signature 18.
Extended Data Fig. 5
Extended Data Fig. 5. Indel signatures and double substitution signatures.
(a) 15-channel Indel signatures. (b) 186-channel Indel signatures. (c) Aggregated double substitution profile of &#ΔRNF168 and &#ΔEXO1.
Extended Data Fig. 6
Extended Data Fig. 6. Similarities between &#ΔEXO1, &#ΔRNF168 signatures and Signature 5 and results of analysis on transcriptional strand bias and distribution of mutations on replication timing domains.
(a) Hierarchical clustering of cancer-derived reference signatures with &#ΔEXO1 and &#ΔRNF168 signatures. (b) Hierarchical clustering of tissue-specific signature 5 with &#ΔEXO1 and &#ΔRNF168 signatures. (c) Transcriptional strand bias in 9 gene knockouts. Pearson's Chi-Squared test (chisq.test()) was used to calculate the p-value. P-value was corrected using p.adjust(). Unlike mutational signatures of environmental mutagens, we do not observe striking transcriptional strand bias in signatures generated by DNA repair gene knockouts, except for T>C generated by &#ΔEXO1 and &#ΔRNF168. Since transcriptional strand bias is largely induced by NER repairing DNA bulky adducts, lack of it indicates that most of the endogenous DNA damage is not particularly bulky or DNA-deforming. (d) Distribution of mutation density across replication timing domains (separated into deciles) for signatures associated with different gene knockouts. Green bars indicate observed distribution. Blue lines indicate expected distribution with correction of trinucleotide density of each domain. Bars and error bars represent mean ± SD of bootstrapping replicates (n=100).
Extended Data Fig. 7
Extended Data Fig. 7. Putative outcomes of all possible base-base mismatches.
Outcomes from 12 possible base-base mismatches. The red and black strands represent lagging and leading strands, respectively. The arrowed strand is the nascent strand. The highlighted pathways are the ones that generate C>A (blue), C>T (red) and T>C mutations (green) in the &#ΔMSH2 mutational signature.
Extended Data Fig. 8
Extended Data Fig. 8. Distribution of G>T/C>A mutations in polyG tracts of &#ΔMSH2, &#ΔMSH6 and &#ΔMLH1.
(a) Relative frequency of occurrence of G>T/C>A in polyG tracts. (b) Occurrence of G>T/C>A in polyG tracts.
Extended Data Fig. 9
Extended Data Fig. 9. Gene-specific mutational signatures in MMR-deficiency.
Proportion of different mutation types of substitution (a) and indel (b) signatures for 4 MMR gene knockouts. (c) The ratio of substitution and indel burden. (d) Schematic interpretation of the relative mutation burdens of &#ΔMSH2 and &#ΔMSH6.
Extended Data Fig. 10
Extended Data Fig. 10. Development of MMRDetect.
(a)-(e) Distribution of the five parameters across IHC-determined MMR gene abnormal (orange) and MMR gene normal (green) samples. black dots and error bars represent mean ± SD of the paramenters. N Abnormal = 79 samples (yellow); N Normal = 257 samples (green). (a) Exposure of MMR signatures. (b) Cosine similarity between the substitution profile of cancer samples and that of MMR gene knockouts. (c) Number of indels in repetitive regions. (d) Cosine similarity between the profile of repeat-mediated deletions of cancer sample and that of knockout generated indel signatures, (e) the cosine similarity between the profile of repeat-mediated insertion of cancer sample and that of knockout generated indel signatures. P-values were calculated through two-sided Mann-Whitney test. (f) Distribution of coefficients from 10-fold cross validation using training data set. Box plots denote median (horizontal line) and 25th to 75th percentiles (boxes). The lower and upper whiskers extend to 1.5× the inter-quartile range. N = 10 iterations. (g) MMRDetect-calculated probabilities for 336 colorectal cancers. With cut-off of 0.7, 77 out of 336 were predicted to be MMR-deficient samples (probability < 0.7). Colour bars represent the MSI status determined by IHC staining: red – abnormal; blue – normal. Four samples with abnormal IHC staining have probabilities > 0.7, whilst 2 samples with normal IHC staining have probabilities < 0.7. The 4 samples were revealed to be false positive cases and the 2 samples were false negative ones for IHC staining through validation using MSIseq and seeking coding mutations in MMR genes. (h) Distribution of the mutation number of repeat-mediated indels, MMR-deficiency signatures and non-MMR-deficiency signatures across four groups of samples: MMR-deficient samples determined by only MMRDetect (yellow), MMR-deficient samples determined by only MSIseq (purple), MMR-deficient samples determined by both MMRDetect and MSIseq (blue) and non-MMR-deficient samples determined by both MMRDetect and MSIseq (pink). P-values were calculated through two-sided Mann-Whitney test. Numbers of MMR-deficient samples determined by MMRDetect only (blue), MSIseq only (pink), both (yellow) and none (purple) are 34, 20, 587 and 6718, respectively.
Figure 1
Figure 1. Mutational consequences of DNA replicative/repair pathway gene knockouts.
(a) Experimental workflow from isolation of gene knockouts to generating subclones for WGS. (b) Forty-three genes were knocked out, including 42 DNA replicative/repair genes and one control gene (ATP2B4). (c) Distinguishing substitution profiles of control subclones and knockout subclones. Green line shows the cosine similarities between bootstrapped profiles of controls against aggregated control substitution profile. X-axis shows the aggregated substitution number of each genotype of a knockout. (d) Distinguishing indel profile of control subclones and knockout subclones. Light blue line shows the cosine similarities between bootstrapped indel profiles of controls against aggregated control indel profile. X-axis shows the aggregated indel number of each genotype of a knockout. (e) De novo mutation number of knockout subclones (n = 2~4, Supplementary Table 2) cultured for 15 days. Bars and error bars represent mean ± SD of subclone observations.
Figure 2
Figure 2. Safeguarding the genome from oxidative damage and cytosine deamination.
(a) Substitution signatures of background mutagenesis (from control ΔATP2B4), ΔOGG1,ΔUNG,ΔEXO1 and ΔRNF168. (b) Cosine similarity between mutational signature of gene knockouts and cancer-derived mutational signatures24. (c) Odds ratio of C>A occurring at 16 trinucleotides for ΔOGG1 and ΔMUTYH (SBS36)6. Calculation was corrected for distribution of trinucleotides in the reference genome. Odds ratio less than 1 with 95% confidence interval (CI) < 1 implies that C>A mutations at that particular trinucleotide are less likely to occur. The mutational profiles of C>A at GCA with ±2 flanking bases are shown for ΔATP2B4,ΔOGG1, SBS18 and SBS36. (d) Odds ratio of C>T occurring at all 16 trinucleotides for ΔUNG and ΔNTHL1 (SBS30)6. Transcriptional strand asymmetry of (e) ΔEXO1 signature and (f) ΔRNF168 signature. Dots and error bars in (c-f) represent calculated odds ratio with 95% confidence interval. The insets show the count of T>C/A>G mutations on transcribed and non-transcribed strands.
Figure 3
Figure 3. Multiple endogenous sources of DNA damage managed by mismatch repair.
(a) Substitution and (b) indel signatures for five mismatch repair gene knockouts. The indel signature of ΔPMS1 is shown in Extended Data Fig. 5a. (c) Dissection of DNA mismatch repair mutational signatures: C>A mutations believed to be due to oxidative damage of guanine and proposed mechanism of how DNA polymerase errors contribute to mis-incorporated bases that result in C>T and T>C. All other mismatch possibilities and their outcomes are demonstrated in Extended Data Fig. 7. The red and black strands represent lagging and leading strands, respectively. The arrowed strand is the nascent strand. (d) Replicative strand asymmetry observed for mutational signatures generated by four MMR gene knockouts. Dots and error bars represent odds ratio with 95% confidence interval. (e) The relative frequency of occurrence of G>T/C>A in polyG tracts for ΔMSH6. The count and relative frequency of occurrence of G>T/C>A in polyG tracts for ΔMSH2 and ΔMLH1 are shown in Extended Data Fig. 8. (f) T>A mutation frequency is highest at junctions of poly(A)poly(T) or poly(T)poly(A). The inset shows that T>A mutations have a striking peak at ATT. (g) Odds for T>A mutations occurring at poly(A)poly(T) or poly(T)poly(A) are higher than AT sequences flanked by other nucleotides, corrected for sequence context through whole genome. Data are represented as mean ± SEM. N= 2~4, see Supplementary Table 2. (h) Putative ‘reverse template slippage’ model: T>A substitutions at poly(A)poly(T) or poly(T)poly(A) junctions arise due to template strand slippage and subsequent reversal of the slipped template strand. IDL: insertion-deletion loop.
Figure 4
Figure 4. Gene-specific features of signatures of mismatch repair (MMR) deficiency are recapitulated in other model systems.
(a) Experimental workflow including generation of hiPSCs from patients with Constitutional Mismatch Repair Deficiency (CMMRD), subcloning of hiPSCs and whole-genome sequencing. (b) Genome plots of MMR knockouts demonstrate consistent gene-specificity regardless of model system, e.g., cancer (in vivo) and CMMRD patient-derived hiPSCs (in vitro). Top: whole genome plots of two iPSC subclones from two PMS2 mutated CMMRD patients and a breast tumor with PMS2 deficiency. Bottom: genome plots of two iPSC subclones derived from two MSH6 mutant CMMRD patients and a breast tumor with MSH2/MSH6 deficiency. Genome plots show somatic mutations including substitutions (outermost, dots represent six mutation types: C>A, blue; C>G, black; C>T, red; T>A, grey; T>C, green; T>G, pink), indels (the second outer circle, colour bars represent five types of indels: complex, grey; insertion, green; deletion other, red; repeat-mediated deletion, light red; microhomology-mediated deletion, dark red) and rearrangements (innermost, lines representing different types of rearrangements: tandem duplications, green; deletions, orange; inversions, blue; translocations, grey). (c) 96-channel substitution profiles. (d) 45-channel indel profiles. (e) Hierarchical clustering of cancer-derived tissue-specific MMR signature and MMR knockout signatures. 96-bar plots of ΔPMS2-related tissue-specific signatures can be viewed here: https://signal.mutationalsignatures.com/explore/cancer/consensusSubstitutionSignatures/6
Figure 5
Figure 5. Mutational signature-based mismatch repair (MMR) deficiency classifier, MMRDetect.
(a) Concordance of three MMR-deficiency detection methods - immunohistochemistry (IHC) staining, MSIseq and MMRDetect - on 336 colorectal cancers is illustrated in the Venn diagram. IHC staining, MSIseq and MMRDetect identified 79, 79 and 77 MMR-deficient samples, respectively. Details of the eight samples with discordant outcomes from the three methods are provided in Supplementary Table 5. Four samples classified as MMR-proficient by MMRDetect and MSIseq have abnormal IHC staining (shown in dark yellow). However, no functional mutations in MMR genes were found. Two samples classified as MMR-proficient by MMRDetect and IHC staining were identified as MMR-deficient by MSIseq (shown in pink) and did not have MMR gene mutations but had POLE mutations and signatures instead. Two samples classified as MMR-deficient by MMRDetect and MSIseq have normal IHC staining (shown in orange). Both have mutations in MMR genes. (b) Receiver operating characteristic (ROC) curves of IHC staining, MMRDetect and MSIseq classification. (c) Concordance between MSIseq and MMRDetect on 2,012 GEL colorectal cancers, 713 GEL uterine cancers, 2,024 Hartwig metastatic cancers and 2,610 cancers from PCAWG & SCANB projects. The bars show the numbers of samples that were identified as MMR deficient by only MSIseq (pink), only MMRDetect (blue), both (yellow) and none (purple). (d) The distribution of three variables amongst samples that were discordantly (blue, pink) and concordantly (yellow and purple) detected by MSIseq and MMRDetect: the number of repeat-mediated indels, number of mutations associated with MMRD signatures and non-MMRD mutations. Numbers of MMR-deficient samples determined by MMRDetect only (blue), MSIseq only (pink), both (yellow) and none (purple) are 34, 20, 587 and 6,718, respectively.
Figure 6
Figure 6. Impact of experimental validation of cancer-derived mutational signatures on biological understanding and development of clinical applications.
Some genes (often involved in DNA repair pathways) which are important guardians against endogenous DNA damage under non-malignant circumstances, have been identified in this work. They help to validate and to understand the etiologies of cancer-derived mutational signatures. The biological insights help to drive the development of new genomic clinical tools to detect these abnormalities with greater accuracy and sensitivity across tumor types.

References

    1. Helleday T, Eshtad S, Nik-Zainal S. Mechanisms underlying mutational signatures in human cancers. Nat Rev Genet. 2014;15:585–598. - PMC - PubMed
    1. Alexandrov LB, et al. Signatures of mutational processes in human cancer. Nature. 2013;500:415–421. - PMC - PubMed
    1. Nik-Zainal S, et al. The life history of 21 breast cancers. Cell. 2012;149:994–1007. - PMC - PubMed
    1. Nik-Zainal S, et al. Mutational processes molding the genomes of 21 breast cancers. Cell. 2012;149:979–993. - PMC - PubMed
    1. Haradhvala NJ, et al. Distinct mutational signatures characterize concurrent loss of polymerase proofreading and mismatch repair. Nature Communications. 2018;9:1746. - PMC - PubMed

Publication types

MeSH terms

Supplementary concepts