. 2021 Aug;599(16):3973-3991.
doi: 10.1113/JP281698.

T cells mediate cell non-autonomous arterial ageing in mice

Affiliations

T cells mediate cell non-autonomous arterial ageing in mice

Daniel W Trott et al. J Physiol. 2021 Aug.

Abstract

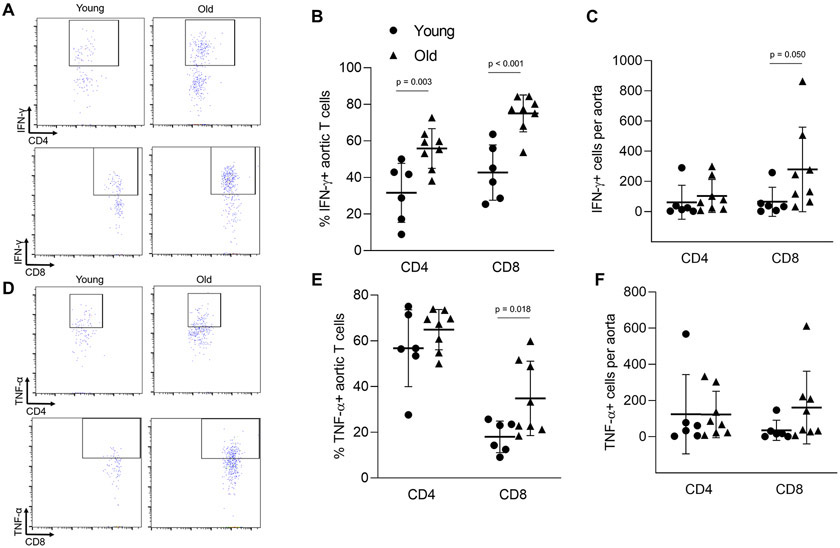
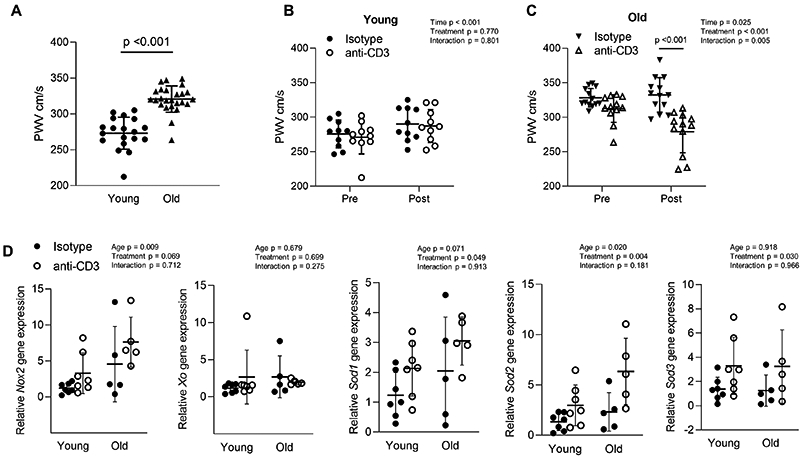
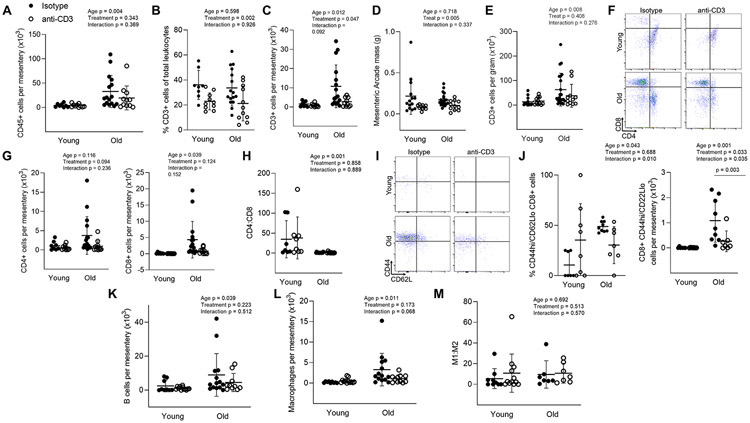
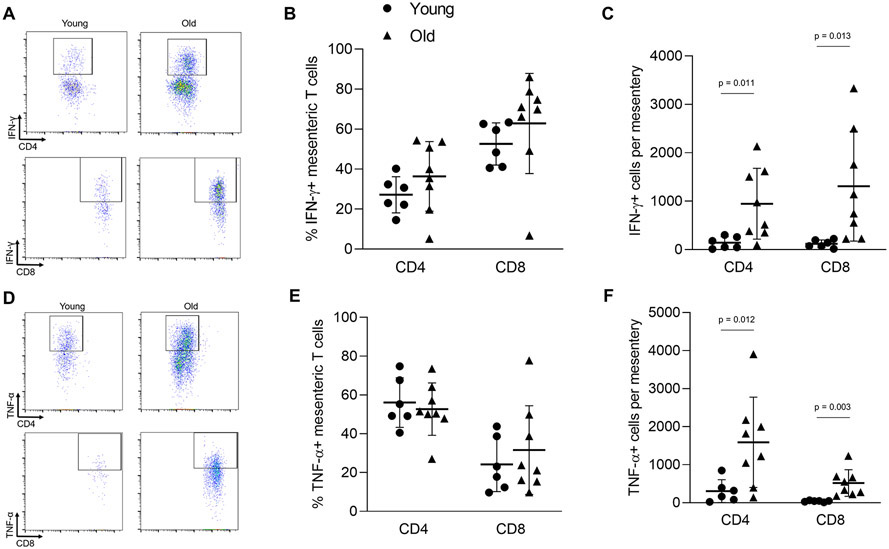
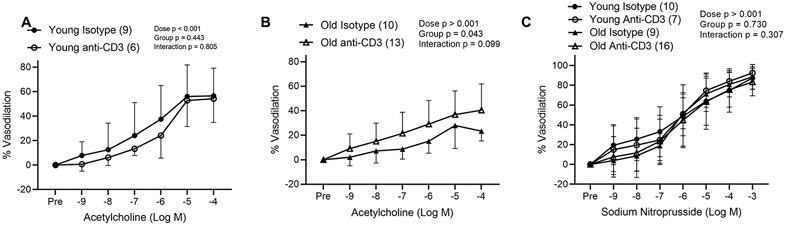
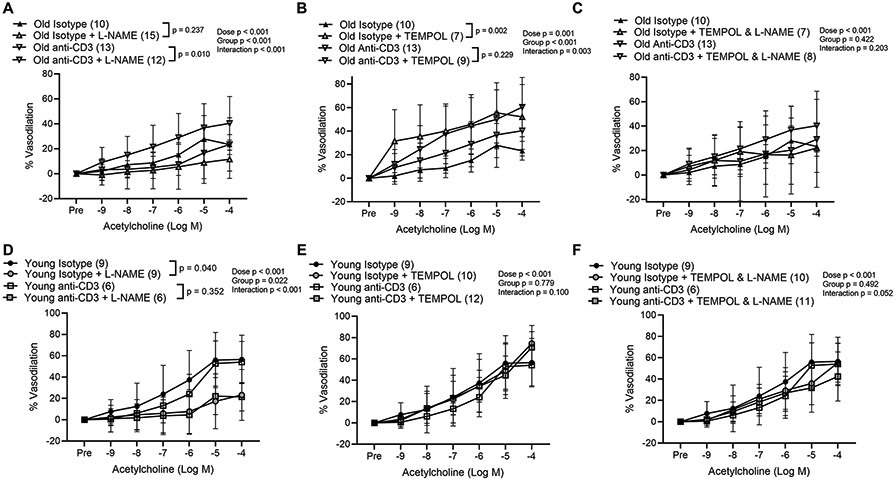
Key points: Increased large artery stiffness and impaired endothelium-dependent dilatation occur with advanced age. We sought to determine whether T cells mechanistically contribute to age-related arterial dysfunction. We found that old mice exhibited greater proinflammatory T cell accumulation around both the aorta and mesenteric arteries. Pharmacologic depletion or genetic deletion of T cells in old mice resulted in ameliorated large artery stiffness and greater endothelium-dependent dilatation compared with mice with T cells intact.

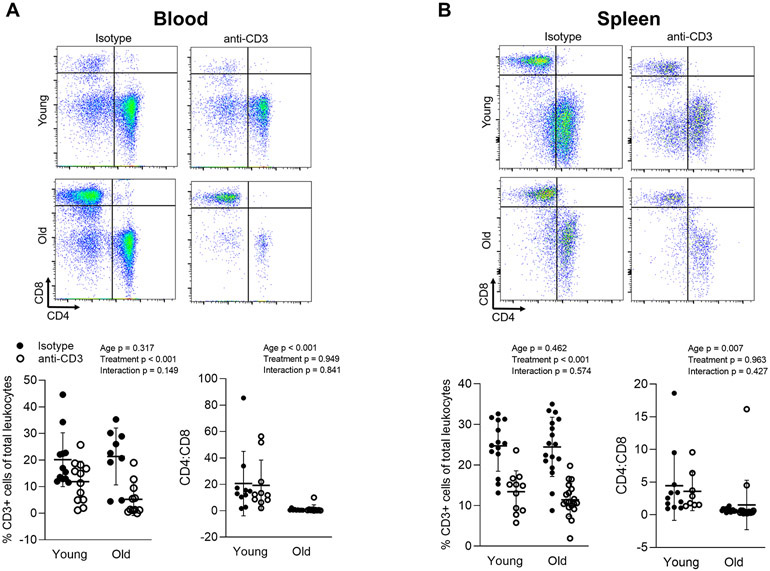
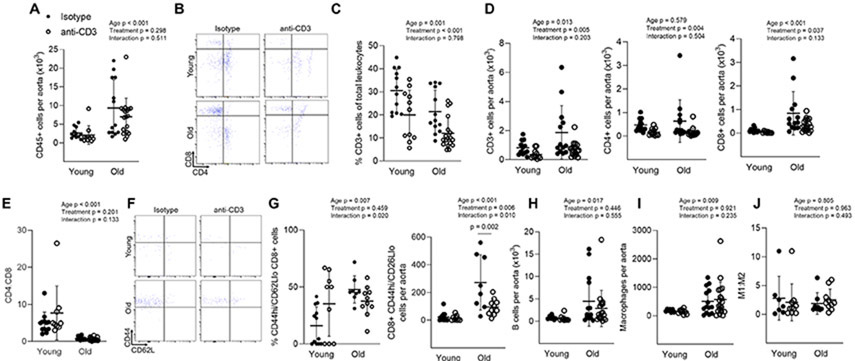
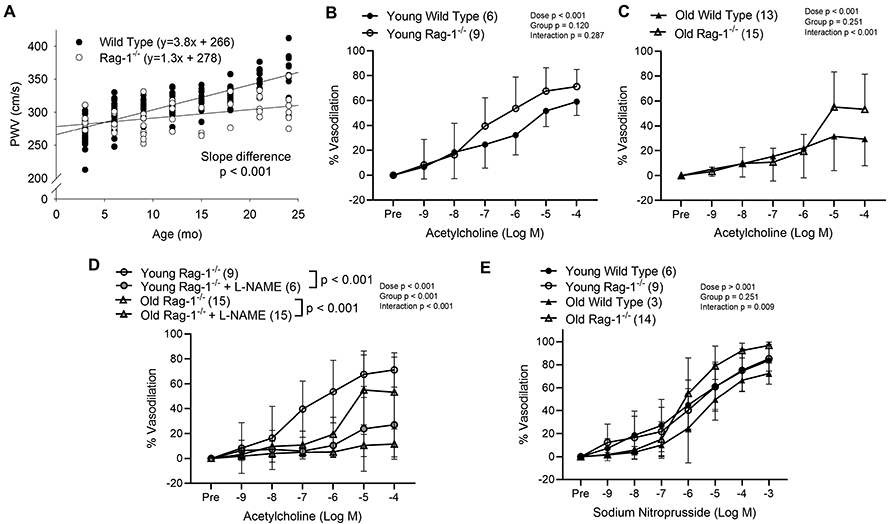
Abstract: Ageing of the arteries is characterized by increased large artery stiffness and impaired endothelium-dependent dilatation. T cells contribute to hypertension in acute rodent models but whether they contribute to chronic age-related arterial dysfunction is unknown. To determine whether T cells directly mediate age-related arterial dysfunction, we examined large elastic artery and resistance artery function in young (4-6 months) and old (22-24 months) wild-type mice treated with anti-CD3 F(ab'2) fragments to deplete T cells (150 μg, i.p. every 7 days for 28 days) or isotype control fragments. Old mice exhibited greater numbers of T cells in both aorta and mesenteric vasculature when compared with young mice. Old mice treated with anti-CD3 fragments exhibited depletion of T cells in blood, spleen, aorta and mesenteric vasculature. Old mice also exhibited greater numbers of aortic and mesenteric IFN-γ and TNF-α-producing T cells when compared with young mice. Old control mice exhibited greater large artery stiffness and impaired resistance artery endothelium-dependent dilatation in comparison with young mice. In old mice, large artery stiffness was ameliorated with anti-CD3 treatment. Anti-CD3-treated old mice also exhibited greater endothelium-dependent dilatation than age-matched controls. We also examined arterial function in young and old Rag-1-/- mice, which lack lymphocytes. Rag-1-/- mice exhibited blunted increases in large artery stiffness with age compared with wild-type mice. Old Rag-1-/- mice also exhibited greater endothelium-dependent dilatation compared with old wild-type mice. Collectively, these results demonstrate that T cells play an important role in age-related arterial dysfunction.

Keywords: aorta; endothelium; immune system; lymphocytes; mesentery; vascular.


Figures

Figure 1:
Figure 1:. anti-CD3 F(ab’)2 Fragment treatment results in depletion of T cells in the blood and spleen.
Blood (100 μL) from young isotype (n = 10), young anti-CD3 (n = 10), old isotype (n = 9), old anti-CD3 mice (n = 10) mice was directly stained. Spleens from young isotype (n = 11-14), young anti-CD3 (n = 8-11), old isotype (n = 15-17), old anti-CD3 mice (n = 18-19) were enzymatically digested and passed through a cell strainer and then stained for CD45 (total leukocytes), CD3 (pan T cells), CD4 and CD8. Percentages of CD3+ cells and CD4-to-CD8 ratio in (A) blood and (B) spleen were assessed by flow cytometry. A two-way ANOVA was employed to assess the effects of age and anti-CD3 treatment, p values for age, treatment and the age x treatment interaction are inset on each panel. Data are shown as mean ± standard deviation, n represents the number of independent animals in each group.
Figure 2:
Figure 2:. Aortic T cell accumulation with age and anti-CD3 F(ab’)2 Fragment treatment.
Single cell suspensions of thoracic aortas from young isotype (n = 7-12), young anti-CD3 (n = 9-11), old isotype (n = 8-14), old anti-CD3 mice (n = 10-19) were stained with antibodies against CD45 (total leukocytes), CD3 (pan T cells), CD4, CD8, CD44 (memory) and CD62L (central vs. effector). (A) Number of total leukocytes per aorta. (B) Sample aortic CD4 and CD8 flow cytometry plot. (C) Aortic pan, CD4 and CD8 T cell counts. (D) Percentage of CD3 cells out of total aortic immune cells. (E) Aortic CD4:CD8 ratio. (F) Sample aortic naïve (CD44lo) vs memory (CD44hi) flow cytometry plots. (G) Aortic CD8 effector memory T cell proportion and counts. To assess aortic macrophage and B cell accumulation, thoracic aorta single cell suspensions were stained for CD45 (total leukocytes), CD19 (B cells), CD64 (macrophages), CD11c (exclusion of dendritic cells) and CD206 (M1/M2 macrophage phenotype. (H) Aortic B cell counts. (I) Aortic macrophage counts. (J) macrophage M1:M2 ratio. A two-way ANOVA was employed to assess the effects of age and anti-CD3 treatment, p values for age, treatment and the age x treatment interaction are inset on each panel. When a significant age x treatment interaction occurred Tukey’s post hoc test was employed to determine group differences. Significant post hoc test p values are included on the panel with a horizontal line indicating the group comparison. Data are shown as mean ± standard deviation, n represents the number of independent animals in each group.
Figure 3:
Figure 3:. Aging results in an enhanced proinflammatory phenotype of aortic accumulating T cells.
Single cell suspensions of thoracic aortas from young (n = 6) and old (n = 8) mice were activated in vitro and stained for CD45 (total leukocytes), CD3 (pan T cells), CD4, CD8, interferon (IFN)-γ and tumor necrosis factor (TNF)-α. (A) Sample IFN-γ flow cytometry plots. (B) Proportion and (C) number of IFN-γ producing T cells. (D) Sample TNF-α flow cytometry plots. (E) Proportion and (F) number of TNF-α producing T cells. Group differences were assessed with an independent samples T test, p values are included on the panel with a horizontal line indicating the group comparison. Data are shown as mean ± standard deviation, n represents the number of independent animals in each group.
Figure 4:
Figure 4:. T cell depletion reverses age-related increases in large artery stiffness.
Aortic pulse wave velocity (PWV) was assessed in young (n = 19) and old (n = 25) (A) before anti-CD3 treatment and an independent samples T test was used to assess group differences. p values are included on the panel with a horizontal line indicating the group comparison. PWV was assessed before and after anti-CD3 F(ab’)2 fragment treatment in (B) young (n = 10 per group) and (C) old mice (n = 12-13 per group). A repeated measures ANOVA was used to assess the effect of time, treatment and time x treatment interaction, with p values inset on each panel. When a significant age x treatment interaction occurred Sidak’s post hoc test was employed to determine group differences. Significant post hoc test p values are included on the panel with a vertical line indicating the group comparison. (D) Gene expression of Nox2, Xanthine Oxidase (Xo), Superoxide Dismutase isoforms 1-3 (Sod1, 2 & 3) from aortas of young isotype (n = 7), young anti-CD3 (n = 7) old isotype (n = 5) and old anti-CD3 treated (n = 5) mice. Gene expression data are expressed as fold change compared to young isotype calculated using the ΔΔCt method. Two-way ANOVA was employed to assess the effects of age and anti-CD3 treatment. p values for age, treatment and the age x treatment interaction are inset on each panel. Data are shown as mean ± standard deviation, n represents the number of independent animals in each group.
Figure 5:
Figure 5:. Mesenteric T cell accumulation with age and anti-CD3 F(ab’)2 Fragment treatment.
Single cell suspensions of the mesenteric vascular arcade from young isotype (n = 8-14), young anti-CD3 (n = 10-12), old isotype (n = 9-21) and old anti-CD3 mice (n = 7-11) (excluding lymph nodes) were stained for CD45 (total leukocytes), CD3 (pan T cells), CD4, CD8, CD44 (memory) and CD62L (central vs. effector). (A) Number of total leukocytes per mesentery. (B) Proportion of CD3 cells out of all mesenteric leukocytes. (C) Mesenteric CD3 cell counts. (D) Mesenteric arcade mass. (E) Mesenteric CD3 cell counts normalized to tissue mass. (F) Sample CD4 and CD8 flow cytometry plot. (G) Mesenteric CD4 (left) and CD8 (right) T cell counts. (H) Mesenteric CD4:CD8 ratio. (I) Sample mesenteric naïve (CD44lo) vs memory (CD44hi) flow cytometry plots. (J) Proportion of mesenteric (left) and counts (right) of CD8 CD44hi/CD62Llo effector memory T cell counts. To assess mesenteric macrophage and B cell accumulation, mesenteric single cell suspensions were stained for CD45 (total leukocytes), CD19 (B cells), CD64 (macrophages), CD11c (exclusion of dendritic cells) and CD206 (M1/M2 macrophage phenotype. (K) mesenteric B cell counts. (L) mesenteric macrophage counts. (M) macrophage M1:M2 ratio. Two-way ANOVA was employed to assess the effects of age and anti-CD3 treatment. p values for age, treatment and the age x treatment interaction are inset on each panel. When a significant age x treatment interaction occurred Tukey’s post hoc test was employed to determine group differences. Significant post hoc test p values are included on the panel with a horizontal line indicating the group comparison. Data are shown as mean ± standard deviation, n represents the number of independent animals in each group.
Figure 6:
Figure 6:. Aging results in an enhanced proinflammatory phenotype of mesenteric accumulating T cells.
To assess cytokine production, mesenteric single cell suspensions from young (n = 6) and old (n = 8) mice were activated in vitro. Cells were then stained for CD45 (total leukocytes), CD3 (pan T cells), CD4, CD8, interferon (IFN)-γ and tumor necrosis factor (TNF)-α. (A) Sample IFN-γ flow cytometry plots. (B) Proportion and (C) number of IFN-γ producing T cells. (D) Sample TNF-α flow cytometry plots. (E) Proportion and (F) number of TNF-α producing T cells. Group differences were assessed with an independent samples T test. p values are included on the panel with a horizontal line indicating the group comparison. Data are shown as mean ± standard deviation, n represents the number of independent animals in each group.
Figure 7:
Figure 7:. T cell depletion results in augmented endothelium dependent dilation in mesenteric arteries from old mice.
Endothelium dependent dilation was assessed in 2nd order mesenteric arteries from (A) young Isotype control, young anti-CD3, (B) old isotype control and old anti-CD3 mice in response to increasing doses of acetylcholine. (C) Endothelium independent dilation was assessed in 2nd order mesenteric arteries in from young Isotype control, young anti-CD3, old isotype control and old anti-CD3 mice in response to increasing doses of sodium nitroprusside. Dose response curve data are expressed as means ± standard deviation. A repeated measures ANOVA was used to assess the effect of dose, treatment and dose x treatment interaction, with p values inset on each panel. n sizes are in parentheses next to the corresponding group in each panel legend and represents the number of independent animals in each group.
Figure 8:
Figure 8:. T cell depletion results in augmented nitric oxide bioavailability in mesenteric arteries from old mice.
Endothelium dependent dilation in response to increasing doses of acetylcholine was assessed in 2nd order mesenteric arteries from old isotype control or old mice treated with anti-CD3 F(ab)’2 fragments in the presence or absence of (A) L-NAME, (B) TEMPOL and (C) TEMPOL & L-NAME. Endothelium dependent dilation was also assessed in arteries from young isotype control mice or young mice treated with anti-CD3 F(ab)’2 fragments in the presence or absence of (D) L-NAME, (E) TEMPOL and (F) TEMPOL & L-NAME. Dose response curve data are expressed as means ± standard deviation. A repeated measures ANOVA was used to assess the effect of dose, group and dose x group interaction, with p values inset on each panel. In the case of a significant group effect, Tukey’s post hoc test was used to compare groups with comparison p values indicated on the legend of each figure panel. In the case of a significant dose x group interaction, Tukey’s post hoc test was employed to assess significant main effects of dose with p values reported in the text. n sizes are in parentheses next to the corresponding group in each panel legend and represents the number of independent animals in each group.
Figure 9:
Figure 9:. Arterial function is preserved in a genetic model of lymphocyte deficiency
(A) Aortic pulse wave velocity (PWV) was assessed every three months in wild type and Rag-1−/− mice (n = 4-24 mice per age, PWV was assessed in some mice of both strains at multiple ages). Endothelium dependent dilation in response to increasing doses of acetylcholine was assessed in 2nd order mesenteric arteries from (B) young wild type (WT) and Rag-1−/− and (C) old WT and Rag-1−/− mice. (D) Endothelium dependent dilation in response to increasing doses of acetylcholine was assessed in 2nd order mesenteric arteries from young and old Rag-1−/− mice in the presence and absence of L-NAME. (E) Endothelium independent dilation was assessed in 2nd order mesenteric arteries from young WT and Rag-1−/− and old WT and Rag-1−/− in response to increasing doses of sodium nitroprusside. Dose response curve data are expressed as means ± SD. A repeated measures ANOVA was used to assess the effect of dose, group and dose x group interaction, with p values inset on each panel. In the case of a significant group effect, Tukey’s post hoc test was used to compare groups with comparison p values indicated on the group names on figure panel. In the case of a significant dose x group interaction, Sidak’s (2 groups) or Tukey’s post hoc test (more than 2 groups) was employed to assess significant main effects of dose with p values reported in the text. n sizes are in parentheses next to the corresponding group in each panel for panels B-E, in these panels, n represents the number of independent animals in each group.

Comment in

References

    1. Ben-Shlomo Y, Spears M, Boustred C, May M, Anderson SG, Benjamin EJ, Boutouyrie P, Cameron J, Chen CH, Cruickshank JK, Hwang SJ, Lakatta EG, Laurent S, Maldonado J, Mitchell GF, Najjar SS, Newman AB, Ohishi M, Pannier B, Pereira T, Vasan RS, Shokawa T, Sutton-Tyrell K, Verbeke F, Wang KL, Webb DJ, Willum Hansen T, Zoungas S, McEniery CM, Cockcroft JR & Wilkinson IB (2014). Aortic pulse wave velocity improves cardiovascular event prediction: an individual participant meta-analysis of prospective observational data from 17,635 subjects. J Am Coll Cardiol 63, 636–646. - PMC - PubMed
    1. Blackwell KA, Sorenson JP, Richardson DM, Smith LA, Suda O, Nath K & Katusic ZS (2004). Mechanisms of aging-induced impairment of endothelium-dependent relaxation: role of tetrahydrobiopterin. Am J Physiol Heart Circ Physiol 287, H2448–2453. - PubMed
    1. Callahan JE, Kappler JW & Marrack P (1993). Unexpected expansions of CD8-bearing cells in old mice. J Immunol 151, 6657–6669. - PubMed
    1. Camell CD, Günther P, Lee A, Goldberg EL, Spadaro O, Youm YH, Bartke A, Hubbard GB, Ikeno Y, Ruddle NH, Schultze J & Dixit VD (2019). Aging Induces an Nlrp3 Inflammasome-Dependent Expansion of Adipose B Cells That Impairs Metabolic Homeostasis. Cell Metab 30, 1024–1039.e1026. - PMC - PubMed
    1. Chan CT, Sobey CG, Lieu M, Ferens D, Kett MM, Diep H, Kim HA, Krishnan SM, Lewis CV, Salimova E, Tipping P, Vinh A, Samuel CS, Peter K, Guzik TJ, Kyaw TS, Toh BH, Bobik A & Drummond GR (2015). Obligatory Role for B Cells in the Development of Angiotensin II-Dependent Hypertension. Hypertension 66, 1023–1033. - PubMed

Publication types