. 2021 Aug;25(16):7660-7674.
doi: 10.1111/jcmm.16603. Epub 2021 Jun 24.

METTL3/N6-methyladenosine/ miR-21-5p promotes obstructive renal fibrosis by regulating inflammation through SPRY1/ERK/NF-κB pathway activation

Affiliations

METTL3/N6-methyladenosine/ miR-21-5p promotes obstructive renal fibrosis by regulating inflammation through SPRY1/ERK/NF-κB pathway activation

Erpeng Liu et al. J Cell Mol Med. 2021 Aug.

Abstract

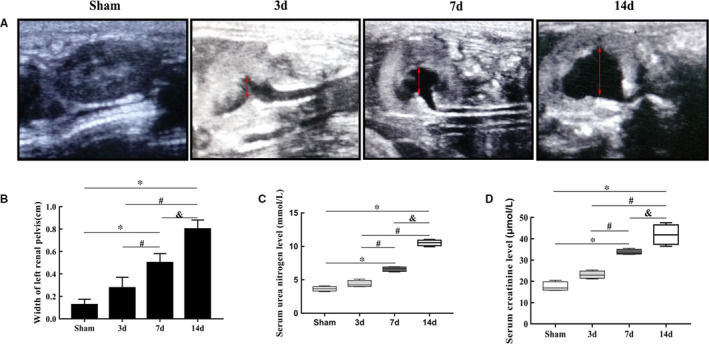
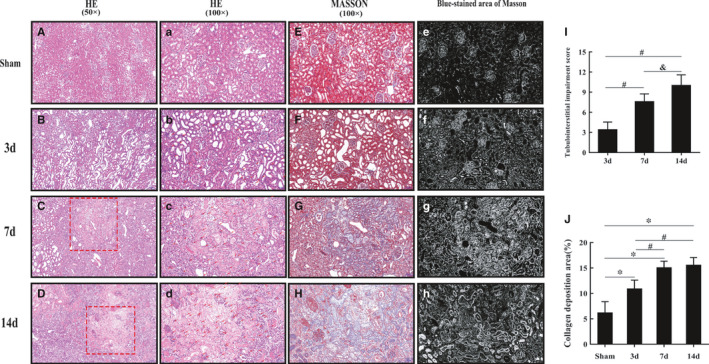
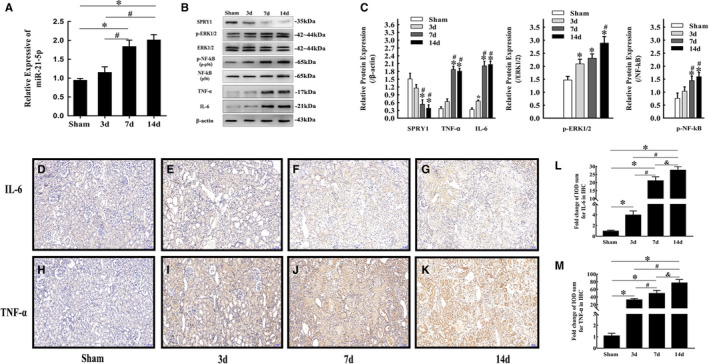
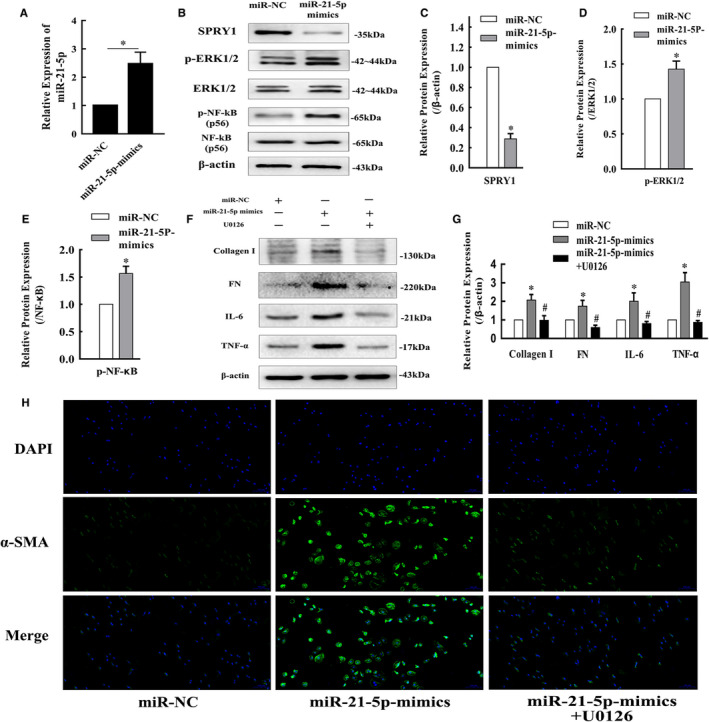
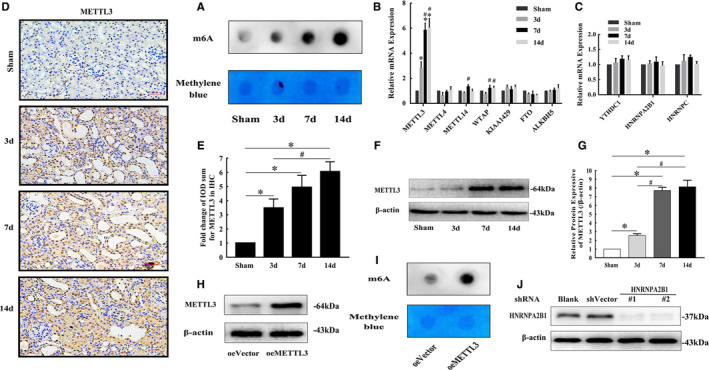
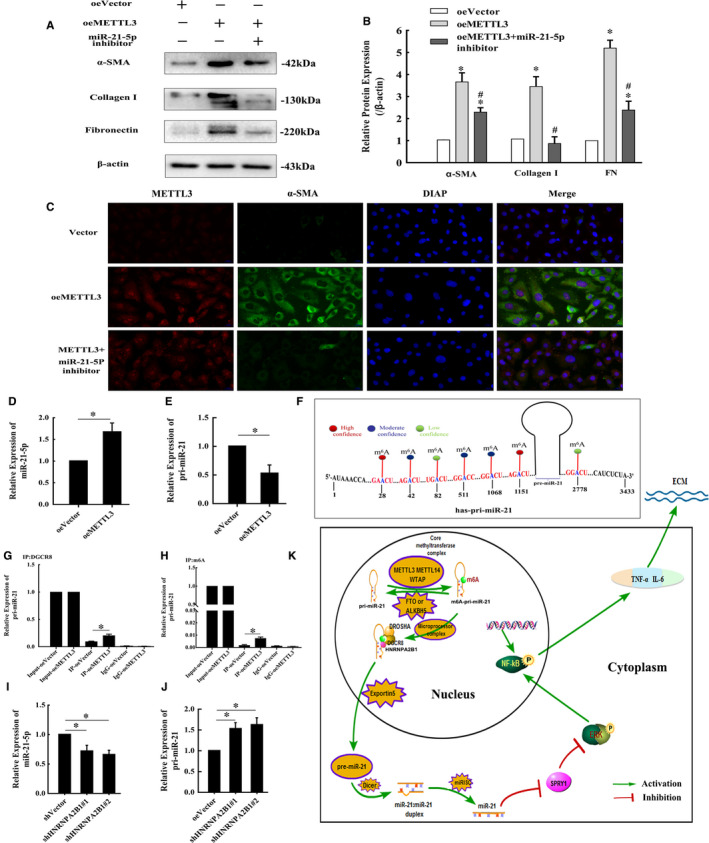
Renal fibrosis induced by urinary tract obstruction is a common clinical occurrence; however, effective treatment is lacking, and a deeper understanding of the mechanism of renal fibrosis is needed. Previous studies have revealed that miR-21 impacts liver and lung fibrosis progression by activating the SPRY1/ERK/NF-kB signalling pathway. However, whether miR-21 mediates obstructive renal fibrosis through the same signalling pathway has not been determined. Additionally, studies have shown that N6-methyladenosine (m6 A) modification-dependent primary microRNA (pri-microRNA) processing is essential for maturation of microRNAs, but its role in the maturation of miR-21 in obstructive renal fibrosis has not yet been investigated in detail. To address these issues, we employed a mouse model of unilateral ureteral obstruction (UUO) in which the left ureters were ligated for 3, 7 and 14 days to simulate the fibrotic process. In vitro, human renal proximal tubular epithelial (HK-2) cells were transfected with plasmids containing the corresponding sequence of METTL3, miR-21-5p mimic or miR-21-5p inhibitor. We found that the levels of miR-21-5p and m6 A modification in the UUO model groups increased significantly, and as predicted, the SPRY1/ERK/NF-kB pathway was activated by miR-21-5p, confirming that miR-21-5p plays an important role in obstructive renal fibrosis by enhancing inflammation. METTL3 was found to play a major catalytic role in m6 A modification in UUO mice and drove obstructive renal fibrosis development by promoting miR-21-5p maturation. Our research is the first to demonstrate the role of the METTL3-m6 A-miR-21-5p-SPRY1/ERK/NF-kB axis in obstructive renal fibrosis and provides a deeper understanding of renal fibrosis.

Keywords: METTL3; N6-methyladenosine (m6A); Spry1/ERK/NF-κB; miR-21-5p; renal fibrosis; urinary tract obstruction.


Conflict of interest statement

The authors confirm that there are no conflicts of interest.

Figures

FIGURE 1
FIGURE 1
The dramatic change in left kidney morphology under ultrasonography and impairment of renal function. (A and B) The widths of the left renal pelvises in the sham and UUO mouse groups based on ultrasound images (mean ± SD, n = 6). C, BUN levels in the sham and UUO mouse groups. D, SCr levels in the sham and UUO mouse groups. *P < .05, compared to the sham group. # P < .05, compared to the 3‐day UUO group. & P < .05, compared to the 7‐day UUO group. To simplify the figure, we only listed the data and a representative picture of the sham‐operated mice killed on the 7th day after surgery to represent the sham group
FIGURE 2
FIGURE 2
With increased obstruction time, inflammation, parenchymal damage and collagen deposition become increasingly serious in the left renal cortex in the UUO mouse groups. (A‐D and a‐d) Representative histopathology images of obstructed kidneys in mice after HE staining (50× and 100×). Scale bars represent 200 μm and 100 μm. The two red rectangular areas refer to representative inflammatory foci in the 7‐day and 14‐day groups and are amplified in images c and d. The red arrows refer to inflammatory cells in the UUO groups. (E‐H) Representative histopathology images of obstructed kidneys in mice after Masson's trichrome staining (100×). Scale bar represents 100 μm. Images G and H show the same area as images c and d, respectively. (e‐h) Blue Masson's trichrome‐stained areas, which were transformed from image E, F, G and H using Image‐Pro Plus 6.0 software. The white area refers to the collagen deposition area. (I and J). Statistical analyses of tubulointerstitial damage scores and the degree of collagen deposition in different groups (mean ± SD, n = 6). *P < .05, compared to the sham group. # P < .05, compared to the 3‐day UUO group. & P < .05, compared to the 7‐day UUO group. To simplify the figure, we only listed the data and representative pictures of sham‐operated mice killed on the 7th day after surgery to represent the sham group
FIGURE 3
FIGURE 3
Progression of obstructive renal fibrosis in mice. (A‐C) Relative α‐SMA, collagen I and FN mRNA expression in the sham and UUO mouse groups determined by qRT‐PCR (mean ± SD, n = 3). (D‐E) Representative bands and fold changes in α‐SMA, collagen I and FN protein expression in the sham and UUO mouse groups determined by Western blotting (mean ± SD, n = 3). (F‐I) Representative IHC images and fold changes for α‐SMA, collagen I and FN in the different groups (100×); scale bar represents 100 μm (mean ± SD, n = 6). *P < .05, compared to the sham group. # P < .05, compared to the 3‐day UUO group. & P < .05, compared to the 7‐day UUO group. To simplify the figure, we only listed the data and representative pictures of sham‐operated mice killed on the 7th day after surgery to represent the sham group
FIGURE 4
FIGURE 4
miR‐21‐5p up‐regulation in obstructed kidneys of mice activated the SPRY1/ERK/NF‐kB signalling pathway and inflammation. (A) miR‐21‐5p levels in obstructed kidneys of mice in different groups determined by qRT‐PCR (mean ± SD, n = 3). (B and C) Representative bands and fold changes in Spry1, p‐ERK1/2, ERK1/2, p‐NF‐κB, NF‐κB, IL‐6 and TNF‐α protein expression in obstructed kidneys of mice in different groups, determined by Western blotting (mean ± SD, n = 3). (D‐M) Representative IHC images and fold changes in IL‐6 and TNF‐α levels in different groups (100×); scale bar represents 100 μm (mean ± SD, n = 6).*P < .05, compared to the sham group. # P < .05, compared to the 3‐day UUO group. & P < .05, compared to the 7‐day UUO group. To simplify the figure, we only listed the data and representative pictures of sham‐operated mice killed on the 7th day after surgery to represent the sham group
FIGURE 5
FIGURE 5
Enhanced miR‐21‐5p expression in HK‐2 cells promoted inflammation and fibrosis development via the SPRY1/ERK/NF‐kB signalling pathway. A, The fold change in miR‐21‐5p levels in HK‐2 cells transfected with miR‐21‐5p‐mimic determined by qRT‐PCR (mean ± SD, n = 3). (B‐E) Representative bands and fold changes in Spry1, p‐ERK1/2 and p‐NF‐κB protein expression in HK‐2 cells transfected with miR‐21‐5p‐mimic, determined by Western blotting (mean ± SD, n = 3). (F and G) Representative bands and fold changes in collagen I, FN, IL‐6 and TNF‐α protein expression in HK‐2 cells transfected with miR‐21‐5p‐mimic or treated with U0126, determined by Western blotting (mean ± SD, n = 3). H, Immunofluorescence staining of α‐SMA (100×) in HK‐2 cells showing that enhanced miR‐21‐5p expression increased α‐SMA expression, whereas treatment with U0126 reversed this effect; scale bar represents 100 μm. *P < .05, compared to miR‐NC. # P < .05, compared to miR‐21‐5p‐mimics
FIGURE 6
FIGURE 6
m6A methylation levels in RNA were increased in the UUO mouse groups, and METTL3 was the main functional methylation‐related enzyme. A, m6A dot blot assays of kidney tissues from mice in different groups. The methylation of RNA increased significantly in the UUO groups. Methylene blue stain was used as the loading control. B, mRNA levels of methylation enzymes involved in m6A formation in kidneys from mice in different groups (mean ± SD, n = 3). C, mRNA levels of nuclear reader proteins of m6A in kidneys from mice in different groups (mean ± SD, n = 3). (D and E) Representative IHC images and fold changes in METTL3 in kidneys from different groups (200×); scale bar represents 50 μm (mean ± SD, n = 6). (F and G) Representative bands and fold changes in METTL3 protein expression in kidneys from mice in different groups, determined by Western blotting (mean ± SD, n = 3). H, Representative bands of METTL3 protein expression in HK‐2 cells transfected with pGV657‐METTL3 plasmid, determined by Western blotting. I, m6A dot blot assays of HK‐2 cells. The methylation of RNA increased significantly after METTL3 overexpression. Methylene blue stain was used as the loading control. J, Representative bands of HNRNPA2B1 protein expression in HK‐2 cells transfected with PGV102‐shHNRNPA2B1#1 plasmid and PGV102‐shHNRNPA2B1#2 plasmid, demonstrated by Western blotting. *P < .05, compared to the sham mouse group or oeVector HK‐2 cell group. # P < .05, compared to the 3‐day UUO group. & P < .05, compared to the 7‐day UUO group. To simplify the figure, we only listed the data and representative pictures of sham‐operated mice killed on the 7th day after surgery to represent the sham group
FIGURE 7
FIGURE 7
METTL3 overexpression in HK‐2 cells may drive fibrosis development by promoting miRNA‐21 maturation. (A and B) Representative bands and fold changes in α‐SMA, collagen I and FN protein expression in HK‐2 cells transfected with pGV657‐METTL3 plasmid or cotransfected with miR‐21‐5p inhibitor, demonstrated by Western blotting (mean ± SD, n = 3). C, Immunofluorescence staining of α‐SMA and METTL3 (400×) in HK‐2 cells showing that METTL3 enhancement increased α‐SMA expression, whereas cotransfection with the miR‐21‐5p inhibitor weakened this effect; scale bar represents 20 μm. (D and E) miR‐21‐5p and pri‐miR‐21 levels in HK‐2 cells transfected with pGV657‐METTL3 plasmid determined by qRT‐PCR (mean ± SD, n = 3). F, Seven possible m6A modification sites exist in hsa‐pri‐miR‐21, including 2 high confidence positions based on prediction with SRAMP. G, The levels of pri‐miRNA‐21‐5p binding to DGCR8 in HK‐2 cells with METTL3 up‐regulation determined by qRT‐PCR. H, Immunoprecipitation of m6A‐modified RNA in HK‐2 cells with METTL3 up‐regulation, followed by qRT‐PCR to assess the pri‐miR‐21 m6A modification level. (I and J) miR‐21‐5p and pri‐miR‐21 levels in HK‐2 cells transfected with PGV102‐shHNRNPA2B1#1 plasmid and PGV102‐shHNRNPA2B1#2 plasmid measured via qRT‐PCR (mean ± SD, n = 3). K, Mode pattern of the METTL3‐m6A‐miR‐21‐5p‐SPRY1/ERK/NF‐kB regulatory network in obstructive renal fibrosis *P < .05, compared to the oeVector group. # P < .05, compared to the oeMETTL3 group

Similar articles

Cited by

References

    1. Liu L, Wang Y, Yan R, et al. BMP‐7 inhibits renal fibrosis in diabetic nephropathy via miR‐21 downregulation. Life Sci. 2019;238:116957. - PubMed
    1. Lyu H, Li X, Wu Q, Hao L. Overexpression of microRNA‐21 mediates Ang II‐induced renal fibrosis by activating the TGF‐beta1/Smad3 pathway via suppressing PPARalpha. J Pharmacol Sci. 2019;141:70‐78. - PubMed
    1. Tang CR, Luo SG, Lin X, et al. Silenced miR‐21 inhibits renal interstitial fibrosis via targeting ERK1/2 signaling pathway in mice. Eur Rev Med Pharmacol Sci. 2019;23:110‐116. - PubMed
    1. Patel V, Noureddine L. MicroRNAs and fibrosis. Curr Opin Nephrol Hypertens. 2012;21:410‐416. - PMC - PubMed
    1. Zhou TB, Jiang ZP. Role of miR‐21 and its signaling pathways in renal diseases. J Recept Signal Transduct Res. 2014;34:335‐337. - PubMed

Publication types

MeSH terms