

Is Europe facing an opioid crisis like the United States? An analysis of opioid use and related adverse effects in 19 European countries between 2010 and 2018
- PMID: 34165059
- PMCID: PMC8316471
- DOI: 10.1192/j.eurpsy.2021.2219
Is Europe facing an opioid crisis like the United States? An analysis of opioid use and related adverse effects in 19 European countries between 2010 and 2018
Abstract
Background: Given the ongoing opioid crisis in the United States (US), we investigated the opioid situation in Europe. The aims of the study are to provide an overview of trends in prescription opioid (PO) use and opioid-related adversities between 2010 and 2018 for different opioids in 19 European countries and to present a comparison with similar data from the US.
Methods: A multisource database study with national data from 19 European countries evaluating trends between 2010 and 2018 in (a) PO consumption, (b) high-risk (HR) opioid users, (c) opioid-related hospital admissions, (d) opioid-related overdose deaths, (e) opioid use disorder treatment entries, and (f) patients in opioid substitution therapy (OST). Within and between-country comparisons and comparisons with data from the US were made.
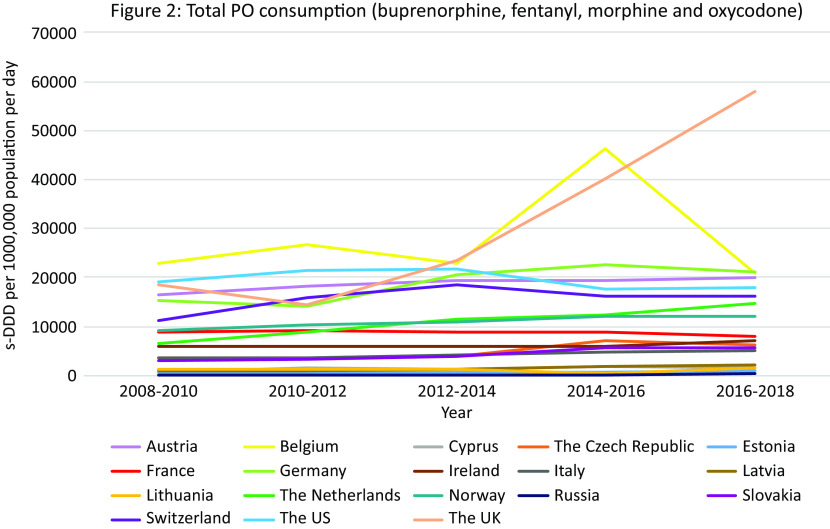
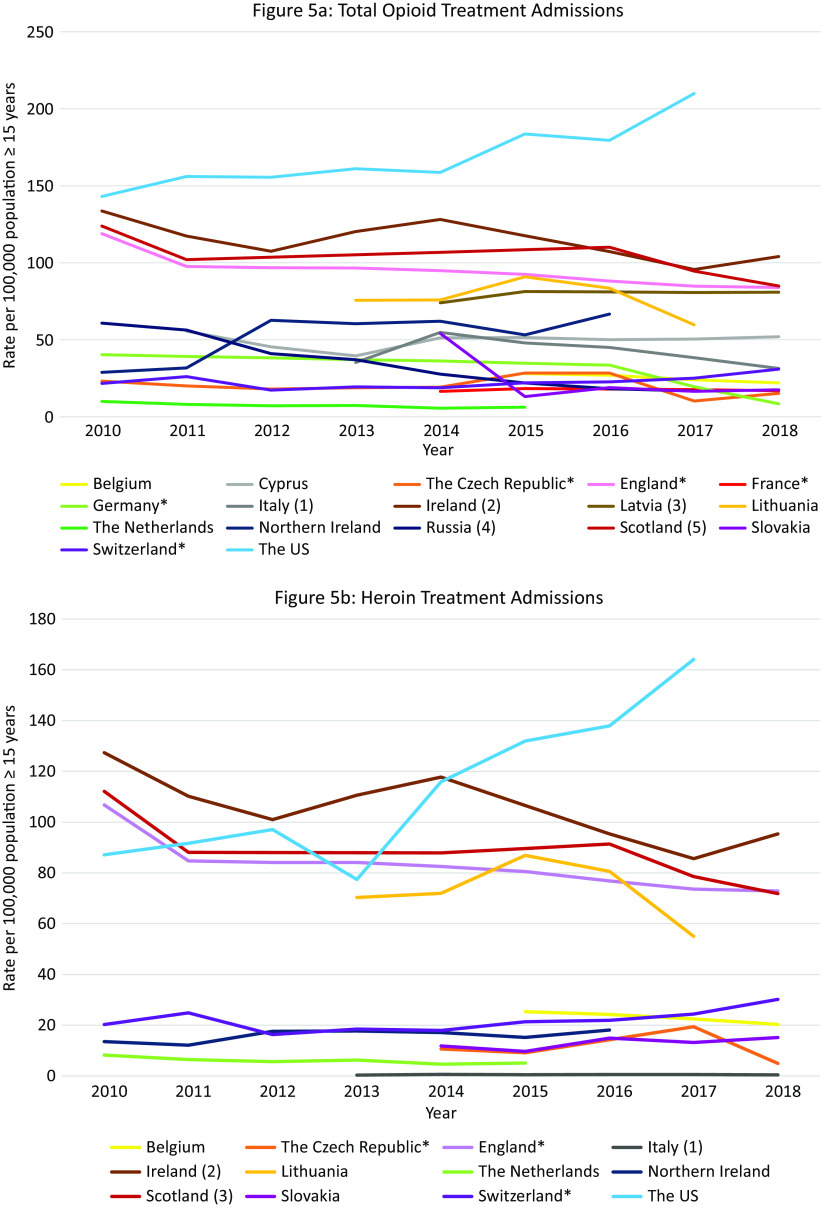
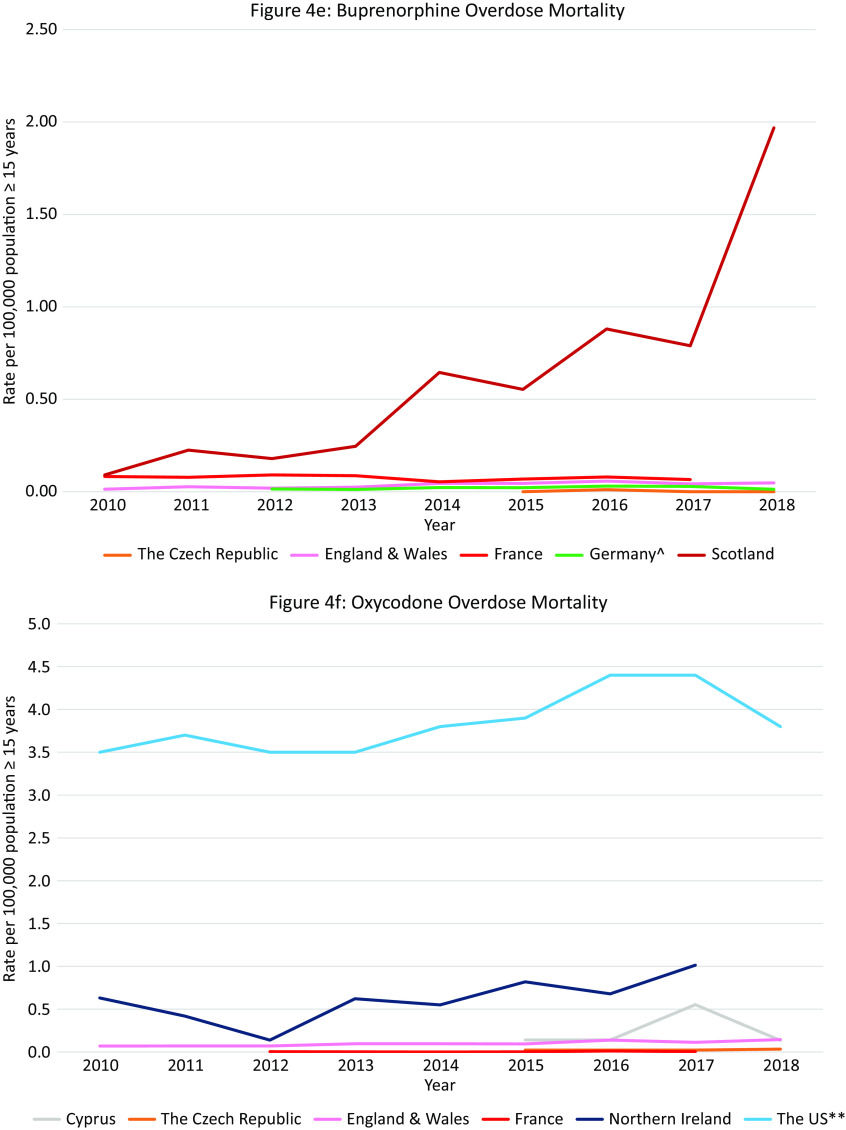
Results: There was considerable variation between European countries. Most countries showed increased PO consumption with the largest increase and the highest consumption in the United Kingdom (UK) compared to the rest of Europe and the US in 2018 (UK: 58,088 defined daily doses for statistical purposes/1000 population/day). In 2018, Scotland had the highest rates (per 100,000 population) of HR opioid users (16·2), opioid-related hospital admissions (118), opioid-related deaths (22·7), opioid use disorder treatment admissions (190), and OST patients (555) of all included European countries. These rates were similar or even higher than those in the US in 2018. Other countries with high rates of opioid-related adversities were Northern Ireland (synthetic and "other" opioids), Ireland (heroin and methadone), and England (all opioids). All other countries had no or little increase in opioid-related adversities.
Conclusions: Apart from the British Isles and especially Scotland, there is no indication of an opioid crisis comparable to that in the US in the 19 European countries that were part of this study. More research is needed to identify drivers and develop interventions to stop the emerging opioid crisis in the UK and Ireland.
Keywords: Europe; opioid crisis; opioid mortality; prescription opioids.
Figures


Similar articles
-
Is Europe also facing an opioid crisis?-A survey of European Pain Federation chapters.Eur J Pain. 2021 Sep;25(8):1760-1769. doi: 10.1002/ejp.1786. Epub 2021 May 15. Eur J Pain. 2021. PMID: 33960569
-
Is Europe Facing an Emerging Opioid Crisis Comparable to the U.S.?Ther Drug Monit. 2021 Feb 1;43(1):42-51. doi: 10.1097/FTD.0000000000000789. Ther Drug Monit. 2021. PMID: 32649487
-
Is Europe facing an opioid epidemic: What does European monitoring data tell us?Eur J Pain. 2021 May;25(5):1072-1080. doi: 10.1002/ejp.1728. Epub 2021 Feb 2. Eur J Pain. 2021. PMID: 33428812
-
Opioid prescription patterns in Germany and the global opioid epidemic: Systematic review of available evidence.PLoS One. 2019 Aug 28;14(8):e0221153. doi: 10.1371/journal.pone.0221153. eCollection 2019. PLoS One. 2019. PMID: 31461466 Free PMC article.
-
Explaining the Differences in Opioid Overdose Deaths between Scotland and England/Wales: Implications for European Opioid Policies.Eur Addict Res. 2021;27(6):399-412. doi: 10.1159/000516165. Epub 2021 May 7. Eur Addict Res. 2021. PMID: 33965949 Free PMC article.
Cited by
-
Psychiatric risk factors for chronic high-dose opioid prescribing: register-based cohort study.BJPsych Open. 2023 Apr 20;9(3):e74. doi: 10.1192/bjo.2023.54. BJPsych Open. 2023. PMID: 37078115 Free PMC article.
-
Opioid prescribing in the Netherlands during the COVID-19 pandemic: a national register-based study.BMJ Open. 2024 Aug 3;14(8):e082369. doi: 10.1136/bmjopen-2023-082369. BMJ Open. 2024. PMID: 39097314 Free PMC article.
-
Trends and correlated outcomes in population-level prescription opioid and transdermal fentanyl use in Israel.Isr J Health Policy Res. 2023 Mar 20;12(1):9. doi: 10.1186/s13584-023-00558-9. Isr J Health Policy Res. 2023. PMID: 36941731 Free PMC article.
-
Systemic Nonsteroidal Anti-Inflammatories for Analgesia in Postoperative Critical Care Patients: A Systematic Review and Meta-Analysis of Randomized Control Trials.Crit Care Explor. 2023 Jun 28;5(7):e0938. doi: 10.1097/CCE.0000000000000938. eCollection 2023 Jul. Crit Care Explor. 2023. PMID: 37396930 Free PMC article. Review.
-
Problematic Opioid Use: A Scoping Literature Review of Profiles.Subst Abuse. 2022 Jul 28;16:11782218221103581. doi: 10.1177/11782218221103581. eCollection 2022. Subst Abuse. 2022. PMID: 35923179 Free PMC article.
References
-
- Paulozzi LJ, Jones CM, Mack KA, Rudd RA. Vital signs: overdoses of prescription opioid pain relievers – United States, 1999–2008. MMWR Morb Mortal Wkly Rep. 2011;60(43):1487–92. - PubMed
-
- van J, van den W. The misuse of prescription opioids: a threat for Europe? Curr Drug Abuse Rev. 2015;8:3–14. - PubMed
-
- Rudd RA, Seth P, David F, School L. Increases in drug and opioid-involved overdose deaths – United States, 2010–2015. MMWR Morb Mortal Wkly Rep. 2016;65(50–51):1445–2. - PubMed
MeSH terms
Substances
LinkOut - more resources
Full Text Sources
Medical
