. 2021 Jun 24:10:e68318.
doi: 10.7554/eLife.68318.

Evaluating distributional regression strategies for modelling self-reported sexual age-mixing

Affiliations

Evaluating distributional regression strategies for modelling self-reported sexual age-mixing

Timothy M Wolock et al. Elife. .

Abstract

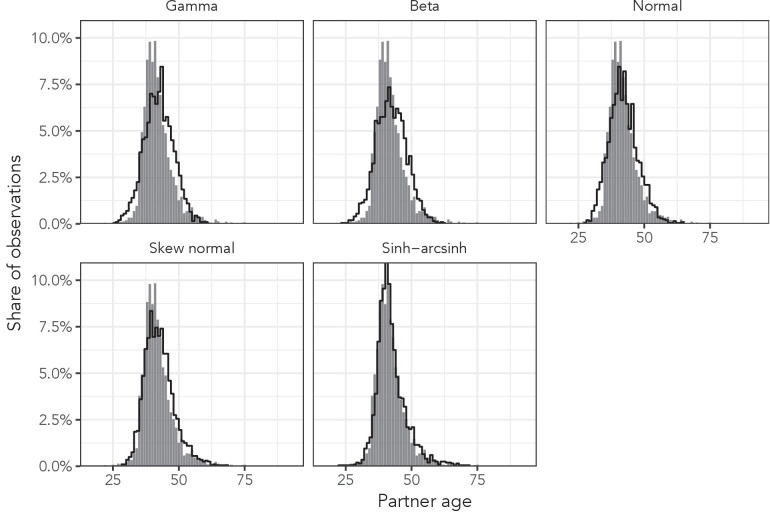
The age dynamics of sexual partnership formation determine patterns of sexually transmitted disease transmission and have long been a focus of researchers studying human immunodeficiency virus. Data on self-reported sexual partner age distributions are available from a variety of sources. We sought to explore statistical models that accurately predict the distribution of sexual partner ages over age and sex. We identified which probability distributions and outcome specifications best captured variation in partner age and quantified the benefits of modelling these data using distributional regression. We found that distributional regression with a sinh-arcsinh distribution replicated observed partner age distributions most accurately across three geographically diverse data sets. This framework can be extended with well-known hierarchical modelling tools and can help improve estimates of sexual age-mixing dynamics.

Keywords: age mixing; bayesian statistics; distributional regression; epidemiology; global health; none; sexual behaviour; sinh-arcsinh distribution.


Conflict of interest statement

TW, SF, KR, TD, SG, JE No competing interests declared

Figures

Figure 1.
Figure 1.. The sinh-arcsinh density with μ=0, σ=1, and a variety of assumptions about ϵ and δ.
Figure 2.
Figure 2.. Observed partner age distributions among women aged 34 years in all three data sets.
Figure 3.
Figure 3.. Observed means, variances, skewnesses, and kurtoses of partner age by 5-year age bin and sex in all three data sets.
Figure 4.
Figure 4.. Observed partner age distributions (grey bars) and posterior predictive partner age distributions (lines) for each probability distribution among women aged 35–39 in the AHRI data set.
Posterior predictive distributions come from fitting each age bin/sex combination independently.
Figure 5.
Figure 5.. Observed partner age distributions (grey bars) and posterior predictive partner age distributions (lines) for conventional regression and the most complex distributional model among men aged 16, 24, and 37 years in the AHRI data set.
Posterior predictive distributions come from regression models fit to the entire AHRI data set.
Figure 6.
Figure 6.. Estimated sinh-arcsinh distributional parameters from the conventional regression model, and distributional models 1 and 4 fit to the AHRI data.
‘Conventional’ assumes no variation across age and sex, ‘Distributional 1’ allows for independent age and sex effects, and ‘Distributional 4’ includes sex-specific splines with respect to age.
Figure 7.
Figure 7.. Estimated sinh-arcsinh distributional parameters for Distributional Model 4 fit to the three main data sets.
Appendix 1—figure 1.
Appendix 1—figure 1.. Illustration of the effect of the deheaping algorithm on women aged exactly 24 years in the AHRI data.
Dark grey bars correspond to ages identified as potentially heaped (multiples of five away from 24). The red line is the expected count of observations estimated by excluding any potentially heaped ages.
Appendix 1—figure 2.
Appendix 1—figure 2.. Observed sexual partner age distributions among women in the AHRI data.
The left panel is original data, and the right panel is the same data set after deheaping age differences from multiples of five.
Appendix 1—figure 3.
Appendix 1—figure 3.. Overlaid quantile-quantile (QQ) plots for each probability distribution’s best fit to data in all three main data sets.
Presented quantiles range from 10th to 90th in increments of 10. Lines closer to the line of equality indicate better fit to empirical quantiles.
Appendix 1—figure 4.
Appendix 1—figure 4.. Observed partner age distributions (grey bars) and posterior predictive partner age distributions (lines) for each probability distribution among women in the AHRI data set.
Here, we plot the posterior predicitve distribution associated with each distribution’s highest-ELPD dependent variable.
Appendix 1—figure 5.
Appendix 1—figure 5.. Observed partner age distributions (grey bars) and posterior predictive partner age distributions (lines) for each probability distribution among men in the AHRI data set.
Here, we plot the posterior predicitve distribution associated with each distribution’s highest-ELPD dependent variable.
Appendix 1—figure 6.
Appendix 1—figure 6.. Observed partner age distributions (grey bars) and posterior predictive partner age distributions (lines) for each probability distribution among women in the AHRI Deheaped data set.
Here, we plot the posterior predicitve distribution associated with each distribution’s highest-ELPD dependent variable.
Appendix 1—figure 7.
Appendix 1—figure 7.. Observed partner age distributions (grey bars) and posterior predictive partner age distributions (lines) for each probability distribution among men in the AHRI Deheaped data set.
Here, we plot the posterior predicitve distribution associated with each distribution’s highest-ELPD dependent variable.
Appendix 1—figure 8.
Appendix 1—figure 8.. Observed partner age distributions (grey bars) and posterior predictive partner age distributions (lines) for each probability distribution among women in the Haiti 2016–17 DHS data set.
Here, we plot the posterior predicitve distribution associated with each distribution’s highest-ELPD dependent variable.
Appendix 1—figure 9.
Appendix 1—figure 9.. Observed partner age distributions (grey bars) and posterior predictive partner age distributions (lines) for each probability distribution among men in the Haiti 2016–17 DHS data set.
Here, we plot the posterior predicitve distribution associated with each distribution’s highest-ELPD dependent variable.
Appendix 1—figure 10.
Appendix 1—figure 10.. Observed partner age distributions (grey bars) and posterior predictive partner age distributions (lines) for each probability distribution among women in the Manicaland data set.
Here, we plot the posterior predicitve distribution associated with each distribution’s highest-ELPD dependent variable.
Appendix 1—figure 11.
Appendix 1—figure 11.. Observed partner age distributions (grey bars) and posterior predictive partner age distributions (lines) for each probability distribution among men in the Manicaland data set.
Here, we plot the posterior predicitve distribution associated with each distribution’s highest-ELPD dependent variable.

References

    1. Akullian A, Bershteyn A, Klein D, Vandormael A, Bärnighausen T, Tanser F. Sexual partnership age pairings and risk of HIV acquisition in rural South Africa. AIDS. 2017;31:1755–1764. doi: 10.1097/QAD.0000000000001553. - DOI - PMC - PubMed
    1. Anderson RM, May RM, Ng TW, Rowley JT. Age-dependent choice of sexual partners and the transmission dynamics of HIV in Sub-Saharan Africa. Philosophical transactions of the Royal Society of London. Series B, Biological sciences. 1992;336:135–155. doi: 10.1098/rstb.1992.0052. - DOI - PubMed
    1. Arias Garcia S, Chen J, Calleja JG, Sabin K, Ogbuanu C, Lowrance D, Zhao J. Availability and Quality of Surveillance and Survey Data on HIV Prevalence Among Sex Workers, Men Who Have Sex With Men, People Who Inject Drugs, and Transgender Women in Low- and Middle-Income Countries: Review of Available Data (2001-2017) JMIR Public Health and Surveillance. 2020;6:e21688. doi: 10.2196/21688. - DOI - PMC - PubMed
    1. Beauclair R, Hens N, Delva W. The role of age-mixing patterns in HIV transmission dynamics: Novel hypotheses from a field study in Cape Town, South Africa. Epidemics. 2018;25:61–71. doi: 10.1016/j.epidem.2018.05.006. - DOI - PubMed
    1. Bürkner P-C. Advanced bayesian multilevel modeling with the R package brms. The R Journal. 2018;10:395–411. doi: 10.32614/RJ-2018-017. - DOI

Publication types