. 2021 Sep;42(13):4173-4186.
doi: 10.1002/hbm.25418. Epub 2021 Jun 24.

Graph theoretical analysis of evoked potentials shows network influence of epileptogenic mesial temporal region

Affiliations

Graph theoretical analysis of evoked potentials shows network influence of epileptogenic mesial temporal region

Mark A Hays et al. Hum Brain Mapp. 2021 Sep.

Abstract

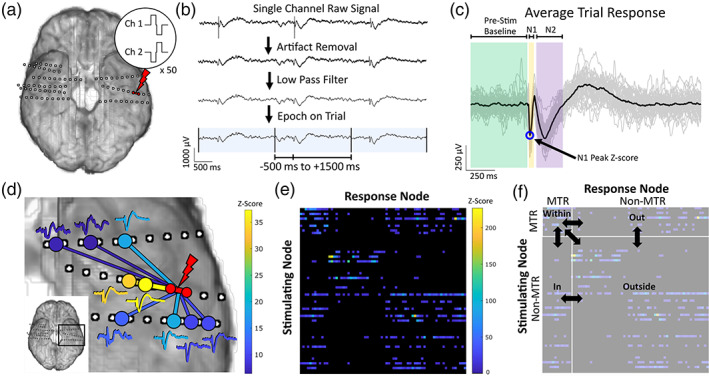
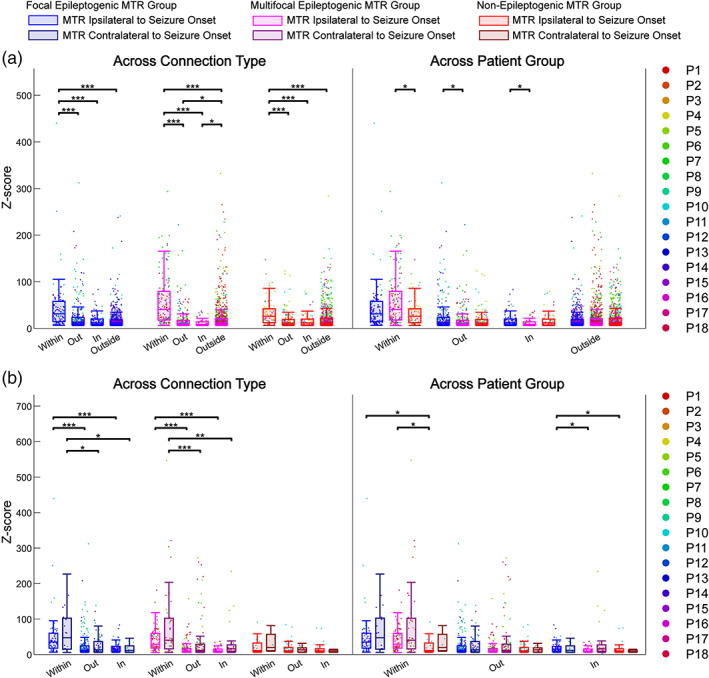
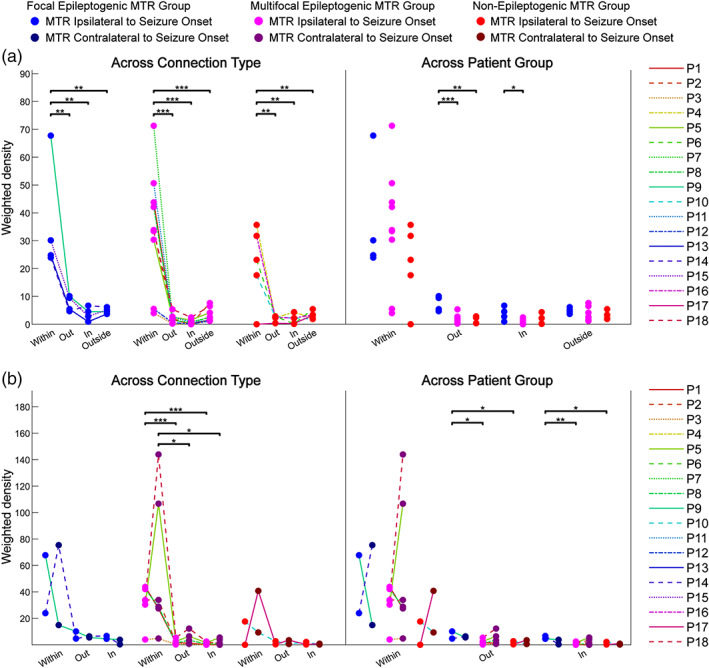
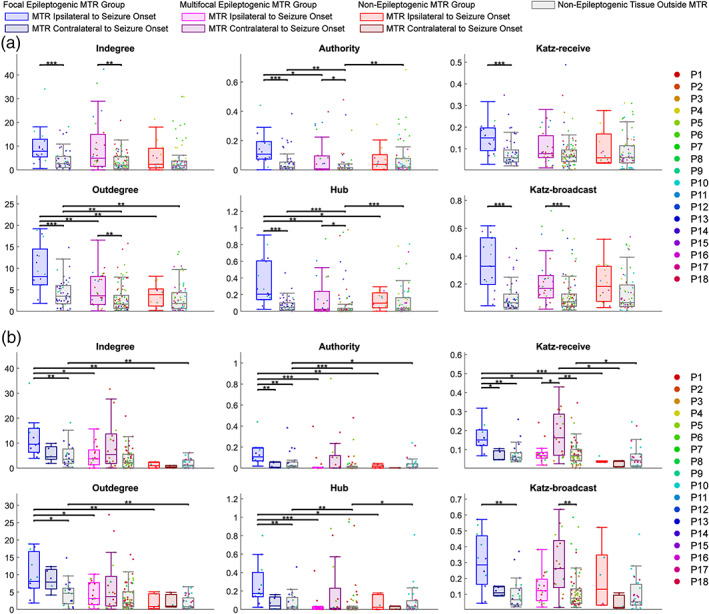
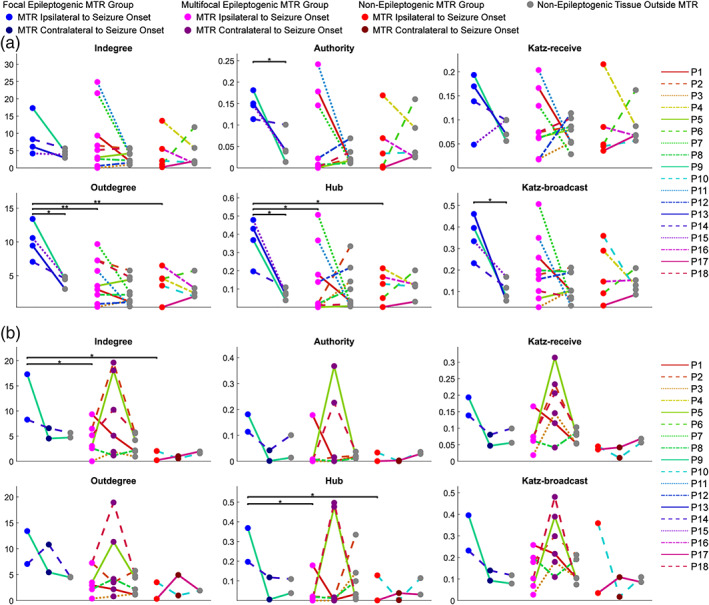
It is now widely accepted that seizures arise from the coordinated activity of epileptic networks, and as a result, traditional methods of analyzing seizures have been augmented by techniques like single-pulse electrical stimulation (SPES) that estimate effective connectivity in brain networks. We used SPES and graph analytics in 18 patients undergoing intracranial EEG monitoring to investigate effective connectivity between recording sites within and outside mesial temporal structures. We compared evoked potential amplitude, network density, and centrality measures inside and outside the mesial temporal region (MTR) across three patient groups: focal epileptogenic MTR, multifocal epileptogenic MTR, and non-epileptogenic MTR. Effective connectivity within the MTR had significantly greater magnitude (evoked potential amplitude) and network density, regardless of epileptogenicity. However, effective connectivity between MTR and surrounding non-epileptogenic regions was of greater magnitude and density in patients with focal epileptogenic MTR compared to patients with multifocal epileptogenic MTR and those with non-epileptogenic MTR. Moreover, electrodes within focal epileptogenic MTR had significantly greater outward network centrality compared to electrodes outside non-epileptogenic regions and to multifocal and non-epileptogenic MTR. Our results indicate that the MTR is a robustly connected subnetwork that can exert an overall elevated propagative influence over other brain regions when it is epileptogenic. Understanding the underlying effective connectivity and roles of epileptogenic regions within the larger network may provide insights that eventually lead to improved surgical outcomes.

Keywords: evoked potential; graph theory; intracranial EEG; mesial temporal lobe epilepsy; single-pulse electrical stimulation.


Conflict of interest statement

The authors declare no potential conflict of interest.

Figures

FIGURE 1
FIGURE 1
Experimental methods. (a) Single‐pulse electrical stimulation (SPES) using a biphasic 0.3 ms pulse is applied in a bipolar manner to adjacent electrodes for 50 trials at an interstimulus interval (ISI) of 1 or 2 s. Example pulse waveforms applied to the stimulating electrodes are pictured. (b) Raw signal recordings of each channel are pre‐processed before response analysis. After re‐referencing using a bipolar montage, stimulation artifacts within −5 to 10 ms relative to stimulus are removed, and a 50 Hz low pass filter is applied. Trials are selected using analysis windows of −500 to 1,500 ms for 2 s ISI (−250 to 750 ms for 1 s ISI). (c) Trials are centered using baseline (−500 to −5 ms for 2 s ISI, −250 to −5 ms for 1 s ISI) mean and averaged. The average response is normalized by the baseline standard deviation, and amplitude of the N1 peak within 10 to 50 ms is used to quantify the signal's Z‐score. (d) For each stimulated pair of electrodes, average responses with a Z‐score greater than 6 are considered significant evoked potentials, representing a causal electrophysiological relationship between the stimulation and response sites. Significant responses to one stimulation are shown here as an example, colored according to the magnitude of the Z‐score. (e) With multiple pairs of electrodes stimulated, the Z‐score responses of all channels from each stimulation block becomes one row in the adjacency matrix of the weighted, directed graph of effective connectivity. The magnitude of the causal relationship between a stimulating site and response site is quantified by the Z‐score at the row of the stimulating site and the column of the response site, shown here by color intensity. (f) Subnetworks are grouped based on location of stimulating and response sites with respect to mesial temporal region (MTR), either within (stimulate MTR, response in MTR), in (stimulate outside MTR, response in MTR), out (stimulate MTR, response outside MTR), or outside (stimulate outside MTR, response outside MTR). The properties of each subnetwork are calculated and compared to that of the others. MTR, mesial temporal region
FIGURE 2
FIGURE 2
Z‐Score comparisons of effective connectivity subnetworks. The Z‐scores of significant connections in subnetworks within, out, in, and outside relative to MTR are pooled over each patient group [focal epileptogenic MTR (n = 4), multifocal epileptogenic MTR (n = 9), non‐epileptogenic MTR (n = 5)] and compared using grouped Kruskal‐Wallis tests for effects of connection type and patient group, followed by post hoc Dunn's tests for pairwise comparisons. (a) Analysis using singular MTR ipsilateral to seizure onset zone across all patients (n = 18) showing comparisons across connection type and across patient group. (b) Analysis using MTR ipsilateral and contralateral to seizure onset zone in bilaterally stimulated patients (n = 10) showing comparisons across connection type and across patient group. *p < .05; **p < .01; ***p < .001. MTR, mesial temporal region
FIGURE 3
FIGURE 3
Weighted density comparisons of effective connectivity subnetworks. The weighted densities (sum of significant connections' Z‐scores divided by total possible connections) of effective connectivity subnetworks within, out, in, and outside relative to MTR are calculated for each patient and fit with linear mixed effects models to compare effects of connection type and patient group, followed by post hoc tests for pairwise comparisons. (a) Analysis using singular MTR ipsilateral to seizure onset zone across all patients (n = 18) showing comparisons across connection type and across patient group. (b) Analysis using MTR ipsilateral and contralateral to seizure onset zone in bilaterally stimulated patients (n = 10) showing comparisons across connection type and across patient group. *p < .05; **p < .01; ***p < .001. MTR, mesial temporal region
FIGURE 4
FIGURE 4
Graph centrality measures of nodes pooled within patient group. The centralities of every node within each location group (inside MTR ipsilateral to seizure onset, inside MTR contralateral to seizure onset, outside MTR in non‐epileptogenic tissue) are pooled within each patient group [focal epileptogenic MTR (n = 4), multifocal epileptogenic MTR (n = 9), non‐epileptogenic MTR (n = 5)] and compared using grouped Kruskal‐Wallis tests for effects of location and patient group, followed by post hoc Dunn's tests for pairwise comparisons. (a) Analysis using singular MTR ipsilateral to seizure onset zone across all patients (n = 18). (b) Analysis using MTR ipsilateral and contralateral to seizure onset zone in bilaterally stimulated patients (n = 10). *p < .05; **p < .01; ***p < .001. MTR, mesial temporal region
FIGURE 5
FIGURE 5
Graph centrality measures of nodes averaged for each patient. The centralities of nodes are averaged for each patient by location (inside MTR ipsilateral to seizure onset, inside MTR contralateral to seizure onset, outside MTR in non‐epileptogenic tissue) and fit with linear mixed effects models to compare effects of location and patient group, followed by post hoc tests for pairwise comparisons. (a) Analysis using singular MTR ipsilateral to seizure onset zone across all patients (n = 18). (b) Analysis using MTR ipsilateral and contralateral to seizure onset zone in bilaterally stimulated patients (n = 10). *p < .05; **p < .01. MTR, mesial temporal region

References

    1. Bartolomei, F., Chauvel, P., & Wendling, F. (2008). Epileptogenicity of brain structures in human temporal lobe epilepsy: a quantified study from intracerebral EEG. Brain, 131(7), 1818–1830. - PubMed
    1. Benjamini, Y., & Hochberg, Y. (1995). Controlling the false discovery rate: A practical and powerful approach to multiple testing. Journal of the Royal Statistical Society: Series B: Methodological, 57, 289–300.
    1. Boido, D., Kapetis, D., Gnatkovsky, V., Pastori, C., Galbardi, B., Sartori, I., … de Curtis, M. (2014). Stimulus‐evoked potentials contribute to map the epileptogenic zone during stereo‐EEG presurgical monitoring. Human Brain Mapping, 35(9), 4267–4281. - PMC - PubMed
    1. Catenoix, H., Magnin, M., Mauguière, F., & Ryvlin, P. (2011). Evoked potential study of hippocampal efferent projections in the human brain. Clinical Neurophysiology, 122(12), 2488–2497. - PubMed
    1. Crowther, L. J., Brunner, P., Kapeller, C., Guger, C., Kamada, K., Bunch, M. E., … Schalk, G. (2019). A quantitative method for evaluating cortical responses to electrical stimulation. Journal of Neuroscience Methods, 311, 67–75. - PMC - PubMed

Publication types