. 2022 Jan;16(1):88-103.
doi: 10.1002/1878-0261.13047. Epub 2021 Jul 12.

Breast cancer metastasis: immune profiling of lymph nodes reveals exhaustion of effector T cells and immunosuppression

Affiliations

Breast cancer metastasis: immune profiling of lymph nodes reveals exhaustion of effector T cells and immunosuppression

Inga Hansine Rye et al. Mol Oncol. 2022 Jan.

Abstract

Sentinel lymph nodes are the first nodes draining the lymph from a breast and could reveal early changes in the host immune system upon dissemination of breast cancer cells. To investigate this, we performed single-cell immune profiling of lymph nodes with and without metastatic cells. Whereas no significant changes were observed for B-cell and natural killer (NK)-cell subsets, metastatic lymph nodes had a significantly increased frequency of CD8 T cells and a skewing toward an effector/memory phenotype of CD4 and CD8 T cells, suggesting an ongoing immune response. Additionally, metastatic lymph nodes had an increased frequency of TIGIT (T-cell immunoreceptor with Ig and ITIM domains)-positive T cells with suppressed TCR signaling compared with non-metastatic nodes, indicating exhaustion of effector T cells, and an increased frequency of regulatory T cells (Tregs) with an activated phenotype. T-cell alterations correlated with the percentage of metastatic tumor cells, reflecting the presence of metastatic tumor cells driving T effector cells toward exhaustion and promoting immunosuppression by recruitment or increased differentiation toward Tregs. These results show that immune suppression occurs already in early stages of tumor progression.

Keywords: T-cell exhaustion; breast cancer; immune activation; immune profile; metastatic lymph nodes.


Conflict of interest statement

The authors declare no conflict of interest.

Figures

Fig. 1
Fig. 1
Simultaneous characterization of immune cells and tumor cells. Single‐cell suspensions of lymph nodes from 52 breast cancer patients were analyzed by mass cytometry. (A) viSNE map of all lineage markers from one representative SNmet (metastatic sentinel node) sample. Each dot in the viSNE map represents a single cell, and the position of each cell is based on similarity of the markers included in the viSNE analysis. The color of the dot represents expression intensity of markers as indicated. More markers are shown in Fig. S2. (B, C) The tumor cells from all samples with more than 100 live tumor cells (n = 11) were analyzed by hierarchical clustering (B) and viSNE (C). (D) Tumor cell percentage for each sample compared with pathology classification. The dotted line marks the selected threshold to call a sample as negative; 0.02%. Samples with no tumor cells are set to 0.001%. Lines represent median with ± 95% CI. P‐values from Kruskal–Wallis test and Dunn’s post hoc test. (E) Cross‐table showing concordance between pathology scoring and mass cytometry detection of tumor cells.
Fig. 2
Fig. 2
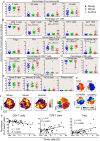
The T‐cell composition in ALNmet samples is skewed toward CD8 T cells and a memory phenotype. Frequency of immune subsets in lymph nodes analyzed by mass cytometry. Lines represent median with ± 95% CI. * indicates significance with Kruskal–Wallis test (Bonferroni corrected, 23 tests) and Dunn’s post hoc test. n = 52 unless otherwise stated. *P < 0.05, **P < 0.01 ***P < 0.001, ****P < 0.0001. (A) Main immune subsets calculated as percentage of total live CD45+ cells. APC = antigen‐presenting cells. (B) T‐cell subsets, calculated as percentage of total T cells, CD4 T cells, CD8 T cells, or DN T cells as indicated. DN = double negative, DP = double positive. (C) NK (natural killer)‐cell subsets, calculated as percentage of total NK cells. Samples with < 100 NK cells were excluded. n = 41. (D) B‐cell subsets, calculated as percentage of total B cells. Some samples were excluded due to suboptimal staining. n = 45 naive/memory. n = 49 GC (germinal center/plasma cells. (E, F) viSNE map of T cells concatenated from all lymph node samples based on the expression of CD4, CD8, CD45RA, CD45RO, TCRγδ, FoxP3, CD25, PD‐1. (F) Density maps show SNneg (non‐metastatic sentinel node), SNmet (metastatic sentinel node), and ALNmet (axillary metastatic lymph node) samples concatenated separately. Color indicated intensity of marker expression. (G) Correlation analysis of abundance of immune subsets vs tumor percentage (Spearman`s rank correlation). The straight line was found by linear regression of abundance of immune cells on the logarithm of tumor abundance. r S = Spearman correlation coefficient.
Fig. 3
Fig. 3
ALNmet samples have increased presence of TIGIT+PD‐1 + T cells and phenotypically activated Tregs. (A) A CITRUS analysis identified differential expression of exhaustion markers and Treg activation markers in T cells from ALNmet samples compared with SNneg (non‐metastatic sentinel node) and SNmet (metastatic sentinel node) samples (see also Fig. S4A–C and Table S6). The median intensity (arcsinh‐transformed) of such markers is shown for manually gated populations. Lines represent median with 95% CI. *P < 0.05, **P < 0.01 ***P < 0.001 in Kruskal–Wallis test (Bonferroni corrected, 13 tests) and Dunn’s post hoc test. (B) Percentage positive cells falling into a quadrant gate set on PD‐1 and TIGIT, bars represent mean ± SD. Statistical testing performed only on percentage of double‐positive cells. *P < 0.05, **P < 0.01, ***P < 0.0001 in Kruskal–Wallis test and Dunn`s post hoc test. (C‐F) A viSNE analysis was performed with activation markers (TIGIT, PD‐1, HLA‐DR, CD38, CD45RA, CD45RO) on Tregs from all samples with more than 100 Tregs, including PBMC control samples. A gate was set on the cells positive for all the activation markers, termed activated Tregs. Marker intensity for all events concatenated (C), and density maps of each sample type concatenated (D), percentage of activated Tregs against percentage of tumor cells and linear regression by Spearman (E). Percentage of activated Tregs in SNneg (non‐metastatic sentinel node), SNmet (metastatic sentinel node), and ALNmet (metastatic axillary lymph nodes) from breast cancer patients and PBMC from healthy controls. Lines represent median 96% CL. **P < 0.01, ***P < 0.0001 in Kruskal–Wallis test and Dunn`s post hoc test (F).
Fig. 4
Fig. 4
TIGIT+ T cells are dysfunctional. (A, B) TCR signaling was activated using anti‐CD3 and anti‐CD28 biotinylated antibodies, followed by avidin crosslinking in 3 SNneg (non‐metastatic sentinel node) and 3 metastatic lymph nodes (1 SNmet (metastatic sentinel node), 2 ALNmet (metastatic axillary lymph node)). Signaling was measured by phosphoflow cytometry and showed reduced p‐ERK signaling in TIGIT+ cells compared with TIGIT‐ cells. (A) Signaling in CD8+ T cells from two out of six representative samples. (B) TCR‐induced signaling in CD4 and CD8 T cells relative to unstimulated cells, shown as arcsinh median, n = 3 metastatic lymph nodes and n = 3 non‐metastatic lymph nodes. *P < 0.05, **P < 0.01 in paired t‐test. (C) Flow cytometry analysis of the same six samples confirmed higher TIGIT expression in T cells from metastatic samples by paired t‐test, nonsignificant. Bars represent median values. (D) The samples were also stained for TIGIT ligands CD155 and CD112. Cytograms display all live singlets of the six samples. Tumor cells and macrophages/monocytes (identified by CD4+CD3‐; Fig. S5A) expressed CD155 and CD112 in both non‐metastatic and metastatic lymph nodes, but increased presence of ligand+ cells in metastatic samples.
Fig. 5
Fig. 5
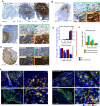
The topological distribution of CD4‐ and CD8‐positive cells in lymph nodes with no, small, intermediate, and large metastatic tumor burden. (A–D) One SNneg (non‐metastatic sentinel node) (patient 11) and three SNmets (metastatic sentinel nodes) (patients 37,39, and 27) were IHC stained with AE1/AE3, CD4, and CD8. Magnified area of extratumoral (orange) and intratumoral (green) regions stained with CD8 and CD4 of lymph nodes with small (B), intermediate (C), and large (D) tumor burden. Scales and magnifications are shown in images. (E, F) A scoring system, ImmunoPath (with field fraction function measuring positive and negative pixels was used to calculate the percentage positive areas) was used to objectively score IHC‐positive areas. (E) Histograms comparing tumor cell percentage and CD4/CD8 ratio measured by IHC (left axis) and mass cytometry (right axis) performed on cells from the same lymph nodes. (F) Comparison of CD4/CD8 ratio in intratumoral and extratumoral areas of the metastatic lymph node analyzed separately by ImmunoPath. (G) Immunofluorescence staining with CD8 (green) and Treg (FoxP3, red) and counterstained with DAPI on non‐metastatic sentinel node and metastatic sentinel nodes (same samples as A‐D) Scales and magnifications are shown in images.

References

    1. Bray F, Ferlay J, Soerjomataram I, Siegel RL, Torre LA & Jemal A (2018) Global cancer statistics 2018: GLOBOCAN estimates of incidence and mortality worldwide for 36 cancers in 185 countries. CA Cancer J Clin 68, 394–424. - PubMed
    1. Hu Z, Fan C, Oh DS, Marron JS, He X, Qaqish BF et al. (2006) The molecular portraits of breast tumors are conserved across microarray platforms. BMC Genom 7, 96. - PMC - PubMed
    1. Curtis C, Shah SP, Chin SF, Turashvili G, Rueda OM, Dunning MJ, Speed D, Lynch AG, Samarajiwa S, Yuan Y et al. (2012) The genomic and transcriptomic architecture of 2,000 breast tumours reveals novel subgroups. Nature 486, 346–352. - PMC - PubMed
    1. Loi S, Michiels S, Salgado R, Sirtaine N, Jose V, Fumagalli D, Kellokumpu‐Lehtinen PL, Bono P, Kataja V, Desmedt C et al. (2014) Tumor infiltrating lymphocytes are prognostic in triple negative breast cancer and predictive for trastuzumab benefit in early breast cancer: results from the FinHER trial. Ann Oncol 25, 1544–1550. - PubMed
    1. Luen S, Virassamy B, Savas P, Salgado R & Loi S (2016) The genomic landscape of breast cancer and its interaction with host immunity. Breast 29, 241–250. - PubMed

Publication types