. 2021 Aug 9;6(15):e148588.
doi: 10.1172/jci.insight.148588.

A variant of ASIC2 mediates sodium retention in nephrotic syndrome

Affiliations

A variant of ASIC2 mediates sodium retention in nephrotic syndrome

Marc Fila et al. JCI Insight. .

Abstract

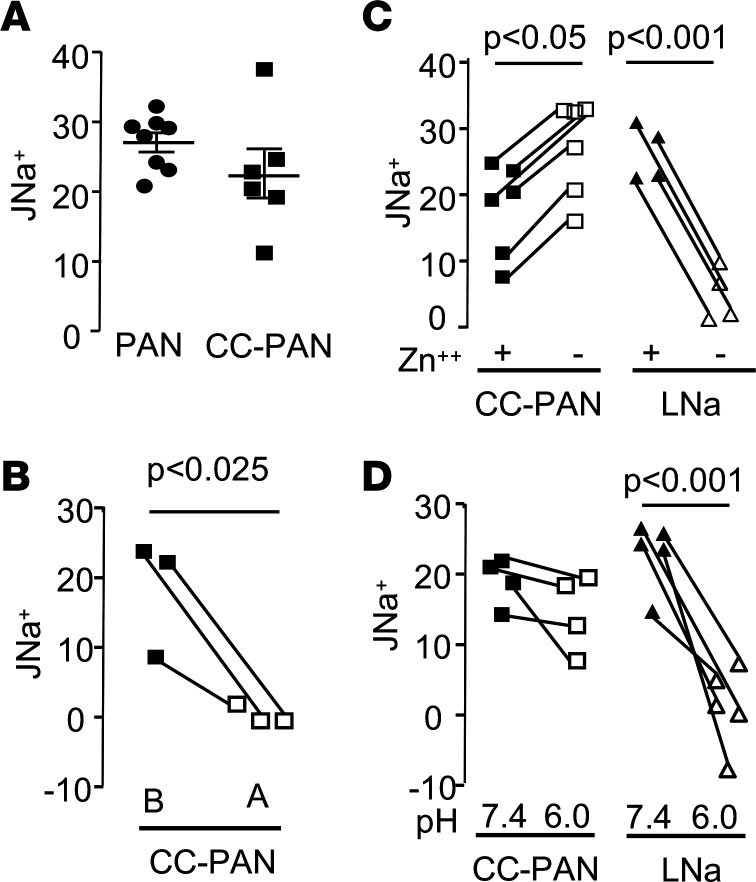
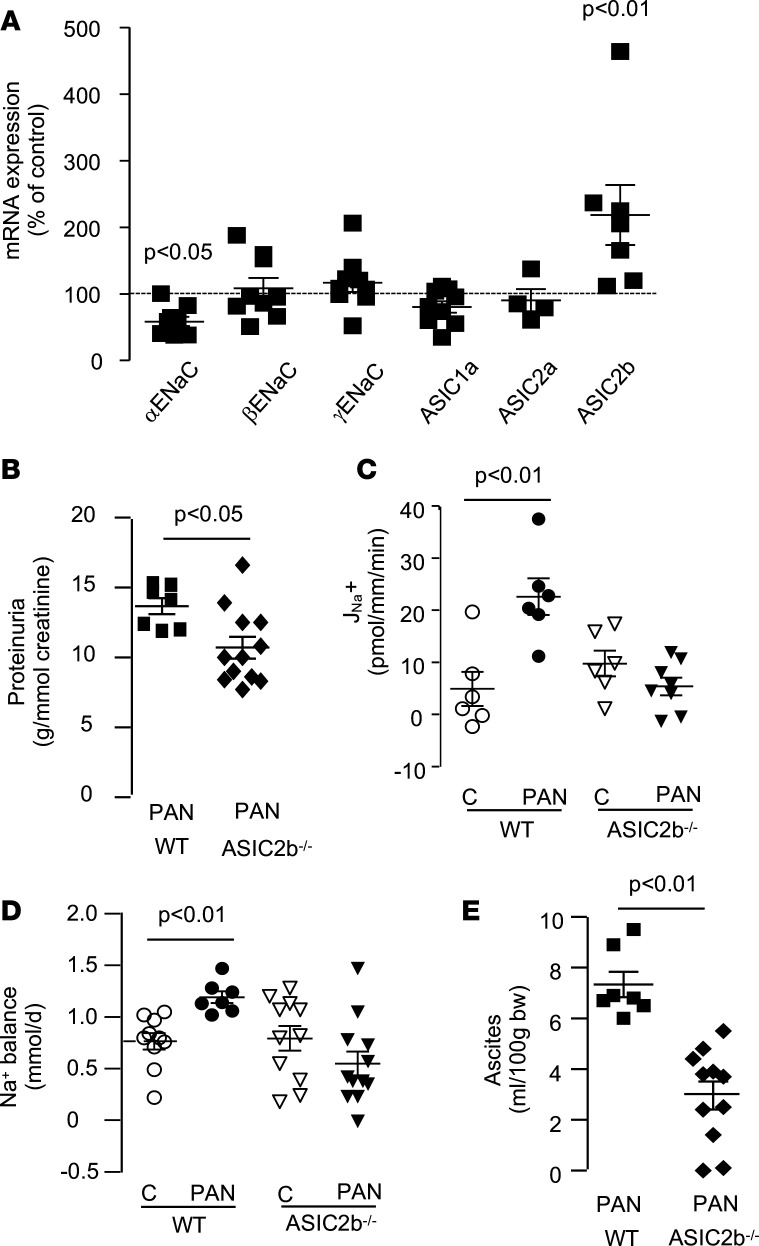
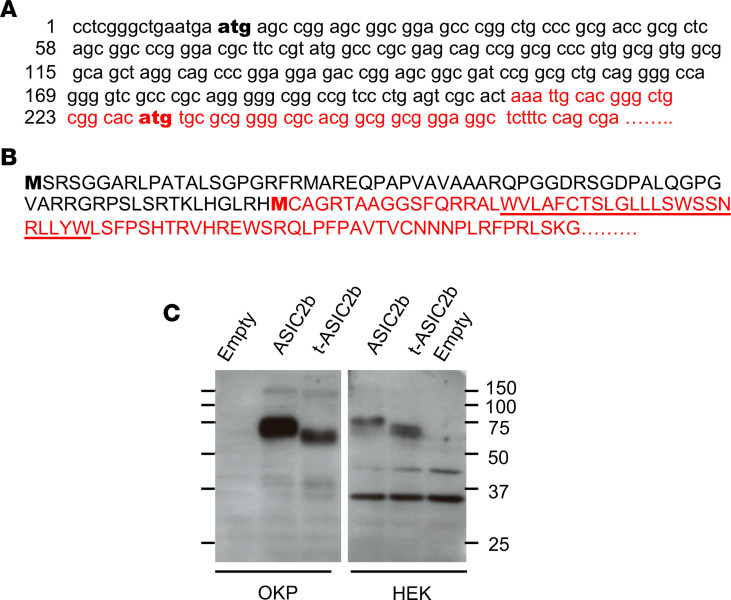
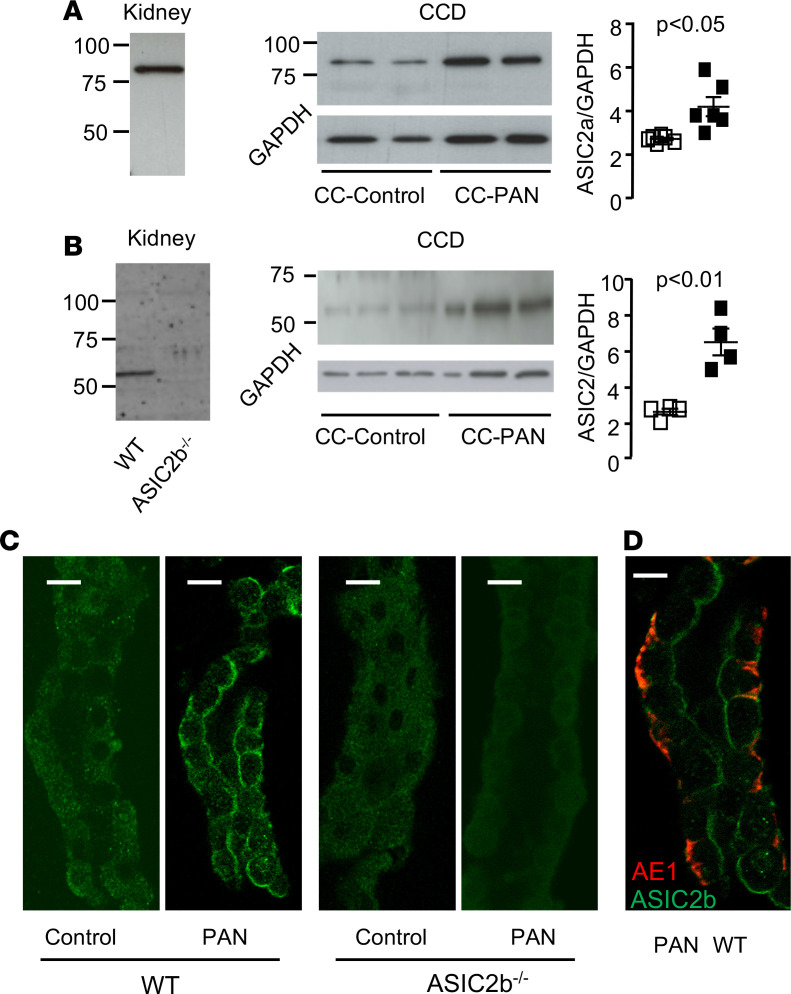
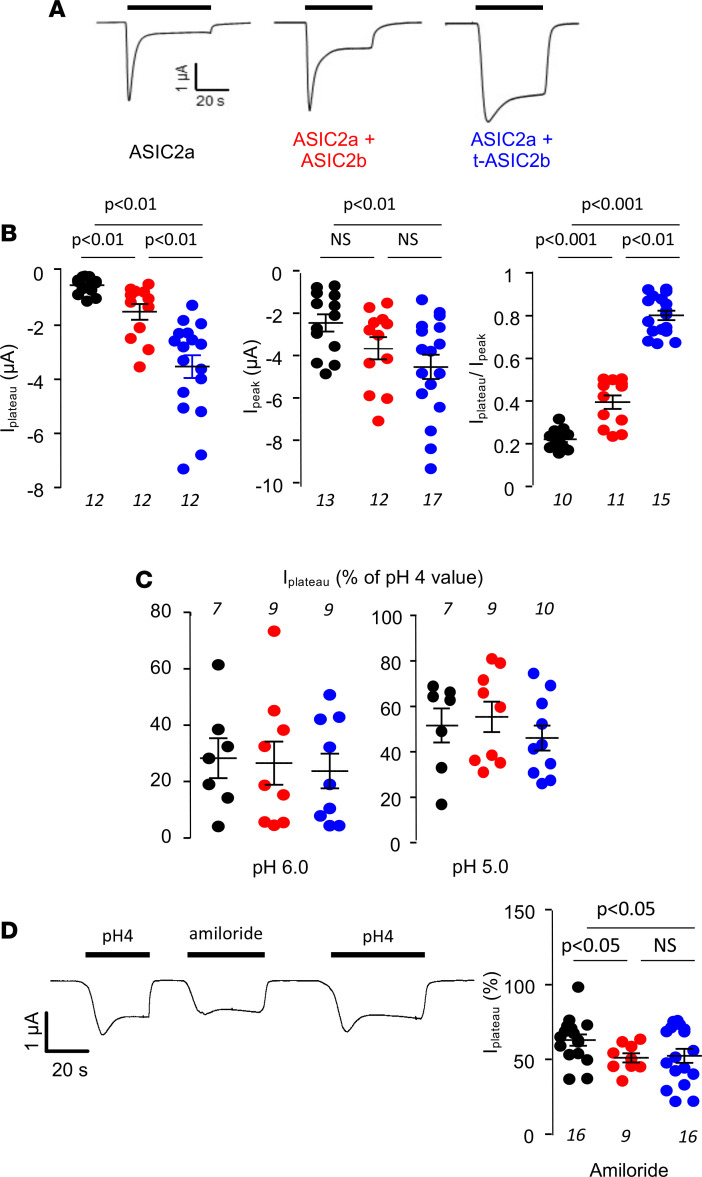
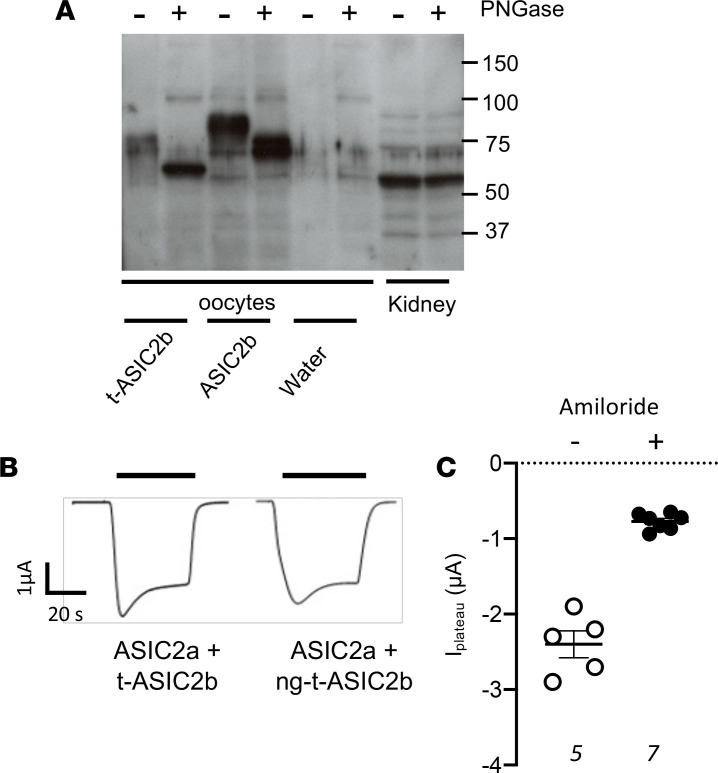
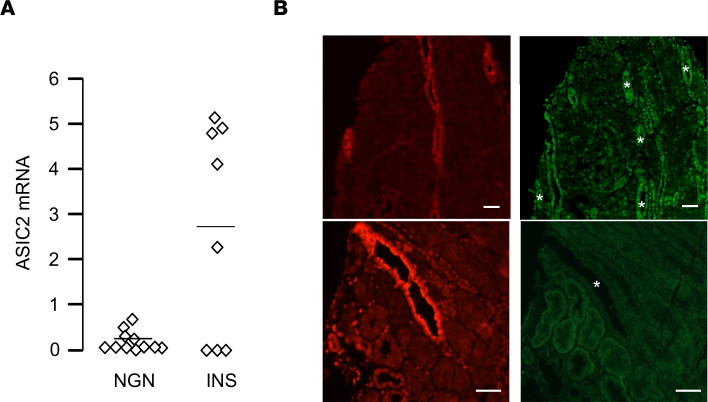
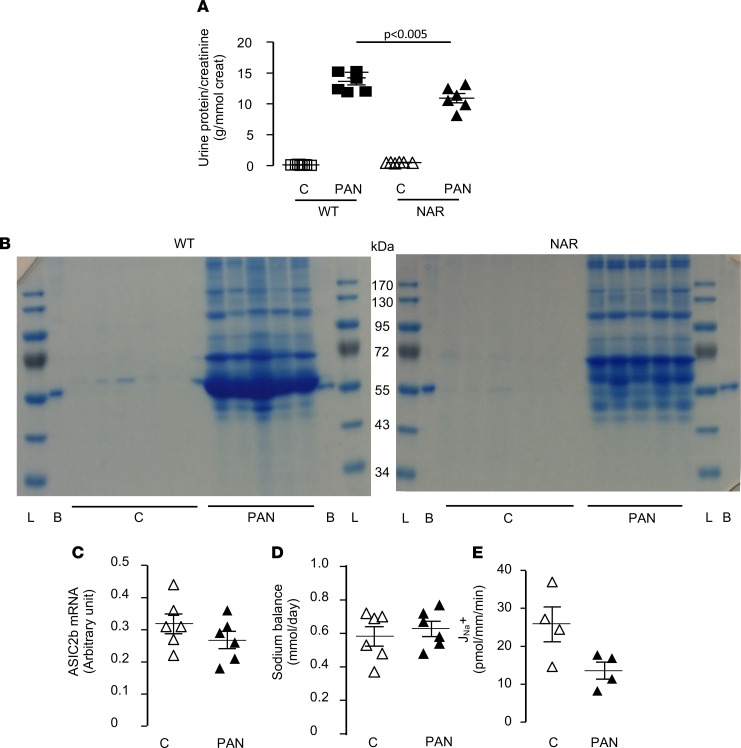
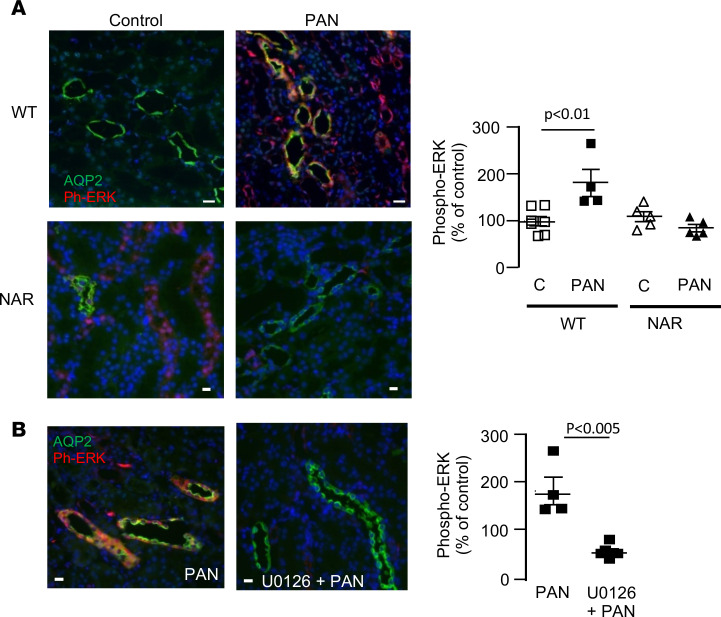
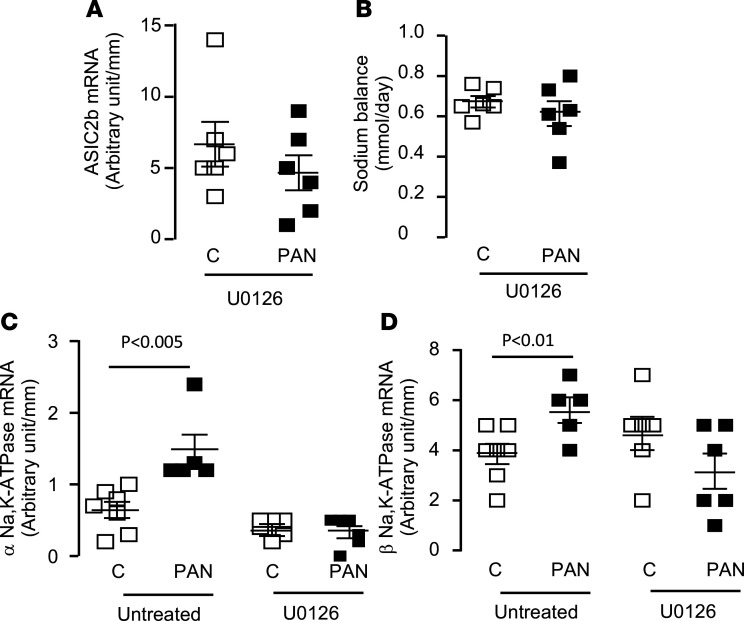
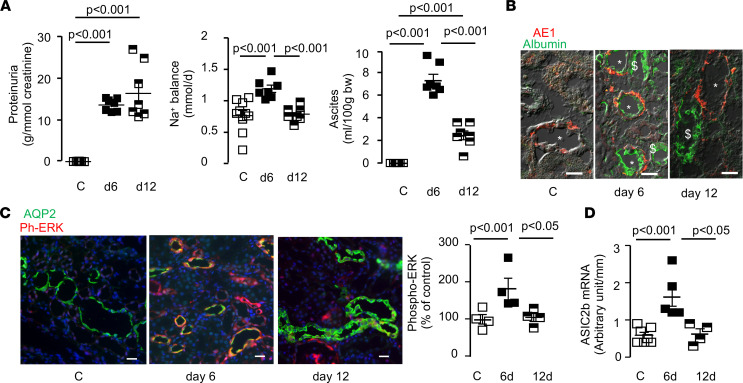
Idiopathic nephrotic syndrome (INS) is characterized by proteinuria and renal sodium retention leading to edema. This sodium retention is usually attributed to epithelial sodium channel (ENaC) activation after plasma aldosterone increase. However, most nephrotic patients show normal aldosterone levels. Using a corticosteroid-clamped (CC) rat model of INS (CC-PAN), we showed that the observed electrogenic and amiloride-sensitive Na retention could not be attributed to ENaC. We then identified a truncated variant of acid-sensing ion channel 2b (ASIC2b) that induced sustained acid-stimulated sodium currents when coexpressed with ASIC2a. Interestingly, CC-PAN nephrotic ASIC2b-null rats did not develop sodium retention. We finally showed that the expression of the truncated ASIC2b in the kidney was dependent on the presence of albumin in the tubule lumen and activation of ERK in renal cells. Finally, the presence of ASIC2 mRNA was also detected in kidney biopsies from patients with INS but not in any of the patients with other renal diseases. We have therefore identified a variant of ASIC2b responsible for the renal Na retention in the pathological context of INS.

Keywords: Homeostasis; Ion channels; Nephrology; Sodium channels.


Conflict of interest statement

Conflict of interest: The authors have declared that no conflict of interest exists.

Figures

Figure 1
Figure 1. Sodium flux (JNa+) measured in microperfused CCDs in vitro.
(A) JNa+ in CCDs from PAN nephrotic and CC-PAN nephrotic rats (PAN n = 8 and CC-PAN n = 6). Data are shown as mean ± SEM (each value represents a rat). (B) JNa+ was measured in CCDs from CC-PAN nephrotic rats before (B) and after (A) luminal addition of 10 μM amiloride. Each value represents a tubule (n = 3). (C) JNa+ in CCDs from CC-PAN rats and rats fed a LNa diet for 14 days before and after luminal addition of 300 μM ZnCl2. Each value represents a tubule (n = 6 and n = 4 in CC-PAN and LNa condition, respectively). (D) JNa+ in CCDs from CC-PAN and LNa rats was measured before and after acidification of the luminal fluid at pH 6.0. Each value represents a tubule (n = 4 and n = 5 in CC-PAN and LNa condition, respectively). Comparison between groups was performed by either 2-tailed unpaired t test (A) or paired t test (BD). P < 0.05. CCDs, cortical-collecting ducts; CC, corticosteroid-clamped; LNa, sodium-depleted.
Figure 2
Figure 2. Role of ASIC2b in sodium retention in CC-PAN rats.
(A) RT-qPCR analysis of ENaC/degenerin mRNA in CCDs from CC-PAN rats. Data are expressed as percent of values in CC control rats. Data are shown as mean ± SEM (each value represents a rat). (B) Proteinura in WT (n = 7) and ASIC2b–/– CC-PAN (n = 13) rats. Proteinuria is expressed as a function of creatinine excretion. Data are shown as mean ± SEM (each value represents a rat). (C) JNa+ in CCDs from WT and ASIC2b–/– rats under basal (C) or nephrotic (PAN) conditions. Data are shown as mean ± SEM (each value represents a rat, n = 6–7). (D) Urinary sodium balance in WT and ASIC2b–/– rats under basal (C) or nephrotic (PAN) conditions. Data are shown as mean ± SEM (each value represents a rat, n = 7–12). (E) Volume of ascites, as a function of body weight, in WT (n = 7) and ASIC2b–/– CC-PAN (n = 11) rats. Data are shown as mean ± SEM. Comparison between groups was performed by variance analysis (1-way ANOVA) followed by post hoc multiple comparison Tukey’s test (A) or by 2-tailed unpaired t test (BE). P < 0.05. ASIC2b, acid-sensing ion channel 2b; CCDs, cortical-collecting ducts; CC, corticosteroid-clamped; ENaC, epithelial sodium channel.
Figure 3
Figure 3. Long and truncated variants of ASIC2b.
(A) 5′ terminal sequence of rat Asic2b cDNA (Accn1, transcript variant MDEG2, NM_012892, black) and of the short cDNA cloned from CC-PAN CCD (red, GenBank KP294334). The short sequence contains a putative translation initiation codon in frame with the ASIC2 ATG (in bold). (B) N-ter sequence of rat ASIC2b (black) and its putative truncated variant (red). The underlined sequence shows the first transmembrane domain. (C) Western blot analysis of ASIC2 expression in OKP and HEK cells transiently transfected with Asic2b or its truncated variant (t-Asic2b) or an empty vector. ASIC2b, acid-sensing ion channel 2b; CCDs, cortical-collecting ducts; CC, corticosteroid-clamped.
Figure 4
Figure 4. Renal expression of ASIC2.
(A and B) Western blot analysis of ASIC2 expression in kidney of WT and ASIC2b–/– CC-PAN rats and in CCDs of CC-Control and CC-PAN rats using a specific ASIC2a antibody (A) or a pan-ASIC2 antibody (B). Left, representative blot; right, densitometric analysis. Each value represents a rat. (C) Immunolabeling of isolated CCD from WT and ASIC2b–/– CC-Control and CC-PAN rats with a pan-ASIC2 antibody. Scale bar: 10 μm. (D) Immunolabelling of isolated CCD from PAN WT rat with a pan-ASIC2 antibody (green) and an anti-AE1 antibody (red). Comparison between groups was performed by 2-tailed unpaired t test. P < 0.05. ASIC2, acid-sensing ion channel; CCDs, cortical-collecting ducts; CC, corticosteroid-clamped.
Figure 5
Figure 5. Functional expression of ASIC2 in X. laevis oocyte.
(A) ASIC2b coexpression attenuates ASIC2a desensitization. Original traces of whole-cell current (holding potential = –70 mV) in oocytes expressing ASIC2a alone or with ASIC2b, or t-ASIC2b, as indicated below the traces. Inward currents were induced by a rapid extracellular acidification from pH 7.4 to pH 4.0 (indicated by the horizontal bar). (B) Mean transient-induced (peak) and residual-induced (plateau) currents (corrected by currents recorded in control oocytes) in oocytes expressing ASIC2a alone (black bars) or coexpressing ASIC2b (red) or t-ASIC2b (blue). (C) Acid-induced plateau currents (normalized to maximal value achieved at pH 4) at different extracellular pH; colors as above. (D) Effect of amiloride: acid-induced (pH 4) plateau currents (normalized to the value measured in the absence of inhibitor) in the presence of 100 μM amiloride. Data are shown as mean ± SEM (each value represents an oocyte, n is shown in italic in each figure). Comparison between groups was performed by variance analysis (1-way ANOVA) followed by post hoc multiple comparison Tukey’s test. P < 0.05. ASIC2, acid-sensing ion channel; t-ASIC2b, truncated variant of ASIC2b.
Figure 6
Figure 6. Glycosylation of t-ASIC2b.
(A) Western blot analysis of ASIC2 expression in X. laevis oocytes injected with ASIC2b or t-ASIC2b cRNA or water and in protein extracts from CC-PAN rat kidneys. Samples were treated or not with N-glycosidase F (PNGase). (B) Original traces of whole-cell current (holding potential = –70 mV) in oocytes expressing ASIC2a with t-ASIC2b or a nonglycosylable form of truncated ASIC2b (ng-t-ASIC2b). Inward currents were induced by a rapid extracellular acidification from pH 7.4 to pH 4.0 (indicated by the horizontal bar). (C) Acid-induced (pH 4) plateau currents in the absence or presence of 100 μM amiloride. Data are shown as mean ± SEM (each value represents an oocyte, n is shown in italic in the figure). Comparison between groups was performed by 2-tailed unpaired t test. P < 0.05. t-ASIC2b, truncated variant of ASIC2b; ASIC2b, acid-sensing ion channel 2b; t-ASIC2b, truncated variant of ASIC2b; CC, corticosteroid-clamped.
Figure 7
Figure 7. Expression of ASIC2 in nephrotic patients.
(A) RT-qPCR analysis of ASIC2 mRNA in kidney biopsies from patients with NGN (n = 11) or INS (n = 8). Given the heterogeneity of biopsies in term of cell composition, data were standardized using distal nephron markers, as previously described (38). Data are in arbitrary units. (B) Immunolabeling of kidney serial sections with anti-AQP2 (red) and anti-ASIC2 antibody (b and d, green) from a patient with INS (upper panels) or a nonnephrotic patient (lower panels). Scale bar: 100 μm. Comparison between groups was performed by 2-tailed unpaired t test. P < 0.05. ASIC2, acid-sensing ion channel; NGN, nonglomerular nephropathies; INS, idiopathic nephrotic syndrome.
Figure 8
Figure 8. Role of albumin in ASIC2b expression and sodium retention.
(A) PAN-induced proteinuria in CC-WT rats (n = 6) and NARs (n = 6). Proteinuria is expressed as a function of creatinine excretion. Data are shown as mean ± SEM. (B) Urinary proteinogram in WT rats and NAR under control (C) and nephrotic conditions (PAN). L, molecular weight markers; (B), BSA. (C) Expression of Asic2b mRNA in control (n = 6) and PAN nephrotic (n = 6) CC-NARs. Data are shown as mean ± SEM. (D) Sodium balance in control (n = 6) and PAN nephrotic (n = 6) CC-NARs. Data are shown as mean ± SEM. (E) JNa+ in CCDs from control (n = 4) and PAN nephrotic (n = 4) CC-NARs. Data are shown as mean ± SEM. Comparison between groups was performed by variance analysis (1-way ANOVA) followed by post hoc multiple comparison Tukey’s test (A) or by 2-tailed unpaired t test (CE). P < 0.05. ASIC2b, acid-sensing ion channel 2b; CC, corticosteroid-clamped; NARs, Nagase analbuminemic rats; CCDs, cortical-collecting ducts.
Figure 9
Figure 9. ERK pathway is triggered by luminal albumin.
(A) Immunolabeling of kidney cortical sections from CC-WT rats and CC-NARs under control and PAN nephrotic condition with anti-phospho-ERK (red) and AQP2 (in green). AQP2 was used as a marker of CCDs. Left side shows representative images of phosphorylation of ERK in nephrotic WT rats but not in NARs. Right side shows the quantification of phospho-ERK labeling in CCDs. Values were normalized to the labeling measured in each experiment in the same CC control WT rat. Data are shown as mean ± SEM (n = 4–8). (B) Same immunolabeling as in A in CC-PAN WT rats treated or not with the ERK kinase inhibitor U0126. Data are shown as mean ± SEM (n = 4–6). Comparison between groups was performed by variance analysis (1-way ANOVA) followed by post hoc multiple comparison Tukey’s test (A) or by 2-tailed unpaired t test (B). P < 0.05. CCDs, cortical-collecting ducts; CC, corticosteroid-clamped.
Figure 10
Figure 10. Role of ERK pathway in ASIC2b expression and sodium retention.
(A) Expression of Asic2b mRNA in U016-treated rats under control (n = 6) and nephrotic conditions (n = 6). Data are shown as mean ± SEM. (B) Sodium balance in U016-treated rats under control (n = 6) and nephrotic conditions (n = 6). Data are shown as mean ± SEM. (C and D) Expression of mRNAs of the α and β subunits of Na,K-ATPase in U0126-untreated and U0126-treated rats under control and nephrotic conditions. Data are shown as mean ± SEM (n = 5–8). Comparison between groups was performed by 2-tailed unpaired t test. P < 0.05. ASIC2b, acid-sensing ion channel 2b.
Figure 11
Figure 11. Reversal of sodium retention.
(A) Proteinuria, sodium balance and volume of ascites in CC rats under control condition (C) or 6 or 12 days after PAN administration. Data are shown as mean ± SEM (n = 7–11). (B) Immunolabeling of kidney cortex section from CC rats under control condition (C) or 6 or 12 days after PAN administration with an anti-albumin antibody (green) and AE1 antibody (red), a specific marker of CCD intercalated cells. *, CCD; $, proximal tubule. Scale bar: 25 μm. (C) Immunolabeling of kidney cortex section from CC rats under control condition (C) or 6 or 12 days after PAN administration with an anti-phospho-ERK antibody (red) and an anti-AQP2 antibody (green), a specific marker of CCD principal cells. Left, representative images; right, quantification as in Figure 8A. Data are shown as mean ± SEM (n = 4). (D) Expression of Asic2b mRNA in CCDs from CC rats under control condition (C) or 6 or 12 days after PAN administration. Data are shown as mean ± SEM (n = 4–7). Comparison between groups was performed by variance analysis (1-way ANOVA) followed by post hoc multiple comparison Tukey’s test. P < 0.05. CC, corticosteroid-clamped; CCDs, cortical-collecting ducts.

Similar articles

Cited by

References

    1. Doucet A, et al. Molecular mechanism of edema formation in nephrotic syndrome: therapeutic implications. Pediatr Nephrol. 2007;22(12):1983–1990. doi: 10.1007/s00467-007-0521-3. - DOI - PMC - PubMed
    1. Frenk S, et al. Experimental nephrotic syndrome induced in rats by aminonucleoside; renal lesions and body electrolyte composition. Proc Soc Exp Biol Med. 1955;89(3):424–427. - PubMed
    1. Pedraza-Chaverri J, et al. Pathophysiology of experimental nephrotic syndrome induced by puromicyn aminonucleoside in rats. III. Effect of captopril, an angiotensin converting enzyme inhibitor, on proteinuria and sodium retention. Rev Invest Clin. 1990;42(3):210–216. - PubMed
    1. Deschenes G, et al. Collecting duct is a site of sodium retention in PAN nephrosis: a rationale for amiloride therapy. J Am Soc Nephrol. 2001;12(3):598–601. doi: 10.1681/ASN.V123598. - DOI - PubMed
    1. Ichikawa I, et al. Role for intrarenal mechanisms in the impaired salt excretion of experimental nephrotic syndrome. J Clin Invest. 1983;71(1):91–103. doi: 10.1172/JCI110756. - DOI - PMC - PubMed

Publication types