. 2021 Jun 24;17(6):e1009069.
doi: 10.1371/journal.pcbi.1009069. eCollection 2021 Jun.

PHENSIM: Phenotype Simulator

Affiliations

PHENSIM: Phenotype Simulator

Salvatore Alaimo et al. PLoS Comput Biol. .

Abstract

Despite the unprecedented growth in our understanding of cell biology, it still remains challenging to connect it to experimental data obtained with cells and tissues' physiopathological status under precise circumstances. This knowledge gap often results in difficulties in designing validation experiments, which are usually labor-intensive, expensive to perform, and hard to interpret. Here we propose PHENSIM, a computational tool using a systems biology approach to simulate how cell phenotypes are affected by the activation/inhibition of one or multiple biomolecules, and it does so by exploiting signaling pathways. Our tool's applications include predicting the outcome of drug administration, knockdown experiments, gene transduction, and exposure to exosomal cargo. Importantly, PHENSIM enables the user to make inferences on well-defined cell lines and includes pathway maps from three different model organisms. To assess our approach's reliability, we built a benchmark from transcriptomics data gathered from NCBI GEO and performed four case studies on known biological experiments. Our results show high prediction accuracy, thus highlighting the capabilities of this methodology. PHENSIM standalone Java application is available at https://github.com/alaimos/phensim, along with all data and source codes for benchmarking. A web-based user interface is accessible at https://phensim.tech/.


Conflict of interest statement

The authors have declared that no competing interests exist.

Figures

Fig 1
Fig 1. Comparison between PHENSIM and BioNSi for datasets where the altered gene was in the meta-pathway.
Each graph reports one metric: Positive Predictive Value (PPV), Sensitivity and Specificity for genes showing altered expression, and PPV and False Negative Rate (FNR) for the non-altered ones. On the x-axis, we report PHENSIM performance, while on the y-axis, we present BioNSi. Each dot represents a dataset. The black line marks the points where the two algorithms have the same performance. On a dataset below the line, PHENSIM has better performance than BioNSi; above the line, it is the opposite.
Fig 2
Fig 2. Comparison between PHENSIM and BioNSi for datasets where the altered gene was not in the meta-pathway.
Each graph reports one metric: Positive Predictive Value (PPV), Sensitivity and Specificity for genes showing altered expression, and PPV and False Negative Rate (FNR) for the non-altered ones. On the x-axis, we report the PHENSIM performance, while on the y-axis, we have BioNSi. Each dot represents a dataset. The black line marks the points where the two algorithms have the same performance. On a dataset below the line, PHENSIM has better performance than BioNSi; above the line, it is the opposite.
Fig 3
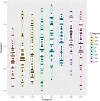
Fig 3. Comparison between PHENSIM predictions and the proteomics measurements of Nyman et al. [18].
We report the Pearson Correlation Coefficient computed between PHENSIM and the proteomics measurements for each timepoint and drug combination. Results are summarized through a violin plot detailing both the distribution and the values’ density.
Fig 4
Fig 4. The current model of metformin-mediated pharmacological effects.
Black solid edges represent direct interaction between first neighbor nodes. Dashed edges represent indirect interactions between nodes. Red dot-dashed edges evidence scientifically validated interactions considered for PHENSIM prediction.
Fig 5
Fig 5. Generalized model showing molecular mechanisms underlying the TNFα/siTPL2-dependent synthetic lethality.
Black solid edges represent direct interaction between first neighbor nodes. Dashed edges represent indirect interactions between nodes. Red dot-dashed edges evidence scientifically validated interactions considered for PHENSIM prediction.
Fig 6
Fig 6. Description of the PHENSIM algorithm.
First, the user provides a set of genes and the type of alteration (over-/under-expression). Then, synthetic LogFCs are generated, and a simulation step is performed. This procedure is repeated 1000 times to compute the Activity Scores. Next, user input is randomized, and 100 synthetic LogFC are generated to estimate Activity Scores using the simulation step. This input randomization is repeated 1000 times for greater precision. Finally, p-values are computed, and the False Discovery Rate is estimated using the q-value methodology.

References

    1. Ramanan VK, Shen L, Moore JH, Saykin AJ. Pathway analysis of genomic data: concepts, methods, and prospects for future development. Trends Genet. 2012;28(7):323–32. Epub 2012/04/07. doi: 10.1016/j.tig.2012.03.004 . - DOI - PMC - PubMed
    1. Wang RS, Maron BA, Loscalzo J. Systems medicine: evolution of systems biology from bench to bedside. Wiley Interdisciplinary Reviews: Systems Biology and Medicine. 2015;7(4):141–61. doi: 10.1002/wsbm.1297 - DOI - PMC - PubMed
    1. Kirchmair J, Goller AH, Lang D, Kunze J, Testa B, Wilson ID, et al.. Predicting drug metabolism: experiment and/or computation? Nat Rev Drug Discov. 2015;14(6):387–404. Epub 2015/04/25. doi: 10.1038/nrd4581 . - DOI - PubMed
    1. Karlebach G, Shamir R. Modelling and analysis of gene regulatory networks. Nature Reviews Molecular Cell Biology. 2008;9(10):770–80. doi: 10.1038/nrm2503 - DOI - PubMed
    1. Cohen DP, Martignetti L, Robine S, Barillot E, Zinovyev A, Calzone L. Mathematical modelling of molecular pathways enabling tumour cell invasion and migration. PLoS Comput Biol. 2015;11(11):e1004571. doi: 10.1371/journal.pcbi.1004571 - DOI - PMC - PubMed

Publication types

MeSH terms