

HMGB1 coordinates SASP-related chromatin folding and RNA homeostasis on the path to senescence
- PMID: 34166567
- PMCID: PMC8224457
- DOI: 10.15252/msb.20209760
HMGB1 coordinates SASP-related chromatin folding and RNA homeostasis on the path to senescence
Abstract
Spatial organization and gene expression of mammalian chromosomes are maintained and regulated in conjunction with cell cycle progression. This is perturbed once cells enter senescence and the highly abundant HMGB1 protein is depleted from nuclei to act as an extracellular proinflammatory stimulus. Despite its physiological importance, we know little about the positioning of HMGB1 on chromatin and its nuclear roles. To address this, we mapped HMGB1 binding genome-wide in two primary cell lines. We integrated ChIP-seq and Hi-C with graph theory to uncover clustering of HMGB1-marked topological domains that harbor genes involved in paracrine senescence. Using simplified Cross-Linking and Immuno-Precipitation and functional tests, we show that HMGB1 is also a bona fide RNA-binding protein (RBP) binding hundreds of mRNAs. It presents an interactome rich in RBPs implicated in senescence regulation. The mRNAs of many of these RBPs are directly bound by HMGB1 and regulate availability of SASP-relevant transcripts. Our findings reveal a broader than hitherto assumed role for HMGB1 in coordinating chromatin folding and RNA homeostasis as part of a regulatory loop controlling cell-autonomous and paracrine senescence.
Keywords: 3D chromatin folding; RNA splicing; loop; replicative senescence; senescence-associated secretory phenotype.
© 2021 The Authors. Published under the terms of the CC BY 4.0 license.
Conflict of interest statement
The authors declare that they have no conflict of interest.
Figures

Proliferating and senescent IMR90 and HUVECs assayed for β‐galactosidase activity (left), cell cycle profiling via FACS (middle), and proliferation via MTT assays (right).
Heatmaps showing changes in gene expression levels upon senescence (log2FC) of genes encoding selected chromatin‐associated factors. For each gene shown, statistically significant expression changes were recorded in at least one cell type.
Western blots showing changing protein levels on the path to senescence in IMR90 and HUVECs. Passage 6 cells represent the proliferating state, and passages 21 and 34 the senescent state for HUVECs and IMR90, respectively.
Super‐resolution (gSTED) imaging of HMGB1 distribution in proliferating HUVEC nuclei counterstained with DAPI. Bar: 2 μm.
Representative immunofluorescence images of IMR90 and HUVECs (left) showing reduced HMGB1 levels in senescent nuclei; bean plots quantify this reduction (right; N is the number of cells analyzed per each condition/cell type). Bars: 5 μm. *P < 0.01; Wilcoxon–Mann–Whitney test.
Scatter plots showing correlation between RNA‐seq (transcription) and Ribo‐seq (translation; log2) in proliferating and senescent IMR90. Pearson’s correlation values (ρ) and the number of genes in each plot (N) are also shown.
As in panel F, but correlating RNA‐seq and whole‐cell proteome changes.
Heatmap showing GO terms/pathways associated with the gene subgroups from panel G (color‐coded the same way). The number of genes in each subgroup (N) is indicated.

Genome browser view of HMGB1 ChIP‐seq (normalized to input; mean from two replicates) from proliferating HUVEC (red) or proliferating/senescent IMR90 (gray/green) in the TMEM92 locus.
Bar graphs showing the genomic distribution of HMGB1 ChIP‐seq peaks in HUVEC and IMR90. The number of peaks (N) analyzed per each cell type is indicated.
Venn diagram showing HMGB1 ChIP‐seq peaks shared between proliferating HUVEC (red) or proliferating/senescent IMR90 (gray/green) data. *P < 0.001; more than expected by chance, hypergeometric test.
Exemplary Hi‐C heatmap for a subregion of IMR90 chr6 aligned to HMGB1 ChIP‐seq; peaks at TAD boundaries (orange lines) are indicated (red arrowheads).
Line plots showing normalized HMGB1 (red) and RAD21 ChIP‐seq signal (dark gray) along TADs ±20 kbp from proliferating IMR90.
Line plots showing normalized HMGB1 (red) and CTCF ChIP‐seq signal (dark gray) in the 160 kbp around HMGB1‐ (left) or CTCF‐marked TAD boundaries (right).
Line plots showing mean normalized insulation scores calculated from proliferating (black) and senescent IMR90 Hi‐C data (blue) in the 240 kbp around HMGB1 peaks residing at TAD boundaries (top) or not (bottom).
Aggregate plots showing 20 kbp resolution Hi‐C signal for proliferating (top), senescent‐specific (bottom), or shared loops (middle). The number of loops in each category (N) is indicated.
Line plots showing normalized HMGB1 (red) and RAD21 ChIP‐seq signal (gray) along proliferating (top) or shared loop domains (bottom) ±50 kbp from proliferating IMR90. The percentage of HMGB1 peaks residing at loop anchors is indicated.
Box plot (left) showing significantly up/downregulated IMR90 genes harbored inside the 607 loops from panel H. The number of genes in each group (N) is indicated; center lines represent medians, box limits indicate the 25th and 75th percentile, whiskers extend 1.5 times the 25th–75th interquartile range, and outliers are represented by dots. Bar plots (right) show Go terms associated with these up/downregulated genes.
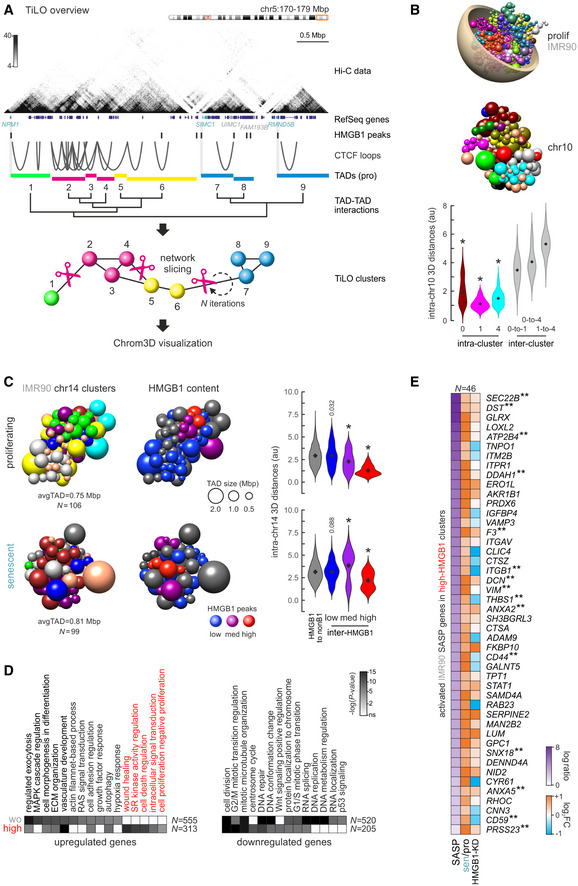
Overview of TiLO using a subregion of HUVEC chr5 as an example. TADs along each chromosome are treated as nodes in an interaction network, and inter‐TAD Hi‐C signal is used to infer network connections. Inferred connections are then sliced, and network robustness is assessed iteratively to obtain the final clustering. TAD clusters are visualized in the space of the nucleus using Chrom3D.
Chrom3D visualization of the whole genome (top) and of TAD clustering in chr10 from proliferating IMR90 (middle); each sphere represents one TAD. Violin plots (bottom) show 3D distances among TADs in three randomly selected clusters (0, 1, and 4) or between TADs from different clusters. *: significantly different to inter‐cluster distances, Wilcoxon–Mann–Whitney test.
Chrom3D visualization of TAD clustering in chr14 from proliferating (top) and senescent IMR90 (bottom). TADs (spheres) are colored by the cluster they belong to (left) or according to their HMGB1 ChIP‐seq content (middle; gray – zero peaks, blue – 1 or 2 peaks, purple – 3 or 4 peaks, red – 5 or more peaks). Violin plots (right) show 3D distances among TADs in each subgroup or between HMGB1‐containing and non‐containing TADs. *: significantly different to inter‐cluster distances, Wilcoxon–Mann–Whitney test.
Heatmaps showing GO terms associated with differentially expressed genes in two TAD groups from panel C; SASP‐related GO terms are highlighted. The number of genes (N) behind each heatmap are indicated.
Heatmap showing protein (SASP, from
http://www.saspatlas.com/ ; log fold ratio) and gene expression levels (log2FC) of IMR90 SASP‐related genes embedded in high‐HMGB1 (red) TADs like those in panel C. **: genes bound by HMGB1 in ChIP‐seq data are more than expected by chance; P > 0.001, hypergeometric test.

Immunofluorescence (top), Western blot (middle), and RT–qPCR analyses (bottom; mean fold change ± SD from two biological replicates) confirm HMGB1 knockdown in IMR90.
PCA analysis plot (top) of control (black) and HMGB1 knockdown replicates (blue). Scatter plot (bottom) showing significantly up‐ (> 0.6 log2‐fold change; orange) or downregulated genes (< −0.6 log2‐fold change; green) upon HMGB1 knockdown.
Bar plots showing GO terms associated with the up/downregulated genes from panel B and their enrichment P‐values (−log; right).
Gene set enrichment analysis of HMGB1‐KD data. Normalized enrichment scores (NES) and associated P‐values for each gene set are shown.
Representative images of IMR90 overexpressing HMGB1‐GFP, immunostained for p21 and CTCF, and counterstained with DAPI. IMR90 transfected with empty vectors provide a control. Bar: 5 μm.
Bar plots showing RT–qPCR data (mean mRNA fold change ± SD, from two biological replicates) for selected genes in HMGB1‐overexpressing compared to control IMR90. The mean fold change for each mRNA from HMGB1 knockdown RNA‐seq data is also shown for comparison (magenta bars). *P < 0.01; unpaired two‐tailed Student’s t‐test.

Volcano plot (left) showing mass‐spec data for proteins co‐immunoprecipitating with HMGB1. Statistically enriched HMGB1 interactors (orange dots) associate with the GO terms/pathways illustrated in the network analysis (right; node size reflects the number of proteins it includes; proteins are listed in Dataset EV4).
Venn diagram showing 1/3 of HMGB1 interactors classifying as RNA‐binding proteins (according to Castello et al, 2016).
Genome browser views showing HMGB1 sCLIP data (black) along the ASH1L, CCNL2, and TET2 loci; input tracks (gray) provide background levels. *: significantly enriched peaks. The consensus motif for HMGB1 binding on RNA is also shown (bottom right).
Bar graphs showing genomic distribution of HMGB1 RNA‐bound peaks (log2 enrichment).
Bar plots showing relative occurrence of differential‐splicing events in IMR90 undergoing senescence (left), in HMGB1 knockdown IMR90 (middle), or in HMGB1‐bound mRNAs (right). The number of bound mRNAs (N) analyzed is indicated below each bar.
Venn diagram showing differential‐splicing events shared between conditions from panel (F).
Heatmaps showing GO terms/pathways associated with differentially spliced mRNAs shared between senescence entry and HMGB1 knockdown from panel (F).
As in panel G, but for the 75 mRNAs also bound by HMGB1 in sCLIP data.
Venn diagram (left) showing 15 HMGB1 interacting proteins from panel (A) are also downregulated upon both senescence entry and HMGB1 knockdown in IMR90. Of these, 12 are RBPs, 6 have been implicated in senescence (asterisks), and 4 are bound by HMGB1 in sCLIP data (arrows).
Bar graphs showing mean fold change in selected mRNAs (over ± SD from two biological replicates) from ILF3 (purple), RBMX (white), or PNN knockdown experiments (blue) in proliferating IMR90. *: significantly different to siRNA controls; P < 0.01, unpaired two‐tailed Student’s t‐test. Dashed line indicates no change in expression.
References
-
- Bianchi ME, Crippa MP, Manfredi AA, Mezzapelle R, Rovere Querini P, Venereau E (2017) High‐mobility group box 1 protein orchestrates responses to tissue damage via inflammation, innate and adaptive immunity, and tissue repair. Immunol Rev 280: 74–82 - PubMed
Publication types
MeSH terms
Substances
LinkOut - more resources
Full Text Sources
Molecular Biology Databases
