. 2021 Jun;9(6):e002305.
doi: 10.1136/jitc-2020-002305.

Tumor-derived lactate inhibit the efficacy of lenvatinib through regulating PD-L1 expression on neutrophil in hepatocellular carcinoma

Affiliations

Tumor-derived lactate inhibit the efficacy of lenvatinib through regulating PD-L1 expression on neutrophil in hepatocellular carcinoma

Haijing Deng et al. J Immunother Cancer. 2021 Jun.

Abstract

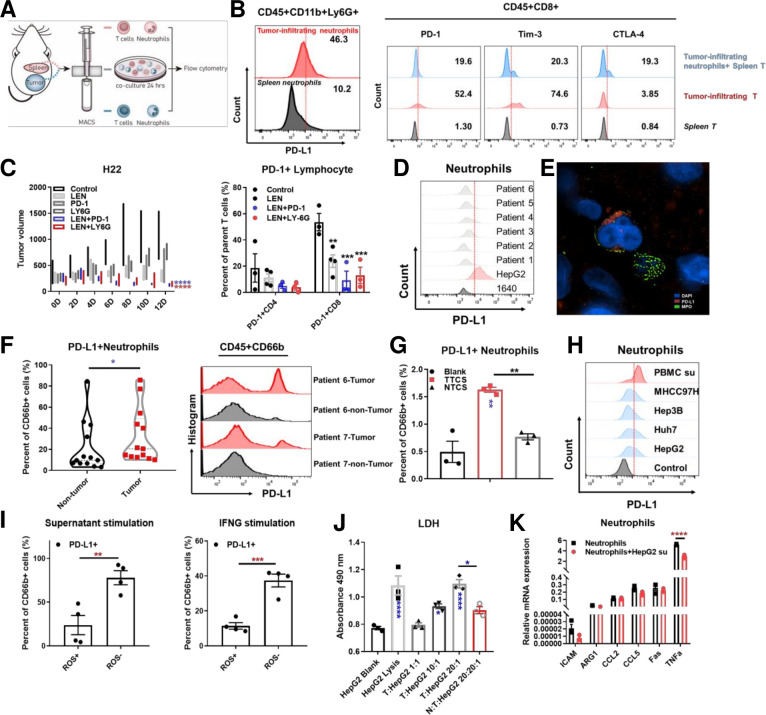
Background: Neutrophils play a controversial role in tumor development. The function of programmed cell death-1 ligand (PD-L1+) neutrophils, however, may inhibit the cytotoxicity of anti-tumor immunity. In this study, we elucidate the stimulators of PD-L1+ neutrophils in tumor microenvironment (TME) and explore the optimal combination to enhance the effect of lenvatinib by inhibiting PD-L1+ neutrophils in hepatocellular carcinoma.

Methods: Neutrophil infiltration after lenvatinib treatment was examined with RNA sequencing and multicolor flow cytometry analysis in patient samples, subcutaneous and orthotopic mouse models. Neutrophils and T cells were isolated from peripheral blood and tumor tissues and purified with magnetic beads for cytotoxicity assay. Metabolites and cytokines were detected by a biochemical analyzer manufactured by Yellow Springs Instrument (YSI) and proteome profiler cytokines array. In vitro screening of pathway inhibitors was used to identify possible candidates that could reduce PD-L1+ neutrophil infiltration. Further in vivo assays were used for verification.

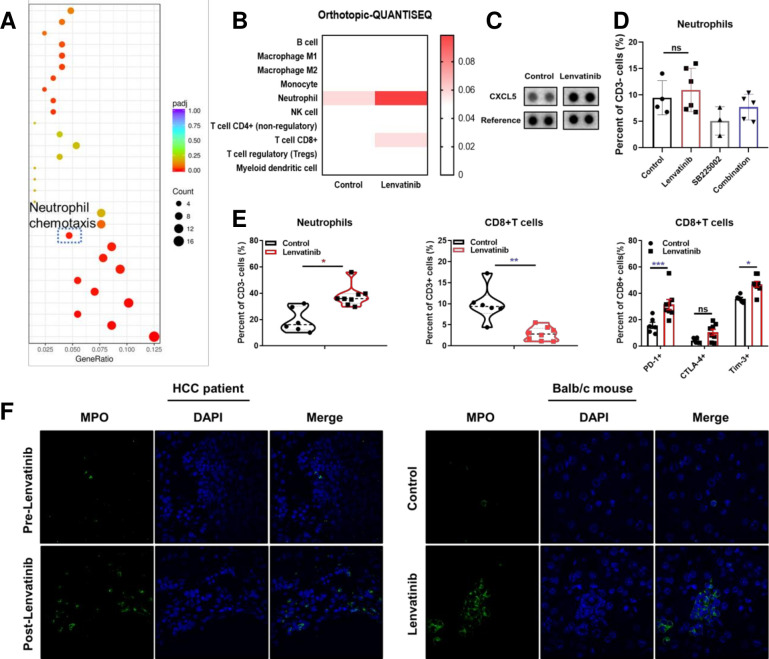
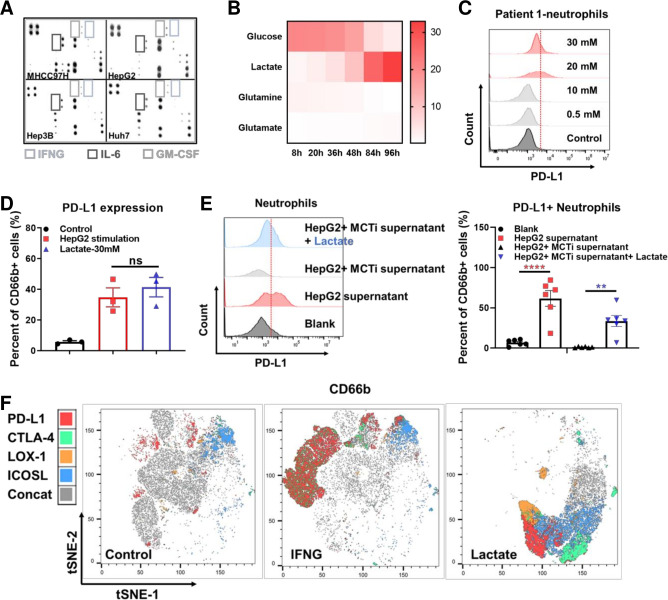
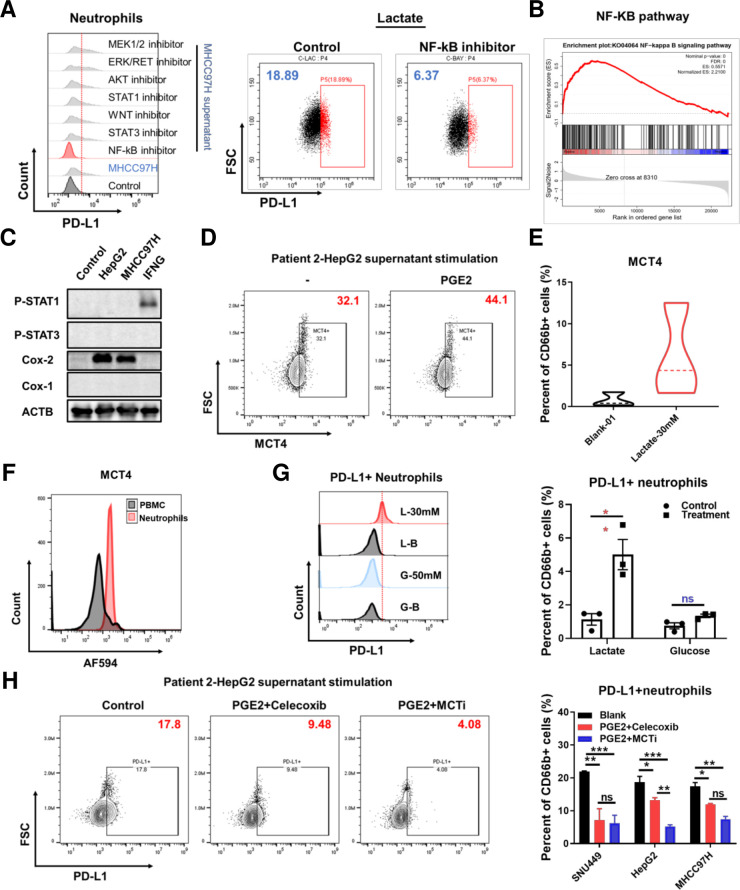
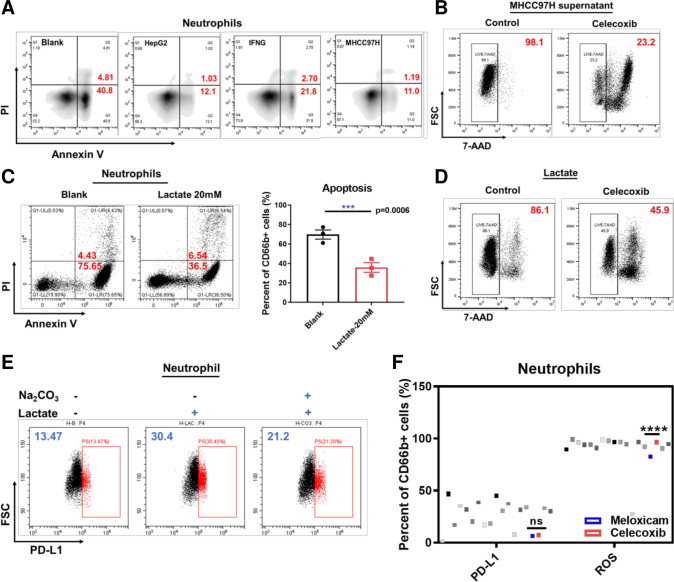
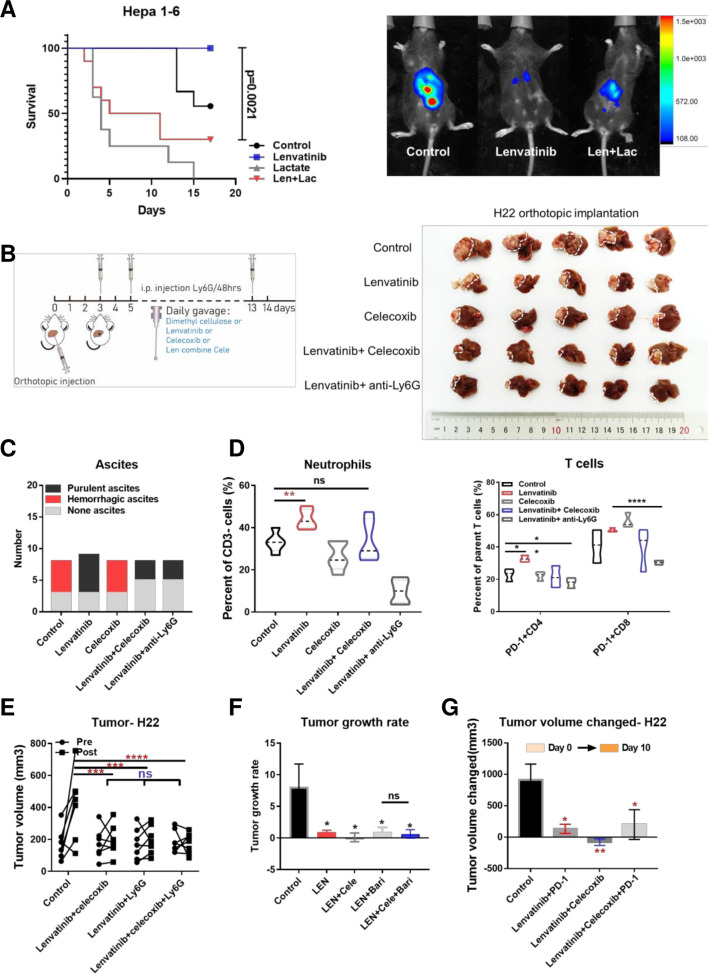
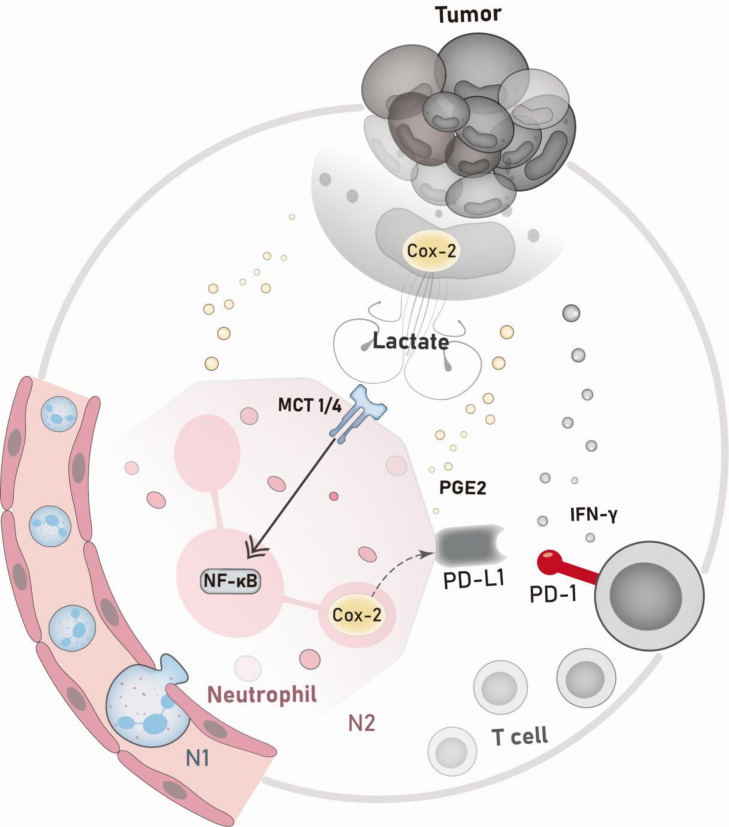
Results: Lenvatinib increased neutrophil recruitment by inducing CXCL2 and CXCL5 secretion in TME. After entering TME, neutrophils polarized toward N2 phenotype. PD-L1 expression was simultaneously upregulated. Thus, lenvatinib efficacy on tumor cells hindered. The increasing PD-L1+ neutrophils positively corelated with a suppressive T cell phenotype. Further investigation indicated that JAK/STAT1 pathway activated by immune-cell-derived interferon γ and MCT1/NF-kB/COX-2 pathway activated by high concentrations of tumor-derived lactate could induce PD-L1+ neutrophils. The latter could be significantly inhibited by COX-2 inhibitor celecoxib. Further in vivo assays verified that Celecoxib decreased the survival of lactate-stimulated PD-L1+ neutrophil and promoted the antitumor effect of lenvatinib.

Conclusions: PD-L1+ neutrophils decrease T cell cytotoxicity. Tumor-derived lactate induces PD-L1 expression on neutrophils via MCT1/NF-κB/COX-2 pathway. Thus, COX-2 inhibitor could reduce PD-L1+ neutrophil and restore T cell cytotoxicity. This may provide a potent addition to lenvatinib.

Keywords: combination; drug therapy; metabolic networks and pathways; neutrophil infiltration; programmed cell death 1 receptor; tumor microenvironment.


Conflict of interest statement

Competing interests: None declared.

Figures

Figure 1
Figure 1
The effect of lenvatinib on chemokines and recruitment of neutrophils. Gene ontology analysis for pathways regulated following treatment with lenvatinib versus control in subcutaneous BALB/c mice models assessed by RNA-seq (A). Immune infiltration estimations by timer for expression profiles tested by RNA-Seq data of orthotopic Hepa1-6 models (B). Proteome profiler mice XL cytokine array analysis for peripheral blood following treatment with lenvatinib versus control in BALB/c mice models (C). Histogram showing the effect of lenvatinib monotherapy, SB225002 and lenvatinib in combination with SB225002 on neutrophil recruitment (D). Scatter plots showing the infiltration of neutrophils, CD8+T cells and expression of PD-1, CTLA-4 and Tim-3 on CD8 +T cells in orthotopic BALB/c mice models (E). Representative immunofluorescence staining images showing infiltration of MPO+ cells in biopsy samples of HCC patients before and after lenvatinib treatment (left, 60×) and in tissue samples of orthotopic BALB/c mice models following treatment with lenvatinib versus control (right. 100×) (F). *P<0.05, **p<0.01, ***p<0.001. HCC, hepatocellular carcinoma; ns, not significant; PD-1, programmed cell death-1; RNA-Seq, RNA sequencing.
Figure 2
Figure 2
The effect of tumor-associated neutrophils on lenvatinib treatment in H22 BALB/c mice models and cytotoxicity of T cells in ex vivo the diagram and representative flow cytometry images showing the expression of PD-L1 on tumor infiltrating neutrophils and spleen neutrophils isolated from BALB/c mice models subcutaneously implanted with H22 cells (A, B). Representative flow cytometry images showing the expression of PD-1, Tim-3 and CTLA-4 on spleen T cells, tumor infiltrating T cells and spleen T cells cocultured with tumor infiltrating neutrophils isolated from BALB/c mice models subcutaneously implanted with H22 cells (B). Mean tumor volume for different treatments (control, lenvatinib, anti-PD1 antibody, anti-Ly-6G antibody, lenvatinib combining anti-PD1 antibody and lenvatinib combining anti-Ly-6G antibody) in BALB/c mice models subcutaneously implanted with H22 cells over 10 days of treatment (n=3 per group) and histogram showing the proportion of PD-1 +CD4 and CD8 cells in each treatment group (C). The expression of PD-L1 on neutrophils in peripheral blood isolated from HCC patients (D). Representative N-SIM image showing PD-L1 expression and MPO positive cells infiltration in HCC patients tissue samples (red: PD-L1; green: MPO; blue: DAPI) (E). Histogram (left) and representative flow cytometry images (right) showing the expression of PD-L1 on neutrophils infiltrating in tumor and non-tumor tissues isolated from HCC patients (F). Representative flow cytometry images (left) and histogram (right) showing the expression of PD-L1 on neutrophils stimulated by tumor tissue culture supernatant compared with non-tumor tissue culture supernatant (G). Representative flow cytometry images showing PD-L1 expression levels on neutrophils stimulated by supernatant derived from PBMC, MHCC97H, Hep3B, HUH seven and HepG2 for 24 hours (H). The correlation of PD-L1 expression and ROS production in neutrophils stimulated by HepG2 supernatant and IFNG assessed by flow cytometry (I). LDH assay for the effect of neutrophils on T cell cytotoxicity with different effector (T cells) and target (HepG2 cells) ratio in coculture system (J). Histogram showing the relative mRNA expression in neutrophils stimulated by HepG2 supernatant versus control (K). *P<0.05, **p<0.01, ***p<0.001, ****p<0.0001. HCC, hepatocellular carcinoma; IFNG, interferon gamma; LDH, PBMC, peripheral blood mononuclear cell; PD-1, programmed cell death-1; PD-L1, programmed cell death-1 ligand; ROS, reactive oxygen species.
Figure 3
Figure 3
The effect of lactate on PD-L1 expression on tumor-associated neutrophils. Human inflammation array analysis for supernatant derived from MHCC97H, Hep3B, HUH seven and HepG2 (A). YSI analysis for metabolites in the supernatant of HepG2 cultured at different time points (B). Representative flow cytometry images showing PD-L1 expression levels on neutrophils stimulated by lactate with different concentration (C). Histogram showing PD-L1 expression levels on neutrophils stimulated by supernatant derived from HepG2 and supplementary lactate (D). Representative flow cytometry images and histogram showing the PD-L1 expression on neutrophils isolated form HCC patients’ peripheral blood after stimulated by HepG2 supernatant, MCT inhibitor and lactate (E). t-SNE analysis by Flowjo for the expression of PD-L1, CTLA-4, LOX-1 and ICOSL on neutrophils stimulated by control, IFNG and lactate, respectively (F). **p<0.01, ****p<0.0001. HCC, hepatocellular carcinoma; IFNG, interferon gamma; IL-6, interleukin 6; ns, not significant; PD-L1, programmed cell death-1 ligand.
Figure 4
Figure 4
The effect of NF-κB-COX-2-PGE2 on PD-L1 and MCT4 expression. Representative flow cytometry images showing PD-L1 expression levels on neutrophils isolated from HCC patients stimulated by MHCC97H supernatant (left) treated with different inhibitors and stimulated by lactate and treated with Bay 11–7082 (right) (A). GSEA analysis of the orthotopic sequencing data of Hepa1-6 mouse model for NF-κB pathway (B). Western blot analysis for Stat1/3 and cox1/2 expression stimulated by the supernatant of HepG2 and MHCC97H, IFNG and GM-CSF respectively for 24 hours (C). Representative flow cytometry images showing MCT4 expression on neutrophils stimulated by PGE2 (10 uM) (D) and lactate (30 mM) (E). Representative flow cytometry images showing MCT4 expression on neutrophils and PBMC derived from the peripheral blood of HCC patients (F). Representative flow cytometry images and histogram showing PD-L1 expression on neutrophils stimulated by lactate (30 mM) and glucose (50 mM) (G). Representative flow cytometry images and histogram showing PD-L1 expression on neutrophils stimulated by supernatant derived from SNU449, HepG2, MHCC97H treated with or without celecoxib and α-cyano-4-hydroxycinnamic acid (H). *P<0.05, **p<0.01, ***p<0.001, ****p<0.0001. GSEA, Gene Set Enrichment Analysis; HCC, hepatocellular carcinoma; IFNG, interferon gamma; ns, not significant; PD-L1, programmed cell death-1 ligand.
Figure 5
Figure 5
The effect of lactate-H+ on neutrophils. Representative flow cytometry images showing apoptosis of neutrophils stimulated by supernatant derived from HepG2 and MHCC97H and IFNG (A). Representative flow cytometry images showing lived neutrophils after stimulated by MHCC97H supernatant and treated with or without celecoxib (B). Representative flow cytometry images showing apoptosis of neutrophils stimulated by lactate (20 mM) (C). Representative flow cytometry images showing lived neutrophils after stimulated by lactate (20 mM) and treated with or without celecoxib (D). Representative flow cytometry images showing PD-L1 expression on neutrophils stimulated with or without Na2CO3 (1 mg/mL) and lactate (20 mM) (E). Dot plots showing PD-L1 expression levels on neutrophils and ROS production of neutrophils treated with different nonsteroidal anti-inflammatory drugs or stimulated by HepG2 supernatant assessed by flow cytometry (F). *P<0.05, **p<0.01, ***p<0.001, ****p<0.0001. IFNG, interferon gamma; ns, not signiicant; PD-L1, programmed cell death-1 ligand; ROS, reactive oxygen species; FSC, forward scatter.
Figure 6
Figure 6
The effect of lenvatinib in combination with celecoxib in H22 BALB/c mice models. Survival for orthotopic murine models after 14 days of treatment by 0.5% methylcellulose, lenvatinib (10 mg/kg), lactate (0.5 g/kg), lenvatinib combined with lactate (A). Treatment pattern diagram for murine models and tumor tissue samples in orthotopic liver after 14 days of treatment by 0.5% methylcellulose, lenvatinib (10 mg/kg), celecoxib (50 mg/kg), lenvatinib combined with celecoxib or anti-Ly6G antibodies (per 48 hours) (B). Histogram showing the occurrence of ascites in different treatment group (C). Histogram showing infiltration of neutrophils (left) and PD-1+ T cells (right) in each treatment group (D). Tumor volume before and after 10 days of treatment by lenvatinib combined with celecoxib, Ly6G antibodies and the triple combination for BALB/c mice subcutaneously implanted with H22 cells (n=7 per group) (E). Tumor growth rate over 10 days of treatment by lenvatinib, lenvatinib combined with baricitinib, celecoxib respectively and the triple combination for BALB/c mice models subcutaneously implanted with H22 cells (n=7 per group) (F). Tumor volume changed before and after 10 days of treatment by lenvatinib combined with celecoxib, PD-1 antibodies and the triple combination for BALB/c mice subcutaneously implanted with H22 cells (n=7 per group) (G). *P<0.05, **p<0.01, ***p<0.001, ****p<0.0001. PD-1, programmed cell death-1; ns, not significant.
Figure 7
Figure 7
Major findings in graphical form.

References

    1. Kimura T, Kato Y, Ozawa Y, et al. . Immunomodulatory activity of lenvatinib contributes to antitumor activity in the Hepa1-6 hepatocellular carcinoma model. Cancer Sci 2018;109:3993–4002. 10.1111/cas.13806 - DOI - PMC - PubMed
    1. Deng H, Kan A, Lyu N, et al. . Dual vascular endothelial growth factor receptor and fibroblast growth factor receptor inhibition elicits antitumor immunity and enhances programmed cell death-1 checkpoint blockade in hepatocellular carcinoma. Liver Cancer 2020;9:338–57. 10.1159/000505695 - DOI - PMC - PubMed
    1. Kato Y, Tabata K, Kimura T, et al. . Lenvatinib plus anti-PD-1 antibody combination treatment activates CD8+ T cells through reduction of tumor-associated macrophage and activation of the interferon pathway. PLoS One 2019;14:e0212513. 10.1371/journal.pone.0212513 - DOI - PMC - PubMed
    1. Kudo M, Finn RS, Qin S, et al. . Lenvatinib versus sorafenib in first-line treatment of patients with unresectable hepatocellular carcinoma: a randomised phase 3 non-inferiority trial. Lancet 2018;391:1163–73. 10.1016/S0140-6736(18)30207-1 - DOI - PubMed
    1. Caruso S, O'Brien DR, Cleary SP, et al. . Genetics of hepatocellular carcinoma: approaches to explore molecular diversity. Hepatology 2021;73 Suppl 1:14-26. 10.1002/hep.31394 - DOI - PubMed

Publication types