. 2021 Sep 1;27(17):4768-4780.
doi: 10.1158/1078-0432.CCR-21-0529. Epub 2021 Jun 24.

Intratumor CMS Heterogeneity Impacts Patient Prognosis in Localized Colon Cancer

Affiliations

Intratumor CMS Heterogeneity Impacts Patient Prognosis in Localized Colon Cancer

Laetitia Marisa et al. Clin Cancer Res. .

Abstract

Purpose: The consensus molecular subtypes (CMS) represent a significant advance in the understanding of intertumor heterogeneity in colon cancer. Intratumor heterogeneity (ITH) is the new frontier for refining prognostication and understanding treatment resistance. This study aims at deciphering the transcriptomic ITH of colon cancer and understanding its potential prognostic implications.

Experimental design: We deconvoluted the transcriptomic profiles of 1,779 tumors from the PETACC8 trial and 155 colon cancer cell lines as weighted sums of the four CMSs, using the Weighted In Silico Pathology (WISP) algorithm. We assigned to each tumor and cell line a combination of up to three CMS subtypes with a threshold above 20%.

Results: Over 55% of tumors corresponded to mixtures of at least two CMSs, demonstrating pervasive ITH in colon cancer. Of note, ITH was associated with shorter disease-free survival (DFS) and overall survival, [HR, 1.34; 95% confidence interval (CI; 1.12-1.59), 1.40, 95% CI (1.14-1.71), respectively]. Moreover, we uncovered specific combinations of CMS associated with dismal prognosis. In multivariate analysis, ITH represents the third parameter explaining DFS variance, after T and N stages. At a cellular level, combined WISP and single-cell transcriptomic analysis revealed that most colon cancer cell lines are a mixture of cells falling into different CMSs, indicating that ITH may correspond to distinct functional statuses of colon cancer cells.

Conclusions: This study shows that CMS-based transcriptomic ITH is frequent in colon cancer and impacts its prognosis. CMS-based transcriptomic ITH may correspond to distinct functional statuses of colon cancer cells, suggesting plasticity between CMS-related cell populations. Transcriptomic ITH deserves further assessment in the context of personalized medicine.


Conflict of interest statement

C. Lepage reports personal fees from Bayer, Amgen, Ipsen, Pierre Fabre, and Novartis outside the submitted work. V. Boige reports grants, personal fees, and non-financial support from Merck Serono; personal fees and non-financial support from Bayer, Roche, Ipsen, Merck MSD, and Amgen; non-financial support from Sanofi; and personal fees from BMS, Eisai, and Novartis outside the submitted work. J.-F. Emile reports personal fees from Pierre Fabre, Merck Sharp & Dohme, Merck Serono, Amgen, Novartis, and Bristol Myers Squibb outside the submitted work. P. Laurent-Puig reports grants from Federeation francophones de cancerologie disgestive and Ligue National de luttte contre le cancer during the conduct of the study, as well as personal fees from Amgen, Boehringer Ingelheim, Sanofi, MSD, Imedex, Pierre Fabre, and Institut Servier; grants and personal fees from Biocartis, BMS, and Roche; and grants from Institut Roche, Bio-Rad, and Servier outside the submitted work. No disclosures were reported by the other authors.

Figures

Figure 1.
Figure 1.
RF CMS classification, characterization, and survival impact based on related probability. A, Fraction of votes (probability) of the RF classification for each of the four CMSs within each of the 1,779 samples (columns), summing up to one for each sample. Samples are grouped according to RF-predicted CMS. The horizontal dotted white line indicates an RF probability of 50%. The vertical dotted white line delimits, within each CMS, samples with low (<50%) versus high (>50%) probability of CMS assignment according to RF classifier. B, The proportions of samples with dMMR, BRAF mutated (BRAFm), KRAS/NRAS mutated (RASm), CIMP+, female gender, proximal location, and G3/G4 grade are shown according to CMS with either high (left) or low RF probability (right). # indicates the P values of the χ2 tests comparing the distribution of values of each variable between RF > 50% and RF < 50% samples. C, Heatmaps showing the mean scores for eight immune and two stromal cell populations infiltration (based on MCP-counter estimates), a surrogate of the Immunoscore (Immunoscore-like), and three pathways are shown according to CMS with either high (left) or low RF probability (right). The P values of the t test comparing the distribution of values of each variable between RF > 50% and RF < 50% samples are displayed in the extended data Supplementary Table S3. DFS curves according to RF-predicted CMS in PETACC8 samples, based on RF probability of class assignment above 50% (D) or below 50% (E). Kaplan–Meier curves of DFS (F) and OS (G) are shown according to low (<50%) versus high (>50%) RF probability (whatever the predicted CMS). CMS color codes: CMS1 (orange), CMS2 (blue), CMS3 (purple), CMS4 (green).
Figure 2.
Figure 2.
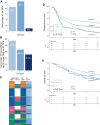
ITH distribution and impact on survival. A, Barplots showing the proportions of low (i), intermediate (ii), and high (iii) ITH scores in the 1,779 PETACC8 samples. B, Barplots showing the proportion of identical CMS assignment between WISP top weighted CMS (WISP major CMS) and RF-based CMS, according to ITH score. C, Sample level data (lines) representing WISP major CMS and second top weighted CMS (WISP minor CMS), RF CMS and ITH score in the 1,779 PETACC8 samples. Kaplan–Meier curves of DFS (D) and OS (E) are shown according to ITH scores. The P value of the overall log-rank test and the HRs of the univariate Cox model are shown. Color code for ITH score: low (i), light blue; intermediate (ii), blue; high (iii), dark blue.
Figure 3.
Figure 3.
CMS intrasample heterogeneity in colon cancer cell lines. A, CMS ITH was determined in 155 colon cancer cell lines (GSE59857 dataset). Intrasamples WISP weights of CMS1..4 are shown for each cell line (column). Comparison of intrasample CMS1..4 proportions in the Lovo and Mdst8 cell lines, based either on bulk data (B) from three datasets (GSE59857, GDSC, CCLE) or on single-cell data (C). For bulk data, CMS1..4 intrasample proportions are estimated using WISP. For single-cell data, CMS1..4 intrasample proportions are estimated using the SSP from Guinney and colleagues (5), applied to each cell. D, Single-cell RNA-seq data of six colon cancer samples from the GSE144735 dataset. CMS label per cell comes from the online annotation file of this dataset. The intrasample distribution of these CMS labels is shown. ITH scores based on this distribution are shown (bottom).
Figure 4.
Figure 4.
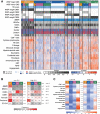
A, CMS intrasample heterogeneity, based on WISP deconvolution algorithm, and related characteristics. CMS intrasample heterogeneity, based on WISP deconvolution algorithm, on 1,779 samples from PETACC8 trial. Samples (columns) are grouped according to WISP major CMS (WISP top weighted CMS), and WISP minor CMS (WISP second highest weighted CMS, if weighted above 20%). The CMS color code is as follows: CMS1 (orange), CMS2 (blue), CMS3 (purple), CMS4 (green). “Pure” samples, related to a unique CMS (i.e., with no WISP minor CMS), are shown in white (line 2). The proportions of samples in these categories are also reported (line 1). Further shown are ITH score; intrasample WISP weights for each CMS [from 0 (white) to 1 (black)]; molecular and clinical features, including dMMR, BRAFm, RASm, CIMP+, gender, tumor location, grade, immune and stromal cell populations infiltration (based on MCP-counter), a surrogate of the Immunoscore (Immunoscore-like); and scores related to EMT, TGFβ, and angiogenesis pathways. MCP-counter and pathway scores are trimmed z-scores [low (−2): blue, intermediate (0): white, high (2): red]. Color codes: Black = yes or grade 3/4; gray = no or grade 1/2; blue = pMRR or male or proximal; red = dMMR or female or distal. B, The proportions of samples with dMMR, BRAFm, RASm, CIMP+, female gender, proximal location, and G3/G4 grade are shown according to CMS with either low ITH (ITH score = 1, left) or high ITH (ITH score >1, right). * indicates the P values of the χ2 tests comparing the distribution of values of each variable between low ITH and high ITH samples. C, Heatmaps showing the mean scores for eight immune and two stromal cell populations infiltration (based on MCP-counter estimates), a surrogate of the Immunoscore (Immunoscore-like), and three pathways are shown according to CMS with either low ITH (ITH score = 1, left) or high ITH (ITH score >1, right). The P values of the t test comparing the distribution of values of each variable between low ITH and high ITH samples are displayed in the extended data Supplementary Table S4.
Figure 5.
Figure 5.
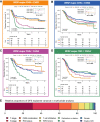
DFS according to intrasample CMS combinations. The DFS of 1,779 samples from PETACC8 trial are shown according to WISP top and second top weighted CMS. Kaplan–Meier curves for DFS from the samples classified as CMS1 (respectively, CMS2, CMS3, CMS4) based on WISP top weight, and segregated according to WISP second top weighted CMS (if above 20%) are shown in A (respectively, B, C, and D). E, Relative proportions of DFS explained variance, for all prognostic factors included in the DFS Cox multivariate model, based on the χ2 proportion test. The variable “CMS combination” is derived from the 16 possible combinations of the two top weighted CMS according to WISP deconvolution, and is equal to 1 for the following combinations: CMS1.CMS3, CMS1.CMS4, CMS3.CMS4, CMS4.CMS1, 0 otherwise.
Figure 6.
Figure 6.
OS according to intrasample CMS combinations. The OS of 1,779 samples from PETACC8 trial are shown according to WISP top and second top weighted CMS. Kaplan–Meier curves for OS from the samples classified as CMS1 (respectively CMS2, CMS3, CMS4) based on WISP top weight, and segregated according to WISP second top weighted CMS (if above 20%) are shown in A (respectively B, C, D). The P value of the overall log-rank test, and the HRs of the univariate Cox model, are shown within each panel. E, Relative proportions of OS explained variance, for all prognostic factors included in the OS Cox multivariate model, based on the χ2 proportion test. The variable “CMS combination” is derived from the 16 possible combinations of the two top weighted CMS according to WISP deconvolution, and is equal to 1 for the following combinations: CMS1.CMS3, CMS1.CMS4, CMS3.CMS4, CMS4.CMS1, 0 otherwise.

Similar articles

Cited by

References

    1. Allemani C, Matsuda T, Di Carlo V, Harewood R, Matz M, Nikšić M, et al. Global surveillance of trends in cancer survival 2000–14 (CONCORD-3): analysis of individual records for 37 513 025 patients diagnosed with one of 18 cancers from 322 population-based registries in 71 countries. Lancet 2018;391:1023–75. - PMC - PubMed
    1. Van Cutsem E, Cervantes A, Adam R, Sobrero A, Van Krieken JH, Aderka D, et al. ESMO consensus guidelines for the management of patients with metastatic colorectal cancer. Ann Oncol 2016;27:1386–422. - PubMed
    1. Taieb J, Le Malicot K, Shi Q, Penault-Llorca F, Bouché O, Tabernero J, et al. Prognostic value of BRAF and KRAS mutations in MSI and mss stage III colon cancer. J Natl Cancer Inst 2017;109:djw272. - PMC - PubMed
    1. Smeby J, Sveen A, Merok MA, Danielsen SA, Eilertsen IA, Guren MG, et al. CMS-dependent prognostic impact of KRAS and BRAFV600E mutations in primary colorectal cancer. Ann Oncol 2018;29:1227–34. - PMC - PubMed
    1. Guinney J, Dienstmann R, Wang X, de Reyniès A, Schlicker A, Soneson C, et al. The consensus molecular subtypes of colorectal cancer. Nat Med 2015;21:1350–6. - PMC - PubMed

Publication types