. 2021 Sep 1;27(17):4898-4909.
doi: 10.1158/1078-0432.CCR-21-1010. Epub 2021 Jun 24.

ATR Inhibition Induces CDK1-SPOP Signaling and Enhances Anti-PD-L1 Cytotoxicity in Prostate Cancer

Affiliations

ATR Inhibition Induces CDK1-SPOP Signaling and Enhances Anti-PD-L1 Cytotoxicity in Prostate Cancer

Zhe Tang et al. Clin Cancer Res. .

Abstract

Purpose: Despite significant benefit for other cancer subtypes, immune checkpoint blockade (ICB) therapy has not yet been shown to significantly improve outcomes for men with castration-resistant prostate cancer (CRPC). Prior data have shown that DNA damage response (DDR) deficiency, via genetic alteration and/or pharmacologic induction using DDR inhibitors (DDRi), may improve ICB response in solid tumors in part due to induction of mitotic catastrophe and innate immune activation. Discerning the underlying mechanisms of this DDRi-ICB interaction in a prostate cancer-specific manner is vital to guide novel clinical trials and provide durable clinical responses for men with CRPC.

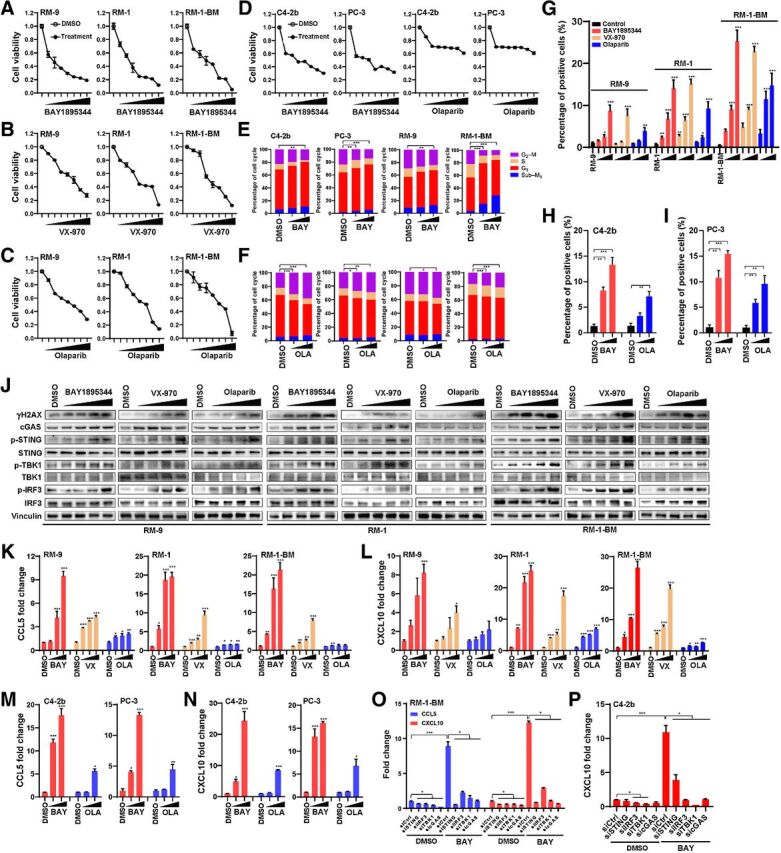
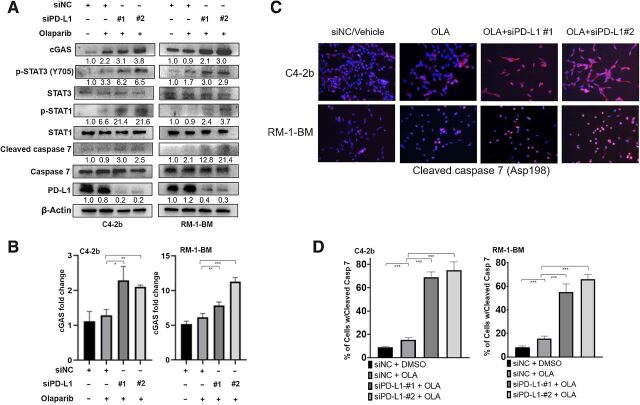
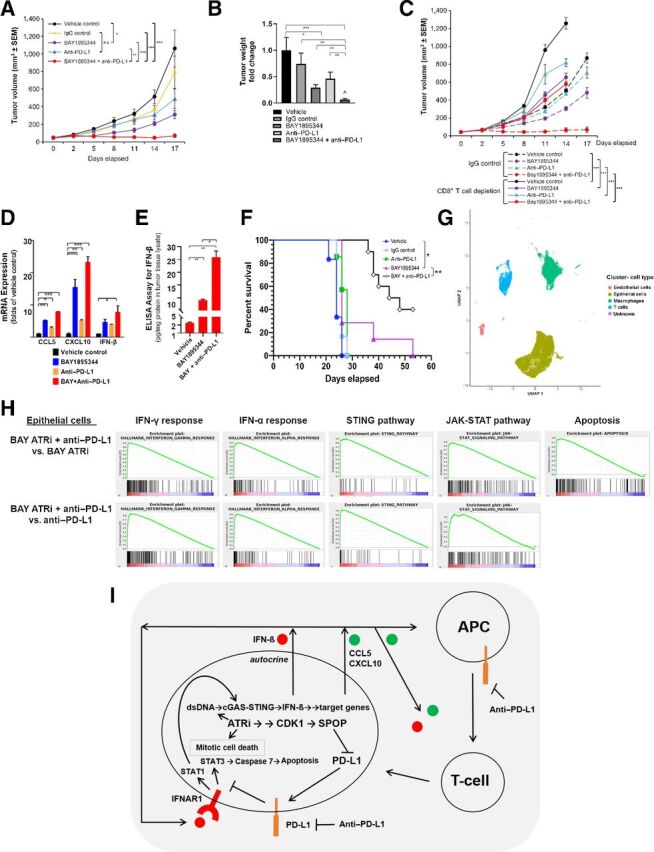
Experimental design: We treated prostate cancer cell lines with potent, specific inhibitors of ATR kinase, as well as with PARP inhibitor, olaparib. We performed analyses of cGAS-STING and DDR signaling in treated cells, and treated a syngeneic androgen-indifferent, prostate cancer model with combined ATR inhibition and anti-programmed death ligand 1 (anti-PD-L1), and performed single-cell RNA sequencing analysis in treated tumors.

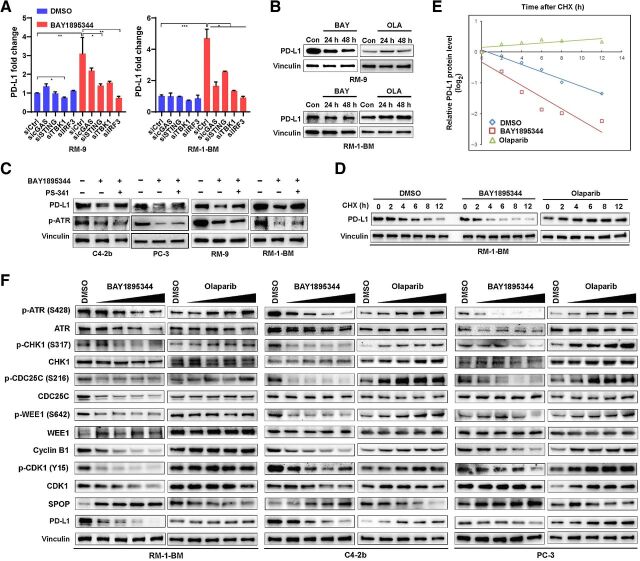
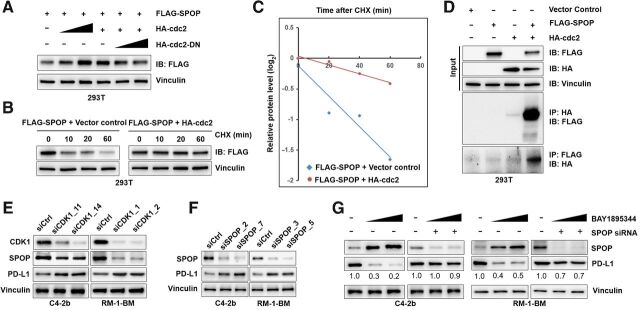
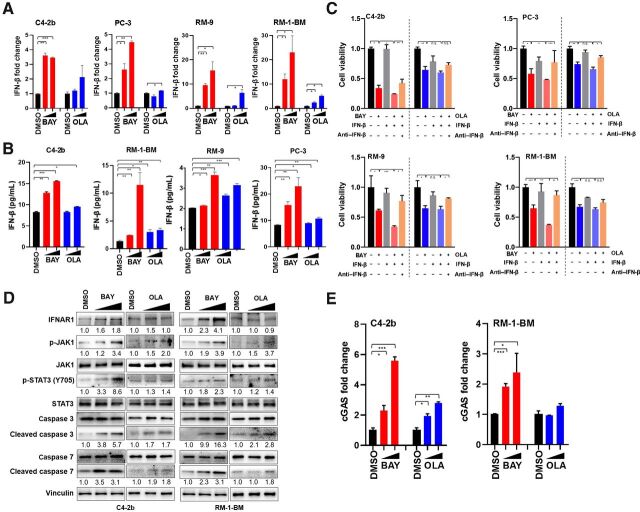
Results: ATR inhibitor (ATRi; BAY1895433) directly repressed ATR-CHK1 signaling, activated CDK1-SPOP axis, leading to destabilization of PD-L1 protein. These effects of ATRi are distinct from those of olaparib, and resulted in a cGAS-STING-initiated, IFN-β-mediated, autocrine, apoptotic response in CRPC. The combination of ATRi with anti-PD-L1 therapy resulted in robust innate immune activation and a synergistic, T-cell-dependent therapeutic response in our syngeneic mouse model.

Conclusions: This work provides a molecular mechanistic rationale for combining ATR-targeted agents with immune checkpoint blockade for patients with CRPC. Multiple early-phase clinical trials of this combination are underway.


Figures

Figure 1. ATRi demonstrates marked cytotoxicity and cGAS–STING activation in prostate cancer models. A–D, MTS assay of human (C4–2b and PC-3) and mouse (RM-9, RM-1, and RM-1-BM) prostate cancer cell lines treated with ATRi (BAY1895344 and VX-970) or olaparib (OLA). Concentrations range from 0.125 to 8 μmol/L as labeled in the figures (x-axis). Specific concentrations within this range (0.125, 0.25, 0.5, 1, 2, 4, and 8 μmol/L) were used for other experiments as indicated. Viable cells are represented as the fold change relative to DMSO (vehicle control) treatment. E and F, Flow cytometry cell-cycle analyses of BAY1895344-treated (10 and 100 nmol/L, in E) and olaparib-treated (250 and 500 nmol/L, in F) C4–2b, PC-3, RM-9, and RM-1-BM prostate cancer cell lines. G–I, Quantitative analysis of PicoGreen staining in prostate cancer cells treated with DMSO (vehicle control), BAY1895344 (concentrations were 0.5, 1, and 2 μmol/L), VX-970 (concentrations were 0.75, 1.5, and 3 μmol/L), or olaparib (concentrations were 1.2, 2.5, and 5 μmol/L) for 48 hours. Data represent mean ± SEM of three independent experiments. J, Immunoblots of select proteins in prostate cancer cells treated with increasing doses of BAY1895344, VX-970, or olaparib (concentrations ranging from 0.125 to 2 μmol/L). K–N, RT-qPCR analysis of CCL5 and CXCL10 in prostate cancer cells treated with DMSO (vehicle control), BAY1895344, VX-970, or olaparib (concentrations ranging from 0.5 to 2 μmol/L). O and P, RT-qPCR analysis of CCL5 and CXCL10 in RM-1-BM or C4–2b prostate cancer cells in response to BAY1895344 (2 μmol/L) or DMSO (vehicle control) following knockdown of cGAS, STING, TBK1, or IRF3 gene expression in vitro via transfection with control siRNA or gene-specific siRNA (sicGAS, siSTING, siTBK1, or siIRF3). n.s., not significant; * P < 0.05; **, P < 0.01; ***, P < 0.001.
Figure 1.
ATRi demonstrates marked cytotoxicity and cGAS–STING activation in prostate cancer models. A–D, MTS assay of human (C4–2b and PC-3) and mouse (RM-9, RM-1, and RM-1-BM) prostate cancer cell lines treated with ATRi (BAY1895344 and VX-970) or olaparib (OLA). Concentrations range from 0.125 to 8 μmol/L as labeled in the figures (x-axis). Specific concentrations within this range (0.125, 0.25, 0.5, 1, 2, 4, and 8 μmol/L) were used for other experiments as indicated. Viable cells are represented as the fold change relative to DMSO (vehicle control) treatment. E and F, Flow cytometry cell-cycle analyses of BAY1895344-treated (10 and 100 nmol/L, in E) and olaparib-treated (250 and 500 nmol/L, in F) C4–2b, PC-3, RM-9, and RM-1-BM prostate cancer cell lines. G–I, Quantitative analysis of PicoGreen staining in prostate cancer cells treated with DMSO (vehicle control), BAY1895344 (concentrations were 0.5, 1, and 2 μmol/L), VX-970 (concentrations were 0.75, 1.5, and 3 μmol/L), or olaparib (concentrations were 1.2, 2.5, and 5 μmol/L) for 48 hours. Data represent mean ± SEM of three independent experiments. J, Immunoblots of select proteins in prostate cancer cells treated with increasing doses of BAY1895344, VX-970, or olaparib (concentrations ranging from 0.125 to 2 μmol/L). K–N, RT-qPCR analysis of CCL5 and CXCL10 in prostate cancer cells treated with DMSO (vehicle control), BAY1895344, VX-970, or olaparib (concentrations ranging from 0.5 to 2 μmol/L). O and P, RT-qPCR analysis of CCL5 and CXCL10 in RM-1-BM or C4–2b prostate cancer cells in response to BAY1895344 (2 μmol/L) or DMSO (vehicle control) following knockdown of cGAS, STING, TBK1, or IRF3 gene expression in vitro via transfection with control siRNA or gene-specific siRNA (sicGAS, siSTING, siTBK1, or siIRF3). n.s., not significant; * P < 0.05; **, P < 0.01; ***, P < 0.001.
Figure 2. CDK1-SPOP-PD-L1 signaling is selectively activated by ATRi. A, RT-qPCR analysis showing that ATRi BAY1895344 (2 μmol/L) transcriptionally activates expression of PD-L1 mRNA through the cGAS–STING pathway. RM-9 and RM-1-BM prostate cancer cells were transfected with control siRNAs or gene-specific siRNAs (sicGAS, siSTING, siTBK1, or siIRF3), and cells were treated with DMSO or BAY1895344 (2 μmol/L) for 48 hours before total RNAs were extracted for RT-qPCR analysis of PD-L1 mRNA expression. B, Immunoblot analysis to show PD-L1 protein expression in RM-9 or RM-1-BM cells following BAY1895344 or olaparib (OLA) treatment (2 μmol/L for 24 and 48 hours). C, Immunoblot analysis of protein expression of PD-L1 and phosphorylated ATR in human (C4–2b and PC-3) and mouse (RM-9 and RM-1-BM) prostate cancer cells treated with BAY1895344 (2 μmol/L for 24 hours), or concomitant treatment with BAY1895344 and the proteasome inhibitor bortezomib (PS-341, 0.5 μmol/L for 8 hours). D and E, Cycloheximide (CHX)-chase protein half-life analysis to examine the degradation of PD-L1 protein affected by BAY1895344 and olaparib in RM-1-BM prostate cancer cells. RM-1-BM cells were pretreated with DMSO (vehicle control), BAY1895344 (2 μmol/L), or olaparib (2 μmol/L) for 36 hours before treatment with CHX. Immunoblot analysis was used to determine the expression of PD-L1 protein expression and the autoradiographic bands were scanned, quantified by densitometer, and normalized (to the internal reference protein blot signals, vinculin protein, and plotted; in E). F, Immunoblot analysis to show dose-dependent CDK1 activation (dephosphorylation of p-Y15-CDK1 by ATRi BAY1895344 in doses ranging from 0.125 to 2 μmol/L) compared with CDK1 inhibition (increase in p-Y15-CDK1 by olaparib) resulting from inhibition of the cell-cycle kinase signaling cascade ATR-CHK1-CDC25C/WEE1-CDK1 in human (C4–2b and PC-3) and mouse (RM-1-BM) prostate cancer cells.
Figure 2.
CDK1-SPOP-PD-L1 signaling is selectively activated by ATRi. A, RT-qPCR analysis showing that ATRi BAY1895344 (2 μmol/L) transcriptionally activates expression of PD-L1 mRNA through the cGAS–STING pathway. RM-9 and RM-1-BM prostate cancer cells were transfected with control siRNAs or gene-specific siRNAs (sicGAS, siSTING, siTBK1, or siIRF3), and cells were treated with DMSO or BAY1895344 (2 μmol/L) for 48 hours before total RNAs were extracted for RT-qPCR analysis of PD-L1 mRNA expression. B, Immunoblot analysis to show PD-L1 protein expression in RM-9 or RM-1-BM cells following BAY1895344 or olaparib (OLA) treatment (2 μmol/L for 24 and 48 hours). C, Immunoblot analysis of protein expression of PD-L1 and phosphorylated ATR in human (C4–2b and PC-3) and mouse (RM-9 and RM-1-BM) prostate cancer cells treated with BAY1895344 (2 μmol/L for 24 hours), or concomitant treatment with BAY1895344 and the proteasome inhibitor bortezomib (PS-341, 0.5 μmol/L for 8 hours). D and E, Cycloheximide (CHX)-chase protein half-life analysis to examine the degradation of PD-L1 protein affected by BAY1895344 and olaparib in RM-1-BM prostate cancer cells. RM-1-BM cells were pretreated with DMSO (vehicle control), BAY1895344 (2 μmol/L), or olaparib (2 μmol/L) for 36 hours before treatment with CHX. Immunoblot analysis was used to determine the expression of PD-L1 protein expression and the autoradiographic bands were scanned, quantified by densitometer, and normalized (to the internal reference protein blot signals, vinculin protein, and plotted; in E). F, Immunoblot analysis to show dose-dependent CDK1 activation (dephosphorylation of p-Y15-CDK1 by ATRi BAY1895344 in doses ranging from 0.125 to 2 μmol/L) compared with CDK1 inhibition (increase in p-Y15-CDK1 by olaparib) resulting from inhibition of the cell-cycle kinase signaling cascade ATR-CHK1-CDC25C/WEE1-CDK1 in human (C4–2b and PC-3) and mouse (RM-1-BM) prostate cancer cells.
Figure 3. The CDK1–SPOP axis regulates PD-L1 protein levels. A, Immunoblot analysis to demonstrate that dose-dependent overexpression of HA-tagged CDK1 stabilizes SPOP and that overexpression of dominant negative inhibitor of the kinase activity of CDK1 (HA-tagged CDK1-DN) led to destabilization of SPOP expression in 293T cells. Specifically, 293T cells were cotransfected with Flag-tagged SPOP together with HA-tagged CDK1 or HA-tagged CDK1-DN expression vectors. After 48 hours, cells were lysed and immunoblot analysis was performed to analyze the expression of SPOP (anti-Flag). B, Protein half-life analysis for CDK1-targeted SPOP. 293T cells were cotransfected with expression vectors for Flag-tagged SPOP and empty vector (non-overexpression control) or HA-tagged CDK1. Thirty-six hours after transfection, CHX-chase assay was conducted, followed by immunoblot analysis of cell lysates. C, Autoradiographic bands from the immunoblots were scanned, quantified by densitometer, normalized (to the internal reference protein blot signals, vinculin protein), and plotted to show the increased half-life of SPOP with CDK1 overexpression (from ∼30 to over 60 minutes). D, Co-IP analysis to examine the protein–protein interaction of SPOP and CDK1 in vitro. 293T cells were cotransfected by SPOP, CDK1, or empty vector control. E, Knockdown of CDK1 with siRNA (siCDK1) downregulates SPOP expression and upregulates PD-L1 protein in C4–2b and RM-1-BM prostate cancer cells. F, Immunoblot analysis of lysates from RM-1-BM and C4–2b cells previously transfected with SPOP siRNA (siSPOP), showing that SPOP knockdown effectively stabilizes PD-L1 in these prostate cancer cells. G, Immunoblot analysis of PD-L1 protein expression in cell lysates from RM-1-BM and C4–2b cells pre-transfected with control siRNA (siCtrl, siRNA non-silencing transfection control) or siSPOP followed by treatment with BAY1895344 (0.5 and 2 μmol/L) showed that SPOP knockdown in C4–2b and RM-1-BM cells effectively prevents the degradation of PD-L1 caused by BAY1895344. n.s., not significant; *, P < 0.05; **, P < 0.01; ***, P < 0.001.
Figure 3.
The CDK1–SPOP axis regulates PD-L1 protein levels. A, Immunoblot analysis to demonstrate that dose-dependent overexpression of HA-tagged CDK1 stabilizes SPOP and that overexpression of dominant negative inhibitor of the kinase activity of CDK1 (HA-tagged CDK1-DN) led to destabilization of SPOP expression in 293T cells. Specifically, 293T cells were cotransfected with Flag-tagged SPOP together with HA-tagged CDK1 or HA-tagged CDK1-DN expression vectors. After 48 hours, cells were lysed and immunoblot analysis was performed to analyze the expression of SPOP (anti-Flag). B, Protein half-life analysis for CDK1-targeted SPOP. 293T cells were cotransfected with expression vectors for Flag-tagged SPOP and empty vector (non-overexpression control) or HA-tagged CDK1. Thirty-six hours after transfection, CHX-chase assay was conducted, followed by immunoblot analysis of cell lysates. C, Autoradiographic bands from the immunoblots were scanned, quantified by densitometer, normalized (to the internal reference protein blot signals, vinculin protein), and plotted to show the increased half-life of SPOP with CDK1 overexpression (from ∼30 to over 60 minutes). D, Co-IP analysis to examine the protein–protein interaction of SPOP and CDK1 in vitro. 293T cells were cotransfected by SPOP, CDK1, or empty vector control. E, Knockdown of CDK1 with siRNA (siCDK1) downregulates SPOP expression and upregulates PD-L1 protein in C4–2b and RM-1-BM prostate cancer cells. F, Immunoblot analysis of lysates from RM-1-BM and C4–2b cells previously transfected with SPOP siRNA (siSPOP), showing that SPOP knockdown effectively stabilizes PD-L1 in these prostate cancer cells. G, Immunoblot analysis of PD-L1 protein expression in cell lysates from RM-1-BM and C4–2b cells pre-transfected with control siRNA (siCtrl, siRNA non-silencing transfection control) or siSPOP followed by treatment with BAY1895344 (0.5 and 2 μmol/L) showed that SPOP knockdown in C4–2b and RM-1-BM cells effectively prevents the degradation of PD-L1 caused by BAY1895344. n.s., not significant; *, P < 0.05; **, P < 0.01; ***, P < 0.001.
Figure 4. Interaction between PD-L1 and tumor cell–intrinsic IFN-β cytotoxic signaling. A, RT-qPCR of IFN-β expression in cells treated with DMSO vehicle control, BAY1895344 (BAY; 0.5 and 2 μmol/L), or olaparib (OLA; 0.5 and 2 μmol/L) in human and mouse prostate cancer cells. B, ELISA assay to detect the IFN-β protein secreted by C4–2b and RM-1-BM cancer cells following treatment with BAY1895344 (2 and 4 μmol/L) or olaparib (5 and 10 μmol/L) in vitro (36 hours). n.s., not significant; *, P < 0.05; **, P < 0.01; ***, P < 0.001. C, MTS assay of human prostate cancer cells (top) and mouse prostate cancer cells (bottom) treated with BAY1895344 or olaparib in the absence or presence of mouse or human recombinant IFN-β (100 U/mL). Separate prostate cancer cell cultures treated with BAY1895344 (2 μmol/L) or olaparib (5 μmol/L) in the presence of recombinant IFN-β were also treated with IFN-β–neutralizing antibody. After these treatments, viable cells were determined by MTS assays. n.s., not significant; *, P < 0.05; **, P < 0.01; ***, P < 0.001. D, Immunoblot analysis showed greater induction of IFN-β–induced cytotoxic signaling through IFN-β-JAK1-STAT3–caspase 7 cascade following treatment with BAY1895344 than olaparib (42). E, BAY1895344 treatment (0.5 and 2 μmol/L) led to a dose-dependent induction of cGAS mRNA (RT-PCR) in C4–2b and RM-1-BM prostate cancer cells, whereas olaparib treatment (0.5 and 2 μmol/L) led to increased cGAS mRNA in C4–2b to a lesser extent than ATRi and did not induce cGAS mRNA in RM-1-BM.
Figure 4.
Interaction between PD-L1 and tumor cell–intrinsic IFN-β cytotoxic signaling. A, RT-qPCR of IFN-β expression in cells treated with DMSO vehicle control, BAY1895344 (BAY; 0.5 and 2 μmol/L), or olaparib (OLA; 0.5 and 2 μmol/L) in human and mouse prostate cancer cells. B, ELISA assay to detect the IFN-β protein secreted by C4–2b and RM-1-BM cancer cells following treatment with BAY1895344 (2 and 4 μmol/L) or olaparib (5 and 10 μmol/L) in vitro (36 hours). n.s., not significant; *, P < 0.05; **, P < 0.01; ***, P < 0.001. C, MTS assay of human prostate cancer cells (top) and mouse prostate cancer cells (bottom) treated with BAY1895344 or olaparib in the absence or presence of mouse or human recombinant IFN-β (100 U/mL). Separate prostate cancer cell cultures treated with BAY1895344 (2 μmol/L) or olaparib (5 μmol/L) in the presence of recombinant IFN-β were also treated with IFN-β–neutralizing antibody. After these treatments, viable cells were determined by MTS assays. n.s., not significant; *, P < 0.05; **, P < 0.01; ***, P < 0.001. D, Immunoblot analysis showed greater induction of IFN-β–induced cytotoxic signaling through IFN-β-JAK1-STAT3–caspase 7 cascade following treatment with BAY1895344 than olaparib (42). E, BAY1895344 treatment (0.5 and 2 μmol/L) led to a dose-dependent induction of cGAS mRNA (RT-PCR) in C4–2b and RM-1-BM prostate cancer cells, whereas olaparib treatment (0.5 and 2 μmol/L) led to increased cGAS mRNA in C4–2b to a lesser extent than ATRi and did not induce cGAS mRNA in RM-1-BM.
Figure 5. PD-L1 knockdown sustains IFNAR1–JAK1–STAT3–cleaved caspase 7 signaling following olaparib treatment. A, Immunoblotting analysis shows that PD-L1 knockdown by siRNA effectively sustains the JAK1–STAT3–caspase 7 apoptotic signaling cascade, including p-STAT3, p-STAT1, and cleaved caspase 7, following olaparib (2 μmol/L) treatment in C4–2b and RM-1-BM cells. Immunoblotting also demonstrated that sequential siPD-L1 and olaparib treatment maintained induction of cGAS protein levels in these cells. B, RT-qPCR analysis demonstrated that siPD-L1 treatment led to increased cGAS mRNA levels following olaparib treatment in C4–2b and RM-1-BM cells. C, Immunostaining analysis of cleaved caspase 7 (Asp198) also showed that siPD-L1 resulted in significant upregulation of caspase 7 following olaparib in C4–2b and RM-1-BM cells. D, Image analysis demonstrated that the numbers of caspase 7–positive cells were significantly higher in C4–2b and RM-1-BM cells that were treated with siPD-L1 before olaparib treatment compared with olaparib treatment alone. n.s., not significant; *, P < 0.05; **, P < 0.01; ***, P < 0.001.
Figure 5.
PD-L1 knockdown sustains IFNAR1–JAK1–STAT3–cleaved caspase 7 signaling following olaparib treatment. A, Immunoblotting analysis shows that PD-L1 knockdown by siRNA effectively sustains the JAK1–STAT3–caspase 7 apoptotic signaling cascade, including p-STAT3, p-STAT1, and cleaved caspase 7, following olaparib (2 μmol/L) treatment in C4–2b and RM-1-BM cells. Immunoblotting also demonstrated that sequential siPD-L1 and olaparib treatment maintained induction of cGAS protein levels in these cells. B, RT-qPCR analysis demonstrated that siPD-L1 treatment led to increased cGAS mRNA levels following olaparib treatment in C4–2b and RM-1-BM cells. C, Immunostaining analysis of cleaved caspase 7 (Asp198) also showed that siPD-L1 resulted in significant upregulation of caspase 7 following olaparib in C4–2b and RM-1-BM cells. D, Image analysis demonstrated that the numbers of caspase 7–positive cells were significantly higher in C4–2b and RM-1-BM cells that were treated with siPD-L1 before olaparib treatment compared with olaparib treatment alone. n.s., not significant; *, P < 0.05; **, P < 0.01; ***, P < 0.001.
Figure 6. ATRi is synergistic with anti–PD-L1 in a syngeneic mouse prostate cancer model. A, RM-1-BM subcutaneous tumor volume (growth), and (B) wet weight (fold-change relative to vehicle control) at the study termination of vehicle control, IgG, BAY1895344, anti–PD-L1, and BAY1895344+anti–PD-L1 treatment. C, Tumor volume during vehicle control, BAY1895344, anti–PD-L1, and BAY1895344+anti–PD-L1 treatment, administered together with IgG or anti-CD8. D, RT-qPCR analysis of IFN-β, CCL5, and CXCL10 mRNA from tumor samples following treatments described previously in A and B. E, ELISA analysis of IFN-β from tumor samples following treatments described previously in A and B. F, Survival curve of mice treated with vehicle control, IgG, anti–PD-L1, BAY1895344, or BAY1895344+anti–PD-L1. *, P < 0.05; **, P < 0.01; ***, P < 0.001. P values determined by the Mantel–Cox test. ⁁, indicates that the combination treatment revealed a synergistic interaction between ATRi and anti–PD-L1 by Bliss independence analysis. G, Selective markers were used to define cell types in the data using Garnett, which include endothelial cells, epithelial (predominantly tumor) cells, macrophages, and T cells. H, GSEA for BAY1895344+anti–PD-L1 treatment versus BAY1895344 or anti–PD-L1 single-agent treatment in epithelial cell cluster. I, Conceptual mechanistic model for ATRi-mediated intrinsic cytotoxicity driven by activation of the CDK1–SPOP axis, suppression of PD-L1 levels through SPOP destabilization, and derepression of intrinsic IFN-β–driven apoptosis. Degradation of PD-L1 through the CDK1–SPOP axis activity leads to derepression of an IFN-β-IFNAR1-driven, STAT3–caspase 7 autocrine, cytotoxic signaling pathway (42). ATRi-mediated induction of cGAS mRNA through IFN-β–IFNAR1 signaling (45) completes a feed-forward loop.
Figure 6.
ATRi is synergistic with anti–PD-L1 in a syngeneic mouse prostate cancer model. A, RM-1-BM subcutaneous tumor volume (growth), and (B) wet weight (fold-change relative to vehicle control) at the study termination of vehicle control, IgG, BAY1895344, anti–PD-L1, and BAY1895344+anti–PD-L1 treatment. C, Tumor volume during vehicle control, BAY1895344, anti–PD-L1, and BAY1895344+anti–PD-L1 treatment, administered together with IgG or anti-CD8. D, RT-qPCR analysis of IFN-β, CCL5, and CXCL10 mRNA from tumor samples following treatments described previously in A and B. E, ELISA analysis of IFN-β from tumor samples following treatments described previously in A and B. F, Survival curve of mice treated with vehicle control, IgG, anti–PD-L1, BAY1895344, or BAY1895344+anti–PD-L1. *, P < 0.05; **, P < 0.01; ***, P < 0.001. P values determined by the Mantel–Cox test. ⁁, indicates that the combination treatment revealed a synergistic interaction between ATRi and anti–PD-L1 by Bliss independence analysis. G, Selective markers were used to define cell types in the data using Garnett, which include endothelial cells, epithelial (predominantly tumor) cells, macrophages, and T cells. H, GSEA for BAY1895344+anti–PD-L1 treatment versus BAY1895344 or anti–PD-L1 single-agent treatment in epithelial cell cluster. I, Conceptual mechanistic model for ATRi-mediated intrinsic cytotoxicity driven by activation of the CDK1–SPOP axis, suppression of PD-L1 levels through SPOP destabilization, and derepression of intrinsic IFN-β–driven apoptosis. Degradation of PD-L1 through the CDK1–SPOP axis activity leads to derepression of an IFN-β-IFNAR1-driven, STAT3–caspase 7 autocrine, cytotoxic signaling pathway (42). ATRi-mediated induction of cGAS mRNA through IFN-β–IFNAR1 signaling (45) completes a feed-forward loop.

References

    1. Beer TM, Kwon ED, Drake CG, Fizazi K, Logothetis C, Gravis G, et al. Randomized, double-blind, phase III trial of ipilimumab versus placebo in asymptomatic or minimally symptomatic patients with metastatic chemotherapy-naive castration-resistant prostate cancer. J Clin Oncol 2017;35:40–7. - PubMed
    1. Karzai F, VanderWeele D, Madan RA, Owens H, Cordes LM, Hankin A, et al. Activity of durvalumab plus olaparib in metastatic castration-resistant prostate cancer in men with and without DNA damage repair mutations. J Immunother Cancer 2018;6:141. - PMC - PubMed
    1. Robinson D, Van Allen EM, Wu YM, Schultz N, Lonigro RJ, Mosquera JM, et al. Integrative clinical genomics of advanced prostate cancer. Cell 2015;162:454. - PubMed
    1. Subudhi SK, Vence L, Zhao H, Blando J, Yadav SS, Xiong Q, et al. Neoantigen responses, immune correlates, and favorable outcomes after ipilimumab treatment of patients with prostate cancer. Sci Transl Med 2020;12:eaaz3577. - PubMed
    1. Topalian SL, Hodi FS, Brahmer JR, Gettinger SN, Smith DC, McDermott DF, et al. Safety, activity, and immune correlates of anti–PD-1 antibody in cancer. N Engl J Med 2012;366:2443–54. - PMC - PubMed

Publication types

MeSH terms