Comparative Study
. 2021 Jun 24;12(7):647.
doi: 10.1038/s41419-021-03927-x.

Marizomib sensitizes primary glioma cells to apoptosis induced by a latest-generation TRAIL receptor agonist

Affiliations
Comparative Study

Marizomib sensitizes primary glioma cells to apoptosis induced by a latest-generation TRAIL receptor agonist

Chiara Boccellato et al. Cell Death Dis. .

Abstract

Due to the absence of curative treatments for glioblastoma (GBM), we assessed the efficacy of single and combination treatments with a translationally relevant 2nd generation TRAIL-receptor agonist (IZI1551) and the blood-brain barrier (BBB) permeant proteasome inhibitor marizomib in a panel of patient-derived glioblastoma cell lines. These cells were cultured using protocols that maintain the characteristics of primary tumor cells. IZI1551+marizomib combination treatments synergistically induced apoptotic cell death in the majority of cases, both in 2D, as well as in 3D spheroid cultures. In contrast, single-drug treatments largely failed to induce noticeable amounts of cell death. Kinetic analyses suggested that time-shifted drug exposure might further increase responsiveness, with marizomib pre-treatments indeed strongly enhancing cell death. Cell death responses upon the addition of IZI1551 could also be observed in GBM cells that were kept in a medium collected from the basolateral side of a human hCMEC/D3 BBB model that had been exposed to marizomib. Interestingly, the subset of GBM cell lines resistant to IZI1551+marizomib treatments expressed lower surface amounts of TRAIL death receptors, substantially lower amounts of procaspase-8, and increased amounts of cFLIP, suggesting that apoptosis initiation was likely too weak to initiate downstream apoptosis execution. Indeed, experiments in which the mitochondrial apoptosis threshold was lowered by antagonizing Mcl-1 re-established sensitivity to IZI1551+marizomib in otherwise resistant cells. Overall, our study demonstrates a high efficacy of combination treatments with a latest-generation TRAIL receptor agonist and the BBB permeant proteasome inhibitor marizomib in relevant GBM cell models, as well as strategies to further enhance responsiveness and to sensitize subgroups of otherwise resistant GBM cases.


Conflict of interest statement

The authors declare no competing interests.

Figures
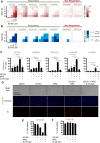
Fig. 1
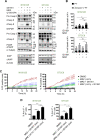
Fig. 1. Most patient-derived glioblastoma cells respond to combination treatment with a 2nd generation TRAIL receptor agonist and marizomib.
A Cells were cultivated in 2D and stimulated with the indicated concentrations of IZI1551 and marizomib for 24 h. Cell viability was assessed by WST-1 cell proliferation assay. Data are mean values from three independent experiments. SEMs across the repeat experiments and conditions were <20%. B Synergy scores of drug combinations were determined by calculating Webb’s fractional product. C Glioblastoma cells were treated for 24 h with IZI1551 (1 nM), marizomib (80 nM), or with the combination thereof in the presence or absence of the pan-caspase inhibitor Q-VD-Oph (50 μM). Cell death was measured by Annexin V/PI-based flow cytometry. Data represent mean ± SEM from three independent experiments. **p ≤ 0.01; ***p ≤ 0.001 ****p ≤ 0.0001; one-way ANOVA followed by Tukey post hoc test. D Representative micrographs of N160125 cells after 24 h of treatment as in C. Nuclei were stained with Hoechst and PI. Nuclear condensation and membrane blebbing indicate apoptotic cell death. E, F Long-term proliferation capacity was tested in responder and non-responder cell lines treated for 24 h as in C. Viability signals of survivor populations were measured after 6 days of recovery by WST-1 assays. Bar graphs show the mean ± range of two independent experiments per cell line.
Fig. 2
Fig. 2. IZI1551+marizomib co-treatments are effective in 3D tumor cell spheroid models.
A Cell lines were cultivated as a 3D spheroid and stimulated with the indicated concentrations of IZI1551 and marizomib for 24 h. Cell viability was assessed by WST-1 assays. Data are mean values from three independent experiments. SEMs across the repeat experiments and conditions were <20%. B Synergy scores of drug combinations were determined by calculating Webb’s fractional product. C Spheroids were treated with IZI1551 (1 nM) or marizomib (80 nM) or a combination of both in the presence or absence of the pan-caspase inhibitor Q-VD-Oph (50 μM). Cell death was measured by Annexin V/PI-based flow cytometry. Data represent mean ± SEM from three independent experiments. *p ≤ 0.05; **p ≤ 0.01; ***p ≤ 0.001 ****p ≤ 0.0001; one-way ANOVA followed by Tukey post hoc test.
Fig. 3
Fig. 3. Marizomib pre-treatment accelerates and enhances IZI1551-induced cell death.
A Caspase processing and caspase substrate cleavage in responder cell lines at early times. Cells were treated for 4 h with IZI1551 (1 nM) or marizomib (80 nM) or a combination of both in the presence or absence of Q-VD-Oph (50 µM). Whole-cell lysates were analyzed for the indicated proteins by western blotting. GAPDH, α-Tubulin, or β-Actin served as loading controls. Similar results were obtained in independent repeat experiments. c, cleaved. B Early cell death responses measured by Annexin V/PI-based flow cytometry. Cells were treated as in A. Data represent mean ± SEM from three independent experiments. *p ≤ 0.05; **p ≤ 0.01. ns = non-significant; one-way ANOVA followed by Tukey post hoc test. C Quantification of cell death kinetics, calculated as a percentage of PI-positive cell areas. Cells were co-treated with IZI1551 (1 nM) and marizomib (80 nM) simultaneously or pre-treated with marizomib for 24 h (MRZ −24 h) before the addition of IZI1551. Representative results from one out of 3 independent experiments are shown. Error bars represent the SD of 3 technical replicates. D Annexin V/PI-based flow cytometry of cells co-treated with reduced concentrations of IZI1551 (100 pM) and marizomib (40 nM). Data represent mean ± SEM from three independent experiments. *p ≤ 0.05; **p ≤ 0.01; ***p ≤ 0.001; ****p ≤ 0.0001; ns = not significant; one-way ANOVA followed by Tukey post hoc test.
Fig. 4
Fig. 4. Marizomib sufficiently penetrated a human BBB model to sensitize GBM cells to IZI1551-induced cell death.
A Human BBB cells hCMEC/D3 were tested for their responsiveness to marizomib (40 nM (low); 80 nM) by Annexin V/PI-based flow cytometry. Data represent mean ± SEM from three independent experiments. *p ≤ 0.05; ns, not significant; one-way ANOVA followed by Tukey post hoc test. B TEER was measured for 5 days following 24 h of growth of hCMEC/D3 on culture inserts. On the 5th day, 40 nM marizomib was added and the TEER was monitored for an additional 24 h. Data represent mean ± range of n = 2 measurements. C Cell death in N160125 cells measured by Annexin V/PI-based flow cytometry. Where indicated, cells were pre-treated with marizomib (40 nM) directly or with medium from the basolateral side of an hCMEC/D3 BBB (40 nM marizomib on the apical side for 24 h). Data represent mean ± SD of three technical replicates ***p ≤ 0.001; ****p ≤ 0.0001; one-way ANOVA followed by Tukey post hoc test.
Fig. 5
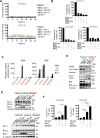
Fig. 5. Non-responders can be sensitized to IZI1551-induced cell death by Mcl-1 antagonism.
A Quantification of cell death kinetics, calculated as a percentage of PI-positive cell areas. Cells were co-treated with IZI1551 (1 nM) and marizomib (80 nM) simultaneously or pre-treated with marizomib for 24 h (MRZ −24 h) before the addition of IZI1551. Representative results from one out of 3 independent experiments are shown. Error bars represent the SD of 3 technical replicates. B Marizomib inhibited proteasome activities both in responder and non-responder cell lines. Cells were treated with 40 nM (low) or 80 nM of marizomib or bortezomib for 4 h and CT-L activities of the proteasomes were measured from total cell lysates by cleavage of Suc-LLVY-AMC. Bars indicate % of activity related to untreated controls. Data are shown as mean ± range of n = 2 measurements. C Surface expression of death receptors DR4 and DR5 in responsive and resistant cell lines. Cells were treated with marizomib (80 nM) and surface amounts were determined by flow cytometric measurements. Data show mean plus range. Similar results were obtained in independent repeat experiments. D Procaspase-8; FADD; FLIP and BID proteins are detected at different expression levels in responsive and resistant cells. Cells were treated with marizomib and the indicated proteins were detected in whole-cell lysates. Vinculin served as a loading control. Similar results were obtained in independent repeat experiments. E Anti-apoptotic Bcl-2 family proteins were detected in different cell lines. Cells were treated with marizomib (80 nM) and the indicated proteins were detected in whole-cell lysates. Vinculin or α-Tubulin served as loading controls. Similar results were obtained in independent repeat experiments. F Annexin V/PI-based flow cytometry of cells treated with 10 μM of S63845; 1 nM IZI1551 plus 80 nM MRZ or the combination thereof for 24 h. Data represent mean ± SEM of three independent experiments. *p ≤ 0.05; **p ≤ 0.01; ****p ≤ 0.0001; one-way ANOVA followed by Tukey post hoc test.

References

    1. Wasserfallen JB, Ostermann S, Leyvraz S, Stupp R. Cost of temozolomide therapy and global care for recurrent malignant gliomas followed until death. Neuro-Oncol. 2005;7:189–95. doi: 10.1215/S1152851704000687. - DOI - PMC - PubMed
    1. Koshy M, Villano JL, Dolecek TA, Howard A, Mahmood U, Chmura SJ, et al. Improved survival time trends for glioblastoma using the SEER 17 population-based registries. J Neurooncol. 2012;107:207–12. doi: 10.1007/s11060-011-0738-7. - DOI - PMC - PubMed
    1. Tan AC, Ashley DM, Lopez GY, Malinzak M, Friedman HS, Khasraw M. Management of glioblastoma: state of the art and future directions. CA Cancer J Clin. 2020;70:299–312. doi: 10.3322/caac.21613. - DOI - PubMed
    1. Balvers RK, Kleijn A, Kloezeman JJ, French PJ, Kremer A, van den Bent MJ, et al. Serum-free culture success of glial tumors is related to specific molecular profiles and expression of extracellular matrix-associated gene modules. Neuro-Oncol. 2013;15:1684–95. doi: 10.1093/neuonc/not116. - DOI - PMC - PubMed
    1. Lee J, Kotliarova S, Kotliarov Y, Li A, Su Q, Donin NM, et al. Tumor stem cells derived from glioblastomas cultured in bFGF and EGF more closely mirror the phenotype and genotype of primary tumors than do serum-cultured cell lines. Cancer Cell. 2006;9:391–403. doi: 10.1016/j.ccr.2006.03.030. - DOI - PubMed

Publication types

MeSH terms