. 2021 Jun 24;12(1):3928.
doi: 10.1038/s41467-021-24215-4.

Thbs1 induces lethal cardiac atrophy through PERK-ATF4 regulated autophagy

Affiliations

Thbs1 induces lethal cardiac atrophy through PERK-ATF4 regulated autophagy

Davy Vanhoutte et al. Nat Commun. .

Abstract

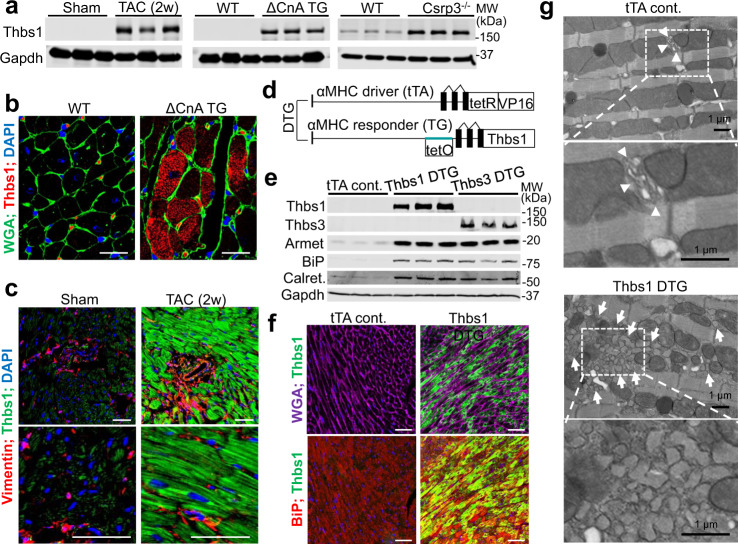
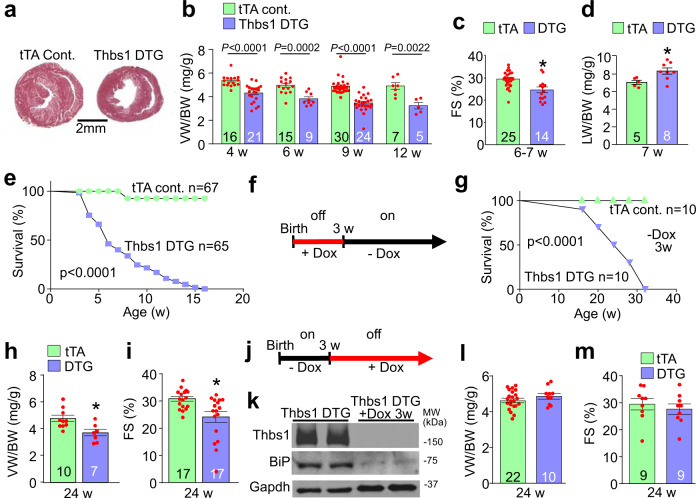
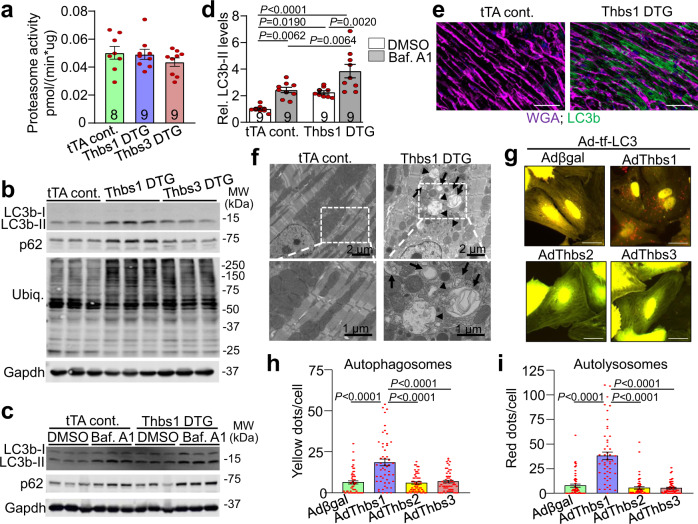
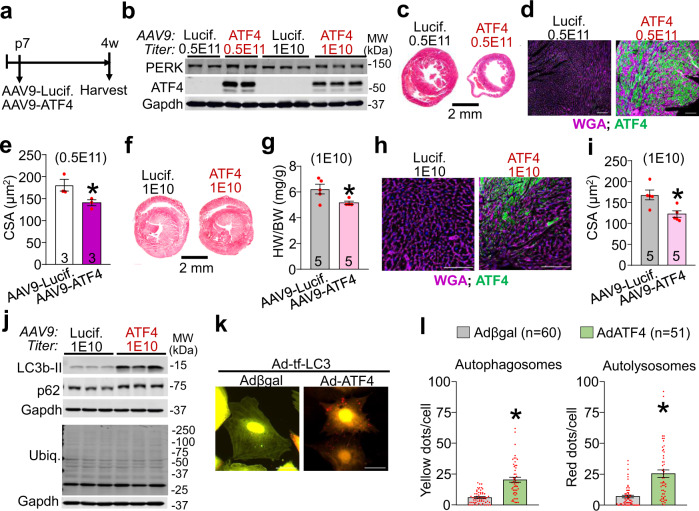
The thrombospondin (Thbs) family of secreted matricellular proteins are stress- and injury-induced mediators of cellular attachment dynamics and extracellular matrix protein production. Here we show that Thbs1, but not Thbs2, Thbs3 or Thbs4, induces lethal cardiac atrophy when overexpressed. Mechanistically, Thbs1 binds and activates the endoplasmic reticulum stress effector PERK, inducing its downstream transcription factor ATF4 and causing lethal autophagy-mediated cardiac atrophy. Antithetically, Thbs1-/- mice develop greater cardiac hypertrophy with pressure overload stimulation and show reduced fasting-induced atrophy. Deletion of Thbs1 effectors/receptors, including ATF6α, CD36 or CD47 does not diminish Thbs1-dependent cardiac atrophy. However, deletion of the gene encoding PERK in Thbs1 transgenic mice blunts the induction of ATF4 and autophagy, and largely corrects the lethal cardiac atrophy. Finally, overexpression of PERK or ATF4 using AAV9 gene-transfer similarly promotes cardiac atrophy and lethality. Hence, we identified Thbs1-mediated PERK-eIF2α-ATF4-induced autophagy as a critical regulator of cardiomyocyte size in the stressed heart.


Conflict of interest statement

The authors declare no competing interests.

Figures

Fig. 1
Fig. 1. Expression of Thbs1 is induced in diseased hearts where it mediates ER stress.
a Western blotting for Thbs1 in heart tissue of mice (8–10 weeks of age) subjected to 2 weeks of TAC, that contained the activated calcineurin A transgene (ΔCnA), or are Csrp3−/−, compared to sham-operated or wild-type (WT) control. Gapdh is shown as a processing and loading control. b Representative immunohistochemistry for endogenous Thbs1 (red) and cell outlines with wheat germ agglutinin (WGA)-FITC (green) with DAPI-stained nuclei (blue) from hypertrophic ΔCnA transgenic and WT control hearts at 8 weeks of age. Scale bars are 10 μm. c Immunohistochemistry for Thbs1 protein (green), vimentin (red) from sham or TAC-operated hearts, 2 weeks later. Scale bars are 50 μm. Nuclei are shown in blue with DAPI. d Schematic diagram depicting the inducible double transgenic (DTG) tetracycline-repressor system for inducible overexpression of Thbs1 in the heart. e Representative Western blots for Thbs1, Thbs3, Armet, BiP, calreticulin (calret.), and Gapdh as a loading control from hearts of tTA cont., Thbs1 DTG, and Thbs3 DTG mice at 6 weeks of age. f Representative immunohistochemistry broken into 2 channels each for overexpressed Thbs1 (green) with WGA-labeled membranes (purple), DAPI for nuclei (blue) and BiP (red) to show ER and the vesicular compartment in Thbs1 DTG hearts at 8 weeks of age. Scale bars are 50 μm. g Representative images of transmission electron microscopy of heart sections from tTA cont. and Thbs1 DTG mice at 6 weeks of age. Upper panels: arrowheads indicate ER in tTA cont., white arrows show expanded ER and vesicles only in Thbs1 DTG hearts. Lower panels: enlargement of white dotted boxed area from upper panels. Scale bars are 1 μm. Source data are provided as a Source Data File.
Fig. 2
Fig. 2. Cardiomyocyte-specific overexpression of Thbs1 induces lethal cardiac atrophy.
a Low magnification images of tTA cont. and Thbs1 DTG whole mount cardiac histological sections stained with Masson’s trichrome at 6 weeks of age. Scale bar is 2 mm. b Ventricular weight-to-body weight (VW/BW) ratio at the indicated time points in tTA cont. and Thbs1 DTG mice. P-values are shown in the graph. c Echocardiography measured fractional shortening (FS) percentage in the two groups of mice at 6–7 weeks (w) of age. *P = 0.0007 vs tTA cont. d Pulmonary edema was analyzed by lung weight-to-body weight (LW/BW) ratios in the indicated groups of mice at 7 weeks of age. *P = 0.0231 vs tTA cont. e Kaplan–Meier survival plot of tTA cont. and Thbs1 DTG animals with continuous Thbs1 expression (never Dox; P < 0.0001 vs tTA cont.). f Experimental regimen of early Dox administration to inhibit Thbs1 transgene expression during embryonic and early postnatal development in Thbs1 DTG animals (Dox was removed at 3w of age). g Kaplan–Meier survival plot of tTA cont. and Thbs1 DTG mice treated with Dox as shown in panel “f” (P < 0.0001 vs tTA cont.). h VW/BW ratio and i FS percentage at 24 weeks of age given the treatment regimen shown in panel “f”. *P = 0.0073 vs tTA cont. for “h” and *P = 0.0039 vs tTA cont. for “i”. j Schematic diagram for administration of Dox beginning at 3 weeks of age to shut down Thbs1 expression thereafter (Dox was given at 3w and beyond). k Representative Western blots of protein extracts from hearts of Thbs1 DTG mice at 8 weeks of age in Thbs1 DTG mice as shown in panel “j”, assayed for Thbs1, BiP, and Gapdh as a loading control. l VW/BW ratio and m FS percentage at 24 weeks of age in the mice treated as shown in panel “j”. The number of biologically independent animals analyzed is indicated on each graph. Statistical analysis was performed using two-tailed Student’s t test (bd, h, i, l, m), or survival analysis by two-tailed log-rank test (e, g). Error bars are ±standard error of the mean. Source data are provided as a Source Data File.
Fig. 3
Fig. 3. Endothelial cells and TGFβ are not affected by cardiac Thbs1 overexpression.
a Quantification of capillary number per mm2 of tissue from histological sections of tTA cont. and Thbs1 DTG hearts stained with isolectin B4 at 6 weeks of age. b Quantification of endothelial cell proliferation as measured by EdU incorporation co-labeled with CD31 in tTA cont. and Thbs1 DTG hearts at 6 weeks of age. c Quantification of endothelial cell apoptosis detected by TUNEL staining co-labeled with isolectin B4 in tTA cont. and Thbs1 DTG hearts at 6 weeks of age. d ELISA-based quantification of total TGFβ and e active TGFβ in protein extracts from tTA cont. or Thbs1 DTG hearts at 6 weeks of age. f Schematic diagram of WT Thbs1 domain structure and the Thbs1Δt1 mutant lacking the Thbs1 type-1 repeat domain region. g Representative western blot analysis for Thbs1 from total protein extracts (Total) and extracellular matrix (ECM) extracts from hearts of tTA cont., Thbs1 DTG, and Thbs1 DTG Δt1 mice at 4 weeks of age. Vinculin is presented as cytosolic control. Coomassie stained (Coom.) gel is shown as loading control. h VW/BW ratio at 4 weeks of age in the indicated groups of mice. *P < 0.0001 versus tTA cont.; statistical analysis was performed using one-way ANOVA and Tukey multiple comparisons test. i Kaplan–Meier survival plot of tTA cont., Thbs1 DTG, and Thbs1Δt1 DTG animals. *P < 0.0001 vs tTA cont. #P < 0.0001 vs Thbs1 DTG; both analyzed by two-tailed log-rank test. The same data from Fig. 2e are shown again here for tTA cont. and Thbs1 DTG mice (same strain and ages and sex ratio mix). j Representative western blots for Thbs2 and Gapdh as loading control, from heart protein extracts from tTA cont. and Thbs2 DTG mice at 8 weeks of age. k Heart weight (HW)/BW ratio, and l FS percentage at 8 weeks of age from tTA cont. and Thbs2 DTG mice. The number of biologically independent animals analyzed is indicated on each graph. Error bars are ±standard error of the mean. Source data are provided as a Source Data File.
Fig. 4
Fig. 4. Thbs1 binds and activates a PERK-mediated ER stress response.
a Representative western blots for ATF6α-N (50 kDa, nuclear), phospho-IRE1α (Ser 724; arrowhead), total IRE1α, phospho- and total PERK, phospho-eIF2α (Ser 51), total-eIF2α, ATF4, and DNAJC3. Phospho-PERK was analyzed using Phos-tag gels. The heart protein extracts are from the indicated mice at 4 weeks of age. Gapdh serves as a processing and loading control. b, c Western blot for Thbs1 and PERK following immunoprecipitation (IP) of PERK (b) or Thbs1 (c) from protein extracts of tTA cont. and Thbs1 DTG hearts at 6 weeks of age. IPs with corresponding IgG served as negative controls. Vinculin is an input loading control. d Schematic diagram of Thbs1 with the GST-Thbs1 fusion proteins regions shown (red bars). Below the schematic a representative western blot for PERK following GST pull-down with the different Thbs1 domains from primary neonatal rat ventricular cardiomyocyte extracts. GST protein serves as a negative control. e-i, Quantitative RT-PCR for Eif2ak3 (PERK protein; *P = 0.0317 vs tTA control), Atf4 (*P = 0.0006 vs tTA control), Atf3 (*P = 0.0058 vs tTA control), Ddit3 (Chop protein; *P < 0.0001 vs tTA control)) and Fgf21 (*P = 0.0023 vs tTA control) from mRNA isolated from hearts of tTA cont. (n = 6 biologically independent animals) and Thbs1 DTG mice (n = 5 biologically independent animals) at 6 weeks of age. Statistical analysis was performed using two-tailed Student’s t test. Error bars are ±standard error of the mean. Source data are provided as a Source Data File.
Fig. 5
Fig. 5. Thbs1 induces autophagy and lysosomal protein degradation.
a 20S chymotrypsin-like proteasome activity measured in heart tissue of tTA cont., Thbs1 DTG, and Thbs3 DTG mice at 4 weeks of age. b Representative western blots for LC3b, p62, ubiquitin-conjugated proteins (Ubiq.), and Gapdh as loading control from hearts of tTA cont., Thbs1 DTG, and Thbs3 DTG mice at 4 weeks of age. c Representative western blots for LC3b, p62, and Gapdh as loading control from hearts of tTA cont., Thbs1 DTG treated with dimethyl sulfoxide (DMSO) as vehicle or bafilomycin A1 (Baf. A1) to inhibit autolysosome degradation at 6 weeks of age. d Quantitative analysis of LC3b-II protein levels relative to Gapdh from the experiment shown in “c”. Analysis of p62 protein levels is shown in Supplementary Fig. 3c. Data are represented as fold change compared to tTA cont. with DMSO. e Representative immunohistochemistry for LC3b protein (green) and WGA (purple) from heart sections of tTA cont. and Thbs1 DTG mice at 8 weeks of age. Scale bars are 50 μm. f Representative transmission electron microscopy of Thbs1 DTG and tTA cont. heart sections at 6 weeks of age. Autophagosomes (arrow) appear as double-membrane vesicles while autolysosomes are single membrane structures (arrowheads). Lower panels are enlargements of white dotted boxed area from upper panels. Scale bars are 2 μm and 1 μm, respectively. gi Representative micrographs of fluorescent LC3 puncta (g) and quantification thereof (h, i) in cultured primary neonatal rat ventricular myocytes 48 h after infection with indicated adenoviruses to overexpress tandem mRFP-GFP-LC3 (Ad-tf-LC3) indicator with either Thbs1 (n = 51), Thbs2 (n = 57), Thbs3 (n = 57), or βgal control (n = 53). ‘N’ represents biologically independent cells; yellow dots represent autophagosomes, whereas free red dots indicated autolysosomes. Scale bars are 50 μm. The number of biologically independent animals analyzed for “a” and “d” is indicated on each graph. All statistical analysis were performed using one-way ANOVA and Tukey multiple comparisons test; error bars are ±standard error of the mean; P-values for panel d, h, i are shown in the graph. Source data are provided as a Source Data File.
Fig. 6
Fig. 6. Loss of Thbs1 augments hypertrophic growth and restricts atrophy in the heart.
a Low magnification images of wild type and Thbs1−/− whole mount cardiac histological sections stained with Hematoxylin & Eosin, 2 weeks after TAC surgery at 8 weeks of age. Scale bar is 1 mm. b HW/BW ratio and c FS percentage 2 weeks after TAC or sham surgery at 8 weeks of age. The number of biologically independent animals analyzed is indicated on the graphs for panels “bd”. dp Quantitative RT-PCR results for Eif2ak3 (PERK protein), Atf6, Ern1 (IRE1α protein), Manf (Armet protein), Hspa5 (BiP protein), Calr (Calreticulin protein), Atf4, Atf3, Fgf21, Map1lc3b (LC3b protein), Trim63 (MuRF1 protein), Fbxo32 (Atrogin-1 protein), and Trib3 mRNA isolated from hearts of wild type and Thbs1−/− mice, 2 weeks after TAC or sham surgery at 8 weeks of age. For panels “di”, n = 6 biologically independent samples per group; for panels “j and p”, n = 6 biologically independent samples for sham wild type and Thbs1−/− 2 weeks after TAC surgery, n = 5 biologically independent samples for sham Thbs1−/− and n = 9 biologically independent samples for wild-type 2 weeks after TAC surgery; for panels “ko”, n = 6 biologically independent samples for sham wild-type, sham Thbs1−/− and Thbs1−/− 2 weeks after TAC surgery and n = 9 biologically independent samples for wild-type 2 weeks after TAC surgery. Data are represented as fold expression over sham wild type. All statistical analysis was performed using one-way ANOVA and Tukey multiple comparisons test. P-values are shown in each graph. Error bars are ±standard error of the mean. Source data are provided as a Source Data File.
Fig. 7
Fig. 7. Thbs1 induces PERK/ATF4 to facilitate cardiac atrophy.
a Low magnification cardiac histological images from tTA cont. Eif2ak3fl/fl (PERK), tTA Eif2ak3fl/fl βMHC-Cre (Eif2ak3CKO), Thbs1 DTG Eif2ak3 fl/fl, and Thbs1 DTG Eif2ak3CKO mice stained with Masson’s trichrome at 8 weeks of age. Scale bar is 2 mm. b VW/BW ratio, c FS percentage and d LW/BW ratio at 8 weeks of age in the indicated groups of mice. The number of biologically independent animals analyzed and P-values are indicated on the graphs for panels “bd”. Statistical analysis was performed using one-way ANOVA and Tukey multiple comparisons test for panels “bd”. Error bars are ±standard error of the mean. e Kaplan–Meier survival plot from tTA cont. Eif2ak3fl/fl, Thbs1 DTG Eif2ak3fl/fl, tTA cont. Eif2ak3CKO and Thbs1 DTG Eif2ak3CKO. The number of biologically independent animals analyzed are indicated on the graph. Statistical analysis was performed using a two-tailed log-rank test. *P < 0.0001 vs tTA cont. Eif2ak3fl/fl, Eif2ak3CKO and Thbs1 DTG Eif2ak3CKO, #P = 0.0678 vs tTA cont. Eif2ak3fl/fl, and #P = 0.0404 vs Eif2ak3CKO. f Representative western blots for Thbs1, PERK, ATF4, LC3b, and p62 from cardiac protein extracts isolated from the groups shown at 8 weeks of age. Protein extracts were from dissociated adult mouse heart cardiomyocytes. Gapdh serves as a loading control. Source data are provided as a Source Data File.
Fig. 8
Fig. 8. Overexpression of PERK mediates cardiac atrophy.
a Schematic diagram depicting the experimental protocol. Either 1E11 genomic copies of adeno-associated virus 9 (AAV9)-PERK or AAV9-luciferase (Lucif.) control were injected into the mediastinum of 7-day-old WT mouse pups. Hearts were harvested at 8 weeks of age for further analysis. b Low magnification of whole mount cardiac histological images from mice injected with AAV9-PERK or AAV9-Lucif. control stained with Masson’s trichrome at 8 weeks of age. Scale bar is 2 mm. c Representative western blots for PERK, ATF4, LC3b, and p62 from cardiac protein extracts of 8-week-old mice injected with either AAV9-Lucif. or AAV9-PERK. Gapdh serves as a loading control. d Representative western blot for ubiquitin-conjugated proteins (Ubiq.) and Gapdh as loading control on cardiac protein extracts of 8-week-old mice injected with either AAV9-Lucif. or AAV9-PERK. e HW/BW ratio (*P = 0.0051 vs AAV9-Lucif.) and f FS% at 8 weeks of age in the 2 indicated groups of mice. *P = 0.0060 vs AAV9-Lucif. g Representative immunohistochemistry for PERK (green), nuclei with DAPI (blue) and WGA (purple)-stained membranes from heart sections of AAV9-PERK or AAV9-Lucif. injected mice killed at 8 weeks of age. Scale bars are 100 μm. h Quantitative analysis of AAV9-Lucif. versus or AAV9-PERK positive (Pos.) and negative (Neg.) cross sectional area (CSA) determined by WGA staining of cardiac histological sections. *P = 0.0087 vs AAV9-Lucif. and *P = 0.0050 vs AAV9-PERK Neg. The number of biologically independent animals analyzed are indicated on the graphs. Statistical analysis was performed using a two-tailed Student’s t-test in panels “e, f”, and one-way ANOVA and Tukey multiple comparisons test in panel “h”. All error bars are ±standard error of the mean. Source data are provided as a Source Data File.
Fig. 9
Fig. 9. ATF4 is sufficient to induce cardiac atrophy.
a Schematic diagram depicting the experimental protocol. Either 0.5E11 or 1E10 genomic copies (gc) of AAV9-ATF4 or AAV9-Lucif. control were injected into the mediastinum of 7-day-old wild-type mouse pups. Hearts were harvested at 4 weeks of age for further analysis. b Representative western blots for PERK and ATF4 from cardiac protein extracts of 4-week-old mice treated with the indicated AAV9. Gapdh serves as a loading control. c, d Representative heart sections with Masson’s Trichrome staining (c) and immunohistochemistry for ATF4 (green) and WGA (purple)-stained membranes and nuclei with DAPI (blue) (d) of AAV9-ATF4 or AAV9-Lucif. injected mice (both 0.5E11 gc) at 4 weeks of age. Scale bars are 2 mm and 100 μm, respectively. e CSA of AAV9-Lucif. versus AAV9-ATF4 positive cardiomyocytes determined by ATF4 and WGA staining of histological sections as shown in panel “d”. *P = 0.0548 vs AAV9-Lucif. f Representative Masson’s trichrome stained images of hearts from mice injected with 1E10 gc AAV9-Lucif or -ATF4 and harvested at 4 weeks of age. Scale bar is 2 mm. g HW/BW ratio at 4 weeks of age in the indicated groups of mice. *P = 0.0235 vs AAV9-Lucif. h Representative immunohistochemistry for ATF4 (green), nuclei with DAPI (blue) and WGA (purple)-stained membranes from heart sections of AAV9-ATF4 or AAV9-Lucif. injected mice (both 1E10 gc) at 4 weeks of age. Scale bars are 100 μm. i CSA of ATF4 positive cardiomyocytes determined by ATF4 and WGA staining as shown in panel “h”. *P = 0.0116 vs AAV9-Lucif. j Representative western blots for LC3b, p62, and ubiquitin-conjugated proteins (Ubiq.) from cardiac protein extracts of 4-week-old mice treated with 1E10 gc AAV9-Lucif. or -ATF4. Gapdh serves as a loading control. k, l Representative micrographs of fluorescent LC3 puncta (k) and quantification thereof (l) in cultured primary neonatal rat ventricular myocytes 48 h after infection with adenoviruses to overexpress tandem mRFP-GFP-LC3 (Ad-tf-LC3) and ATF4 or βgal expressing control. Yellow dots represent autophagosomes, whereas red dots indicate autolysosomes. Scale bars are 50 μm. *P < 0.0001 vs Adβgal. Number of biologically independent animals or cells analyzed is indicated in each panel. All statistical analysis were performed using two-tailed Student’s t test. Error bars are ±standard error of the mean. Source data are provided as a Source Data File.

References

    1. Hill JA, Olson EN. Cardiac plasticity. N. Engl. J. Med. 2008;358:1370–1380. doi: 10.1056/NEJMra072139. - DOI - PubMed
    1. Baskin KK, Taegtmeyer H. Taking pressure off the heart: the ins and outs of atrophic remodelling. Cardiovasc. Res. 2011;90:243–250. doi: 10.1093/cvr/cvr060. - DOI - PMC - PubMed
    1. Heineke J, Molkentin JD. Regulation of cardiac hypertrophy by intracellular signalling pathways. Nat. Rev. Mol. Cell Biol. 2006;7:589–600. doi: 10.1038/nrm1983. - DOI - PubMed
    1. Almanza A, et al. Endoplasmic reticulum stress signalling - from basic mechanisms to clinical applications. FEBS J. 2019;286:241–278. doi: 10.1111/febs.14608. - DOI - PMC - PubMed
    1. Dikic I. Proteasomal and autophagic degradation systems. Annu. Rev. Biochem. 2017;86:193–224. doi: 10.1146/annurev-biochem-061516-044908. - DOI - PubMed

Publication types

MeSH terms