. 2021 Jun 24;12(1):3932.
doi: 10.1038/s41467-021-24150-4.

Bioactivity descriptors for uncharacterized chemical compounds

Affiliations

Bioactivity descriptors for uncharacterized chemical compounds

Martino Bertoni et al. Nat Commun. .

Abstract

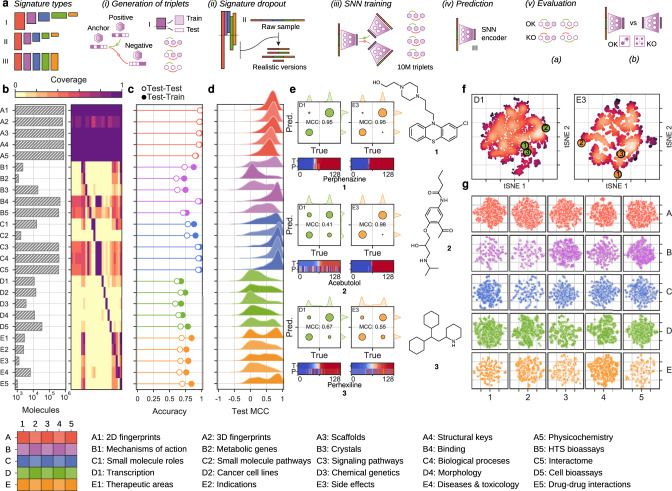
Chemical descriptors encode the physicochemical and structural properties of small molecules, and they are at the core of chemoinformatics. The broad release of bioactivity data has prompted enriched representations of compounds, reaching beyond chemical structures and capturing their known biological properties. Unfortunately, bioactivity descriptors are not available for most small molecules, which limits their applicability to a few thousand well characterized compounds. Here we present a collection of deep neural networks able to infer bioactivity signatures for any compound of interest, even when little or no experimental information is available for them. Our signaturizers relate to bioactivities of 25 different types (including target profiles, cellular response and clinical outcomes) and can be used as drop-in replacements for chemical descriptors in day-to-day chemoinformatics tasks. Indeed, we illustrate how inferred bioactivity signatures are useful to navigate the chemical space in a biologically relevant manner, unveiling higher-order organization in natural product collections, and to enrich mostly uncharacterized chemical libraries for activity against the drug-orphan target Snail1. Moreover, we implement a battery of signature-activity relationship (SigAR) models and show a substantial improvement in performance, with respect to chemistry-based classifiers, across a series of biophysics and physiology activity prediction benchmarks.


Conflict of interest statement

The authors declare no competing interests.

Figures

Fig. 1
Fig. 1. Training and evaluation of CC signaturizers.
a Scheme of the methodology. Signaturizers produce bioactivity signatures that fill the gaps in the experimental version of the CC. A SNN is trained using a signature-dropout scheme over 107 triplets of molecules (anchor, positive, negative) to infer missing signatures in each bioactivity space. The inferred signatures are finally evaluated. b Coverage of the experimental version of the CC. The bar plot indicates the number of molecules available for each CC data type. The heatmap shows the cross-coverage between data sets, i.e., it is a 25 × 25 matrix capturing the proportion of molecules in one data set (rows) that are also available in other data sets (columns) c Accuracy of the 25 signaturizers, measured as the proportion of correctly classified cases within a triplet. Train–test refers to the case where the anchor molecule belongs to the test set, and the positive and negative molecules belong to the training set. Test–test corresponds to the most difficult case where none of the three molecules within the triplet has been utilized during the training. d Performance of the 25 signaturizers, measured for each molecule as the correlation between the true and predicted signatures along the 128 dimensions. Given the bimodal distribution of signature values, signatures are binarized (positive/negative) and correlation is measured as a Matthew’s correlation coefficient (MCC) over the true-vs-predicted contingency table. e Three exemplary molecules (1, 2, and 3) are shown for the D1 and E3 spaces. True and predicted signatures are displayed as color bars, both sorted according to true signature values. f Correspondingly, t-SNE 2D projections of D1 and E3 predictions, where 1, 2, and 3 are highlighted, the intensity level describes the density of molecules in the 2D space going from dark red (low density) to white (high density). g 2D-projected train (gray) and test (colored) samples for the 25 CC spaces. The legend at the bottom specifies the A1-E5 organization of the CC.
Fig. 2
Fig. 2. Large-scale bioactivity prediction using the signaturizers (~800k molecules).
a Features combined to derive the applicability scores (α). b Applicability scores for the predictions, displayed across the 25 (A1-E5) 2D-projected signature maps. A grid was defined on the 2D coordinates, molecules were binned and the average α is plotted in a red (low) to blue (high) color scale. c Cross-correlation between CC spaces, defined as the capacity of similarities measured in Si (rows) to recall the top-5 nearest neighbors in Sj (columns) (ROC-AUC), the color scale goes from red to blue indicating low to high cross-correlation (also reported as dot size). Top 10k molecules (sorted by α) were chosen as Si. d Scheme of the signature stacking procedure. Signatures can be stacked horizontally to obtain a global signature (GSig) of 3200 dimensions. e Ability of similarity measures performed in the GSig space to identify pairs of molecules sharing the Mode of action (MoA left) or therapeutic classes (ATC code right) (ROC-AUC). f Likewise, the ability of GSigs to identify the nearest neighbors found in the experimental (original) versions of the A1-E5 data sets. g t-SNE 2D projection of GSigs. The 10k molecules with the highest average α across the 25 signatures are displayed. The cool-warm color scale represents chemical diversity, red meaning that molecules in the neighborhood are structurally similar (Tanimoto MFp similarity between the molecule in question and their 5-nearest neighbors). A subset of representative clusters is annotated with enriched binding activities. h Example of a cluster enriched in heat shock protein 90 inhibitors (HSP90AA1) with highlighted representative molecules with distinct (4) or chemically related (5) neighbors in the cluster.
Fig. 3
Fig. 3. Signature-based analysis of compound collections.
a Chemical libraries are hierarchically clustered by their proximity to the full CC; here, proximity is determined by the cluster occupancy vector relative to the k-means clusters identified in the CC collection (number of clusters = (N/2)1/2; GSigs are used). Proximal libraries have small Euclidean distances between their normalized occupancy vectors. Size of the circles is proportional to the number of molecules available in the collection. Color (blue-to-red) indicates the homogeneity (Gini coefficient) of the occupancy vectors relative to the CC. b Occupancy of high-applicability regions is further analyzed for five collections (plus the full CC). In particular, we measure the average 10-nearest-neighbor L2-distance (measured in the GSig space) of molecules to the high-α subset of CC molecules (103, Fig. 2). The red line denotes the distance corresponding to an empirical similarity P-value of 0.01. The percentage indicates the number of molecules in the collection having high-α vicinities that are, on average, below the significance threshold. This percentage is shown for the rest of the libraries in a. c The previous five compound collections are merged and projected together (t-SNE). Each of them is highlighted in a different color with darker color indicating a higher density of molecules. d Detail of the compound collections. The first column shows the chemical diversity of the projections, measured as the average Tanimoto similarity of the 5-nearest neighbors. Blue denotes high diversity and red high structural similarity between neighboring compounds. Coloring is done on a per-cluster basis. The rest of the columns focus on annotated subsets of molecules. Blue indicates high-density regions.
Fig. 4
Fig. 4. Library enrichment to identify Snail1 inhibitors.
a Scheme of the methodology. Two compound libraries are screened (IRB and PWCK). A chemical query is done by looking for similarities with known DUB inhibitors. A biological query is done by looking for transcriptional (D1) and network-based (C3–5) signature matchings with Snail1-relevant targets. Random molecules are selected to estimate the background hit-rate. A Snail1 expression assay based on Firefly:Renilla luciferase ratios are used to screen candidate compounds. b Library enrichment quantification showing the effects of compounds selected by chemical (red), biological (blue), shared between both (magenta), and random (gray) queries, as well as the positive (PR-619) and negative (DMSO) controls. c Detail of the top 25 hit compounds. d Fold enrichment of compounds selected by chemical (red), biological (blue), and shared (magenta) queries with respect to random picks, based on their capacity to modulate Snail1 levels (Firefly:Renilla assay). Median ± MAD (n = 4). e MDA-MB-231 cells stably expressing luciferase constructs were treated for 6 h with the indicated compounds, at different doses. Firefly:Renilla ratios were normalized with the corresponding concentration of vehicle (DMSO). Mean ± SD of 2 independent experiments, each of them including 4 replicas, are shown.
Fig. 5
Fig. 5. MoleculeNet benchmarks, comparing the predictive power of CC signatures with a classical MFp-based approach.
a Precision–recall curves (PRCs) for the Tox21 SR-HSE task, trained with CC signatures (blue) and MFps (red). Shaded areas span the standard deviation over five stratified train–test splits, the darker lines indicate the mean value. b Robustness of the SR-HSE classifier, understood as the maintenance of performance (ROC-AUC) as fewer training samples become available. c Prediction scores (probabilities) of active test molecules using MFps (x axis) or CC signatures (y axis). d Importance of CC data sets for the predictions. Features are ranked by their absolute Shapley value (SHAP) across samples (plots are capped at the top 250 features). For each CC data set (Si), SHAPs are cumulatively summed (y axis; normalized by the maximum cumulative sum observed across CC data sets). e 2D projections related to SR-HSE (first column) and other (second column) tasks, done for the A1, B5, and D4 CC categories (rows). A simple support vector classifier (SVC) is trained with the (x,y)-coordinates as features in order to determine an activity-decision function. Performance is given as a ROC-AUC on the side of the plots. Blue and red areas correspond to likely active and likely inactive regions, respectively. Active compounds are overlaid as black dots. f Performance of CC signatures (blue) and MFps (red) on the 12 Tox21 tasks. Tasks are ranked by their CC ROC-AUC performance. g Global performances of biophysics (purple) and physiology (orange) benchmark tasks. PRC and ROC AUCs are used, following MoleculeNet recommendations, the number of tasks of each category varies and is reported in the original MoleculeNet report. Here we report mean ± SD. Shades of blue indicate whether all 25 CC data sets were used (light) or whether conservative data set removal was applied (darker) (Supplementary Table 1). Dashed and dotted lines mark respectively the best and average reported performance in the seminal MoleculeNet study. h Relative performance of CC and MFp classifiers across all MoleculeNet tasks (split by ROC-AUC and PRC-AUC metrics, correspondingly; top and middle panels). Higher performances are achieved when more active molecules are available for training (x axis). The average gain in AUC is plotted in the bottom panel.

References

    1. Llanos, E. J. et al. Exploration of the chemical space and its three historical regimes. Proc. Natl Acad. Sci. USA116, 12660–12665 (2019). - PMC - PubMed
    1. Gromski, P. S., Henson, A. B., Granda, J. M. & Cronin, L. How to explore chemical space using algorithms and automation. Nat. Rev. Chem.3, 119–128 (2019).
    1. Wassermann, A. M., Lounkine, E., Davies, J. W., Glick, M. & Camargo, L. M. The opportunities of mining historical and collective data in drug discovery. Drug Discov. Today20, 422–434 (2015). - PubMed
    1. Kauvar, L. M. et al. Predicting ligand binding to proteins by affinity fingerprinting. Chem. Biol.2, 107–118 (1995). - PubMed
    1. Keiser, M. J. et al. Predicting new molecular targets for known drugs. Nature462, 175–181 (2009). - PMC - PubMed

Publication types

MeSH terms

Substances