. 2021 Jul;23(7):692-703.
doi: 10.1038/s41556-021-00694-x. Epub 2021 Jun 24.

Epithelial cell plasticity drives endoderm formation during gastrulation

Affiliations

Epithelial cell plasticity drives endoderm formation during gastrulation

Katharina Scheibner et al. Nat Cell Biol. 2021 Jul.

Erratum in

Abstract

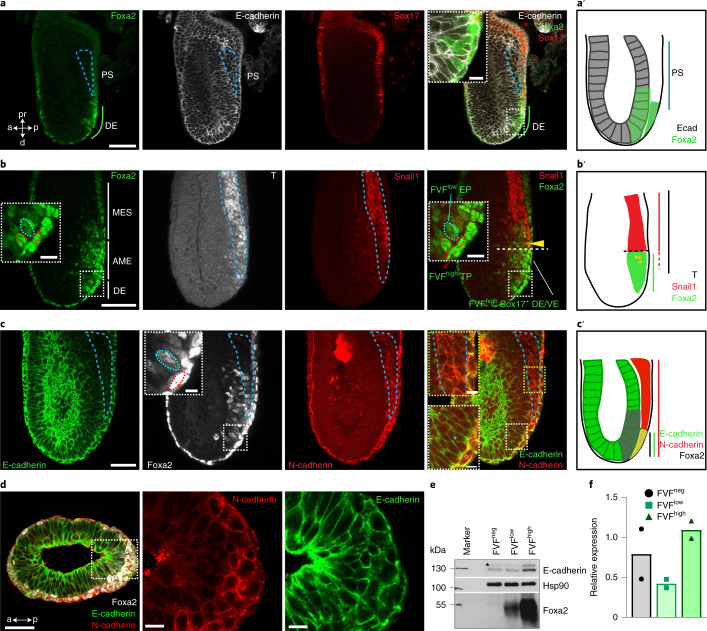
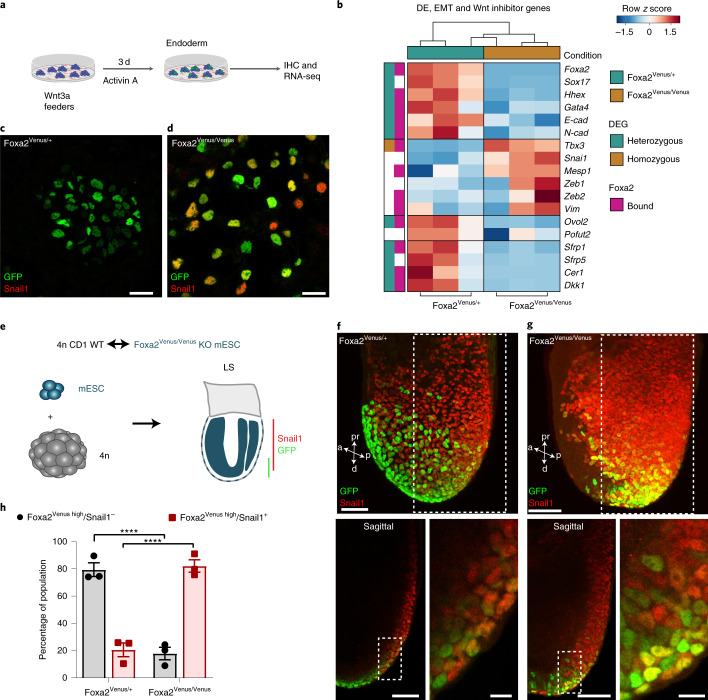
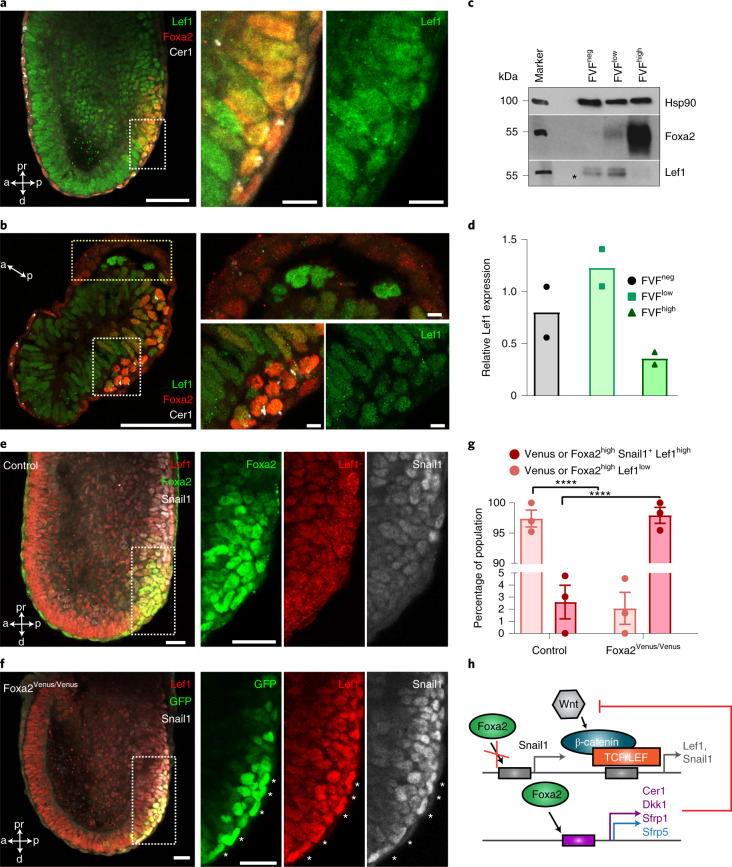
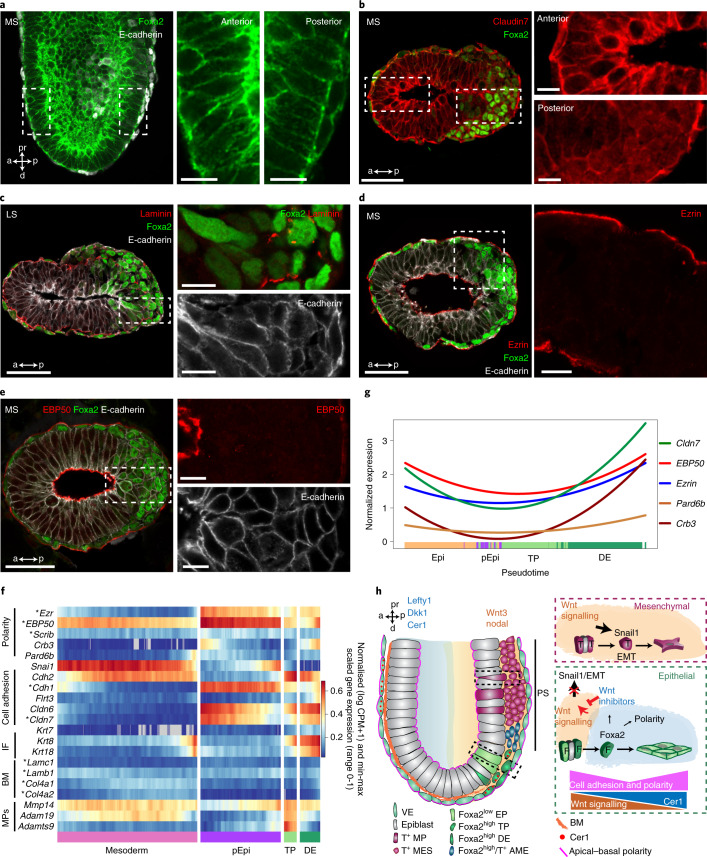
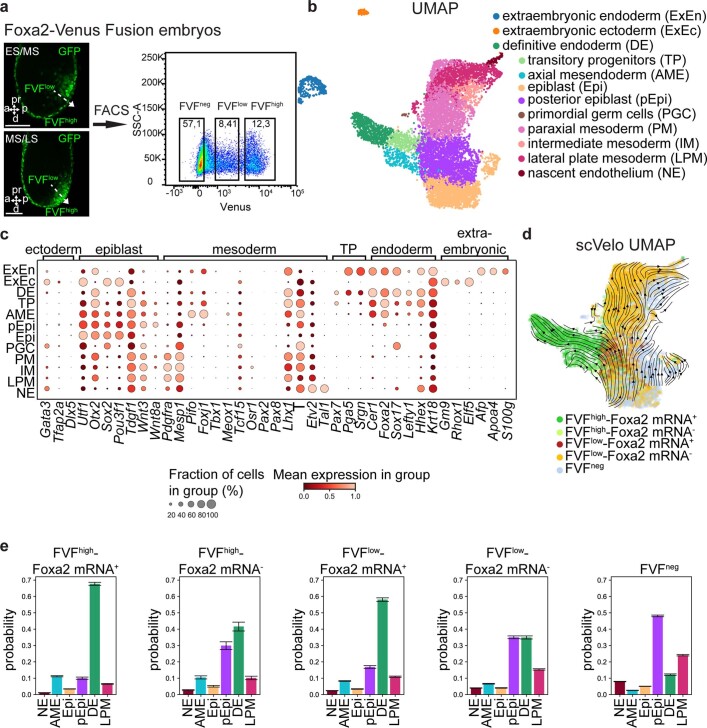
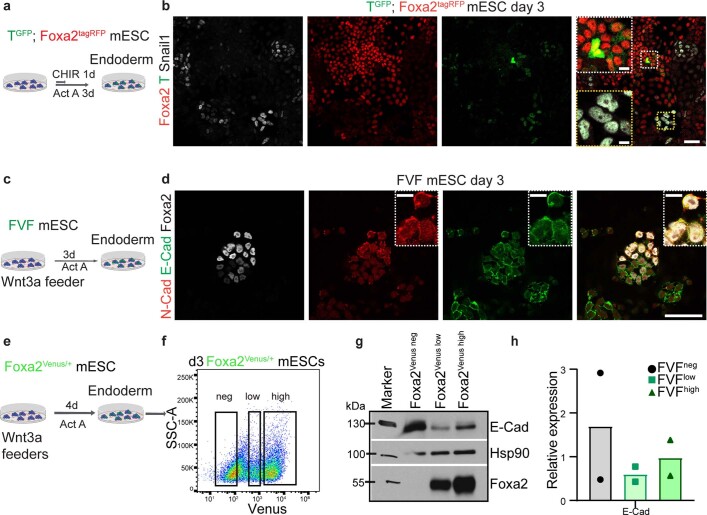
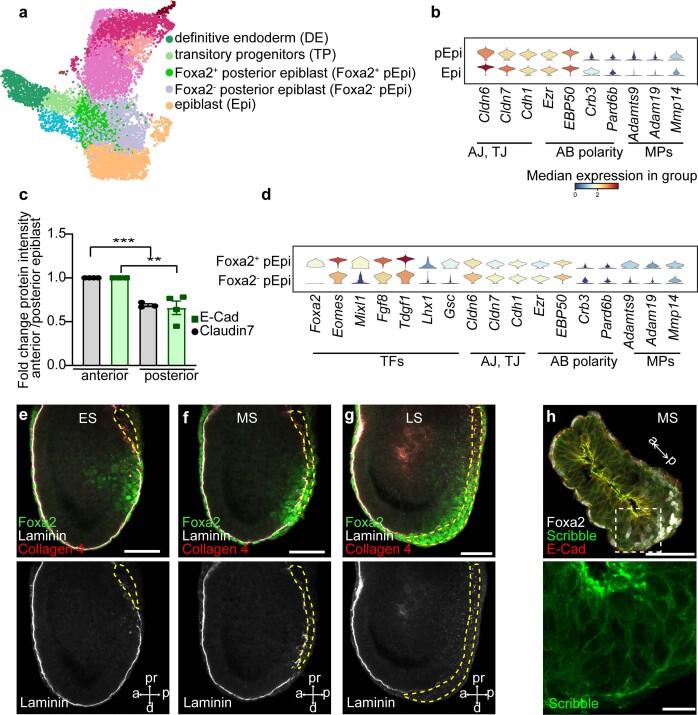
It is generally accepted that epiblast cells ingress into the primitive streak by epithelial-to-mesenchymal transition (EMT) to give rise to the mesoderm; however, it is less clear how the endoderm acquires an epithelial fate. Here, we used embryonic stem cell and mouse embryo knock-in reporter systems to combine time-resolved lineage labelling with high-resolution single-cell transcriptomics. This allowed us to resolve the morphogenetic programs that segregate the mesoderm from the endoderm germ layer. Strikingly, while the mesoderm is formed by classical EMT, the endoderm is formed independent of the key EMT transcription factor Snail1 by mechanisms of epithelial cell plasticity. Importantly, forkhead box transcription factor A2 (Foxa2) acts as an epithelial gatekeeper and EMT suppressor to shield the endoderm from undergoing a mesenchymal transition. Altogether, these results not only establish the morphogenetic details of germ layer formation, but also have broader implications for stem cell differentiation and cancer metastasis.


Conflict of interest statement

F.J.T. reports receiving consulting fees from and having an ownership interest in Cellarity.

Figures

Fig. 1
Fig. 1. Endoderm progenitors do not show hallmarks of an EMT.
a, Mid-streak-stage FVF/SCF embryos stained for Venus (Foxa2), E-cadherin and RFP (Sox17). The blue dashed line indicates the primitive streak (PS). a, anterior; d, distal; DE, definitive endoderm; p, posterior; pr, proximal. b, Immunohistochemistry of a mid-streak-stage FVF embryo stained for Venus (Foxa2), Snail1 and T. The blue dashed lines in the insets mark FVFlow epiblast progenitors (EPs) and the red dashed lines mark FVFhigh transitory progenitors (TPs). The yellow arrowhead marks AME cells that synthesize Foxa2, T and Snail1. The horizontal white dashed line indicates the border of Snail1 expression. MES, mesoderm; TP, transitory progenitor; VE, visceral endoderm. c, Mid-streak-stage FVF embryo immunostained for Venus (Foxa2; white), N-cadherin and E-cadherin. The blue asterisk (rightmost image inset in white dashed box) and inset blue dashed line (inset in image second from left) mark FVFlow epiblast progenitors in the epiblasts, whereas the red asterisk (rightmost image inset in white dashed box) and red dashed line (inset in image second from left) indicate FVFhigh transitory progenitors that express E-cadherin and N-cadherin. The primitive streak region is indicated by N-cadherin expression (blue dashed line in rightmost image inset in dashed yellow box). a′c′, Depiction of Foxa2 (a′), T and Snail1 (b′) and E-cadherin and N-cadherin expression (c′) in gastrulating embryos based on the embryos in ac. d, Transverse section through the epiblast of a mid-streak-stage wild-type embryo immunostained for Foxa2, E-cadherin and N-cadherin. e,f, Western blot analysis (e) and quantification (f) of E-cadherin from FACS-sorted FVFneg, FVFlow and FVFhigh cells of 122 and 36 FVF embryos (n = 2). The asterisk marks unspecific bands. All shown confocal images are single z planes of a z stack. The images in ad are representative of eight, three, three and three embryos, respectively. All samples were derived from biologically independent experiments. The data are presented as mean values. Scale bars, 50 µm (insets, 10 µm). Source data
Fig. 2
Fig. 2. Mesoderm and endoderm form by distinct molecular programs.
a, Schematic of FACS of early-, mid- and late-streak-stage FVF embryos for scRNA-seq analysis (n = 79 for early- to mid-streak-stage embryos and n = 24 for mid- to late-streak-stage embryos). b, UMAP plot with RNA velocity arrows, coloured by CellRank’s metastable state assignment. Each shown tissue is either in the initial (epiblast (Epi)), intermediate (posterior epiblast (pEpi)) or final state (AME, definitive endoderm, lateral plate mesoderm (LPM) and nascent endothelium (NE)). c, UMAP showing CellRank’s fate probabilities for different tissues as pie charts (n = 9,794 cells). The partitions of each pie chart show the previously identified initial, intermediate or final state. Dashed lines indicate significant connections between clusters (PAGA graph model). Arrows indicate consistent RNA velocity between two clusters. The thickness of each line shows the confidence of the model. The solid line without an arrowhead suggests a transition along the velocity between clusters but not unique flow. IM, intermediate mesoderm; PGC, primordial germ cell; PM, paraxial mesoderm. d, Scatter plot of lineage drivers, showing the correlation of gene expression for the lineages definitive endoderm and LPM, computed using CellRank. The top 50 correlated genes are indicated by dashed horizontal and vertical lines. e, Stacked violin plots showing the gene expression distribution (columns) with definitive endoderm, EMT, EMT inhibitors and cell adhesion genes of all tissues (rows) (n = 2,215 (posterior epiblast); n = 2,198 (paraxial mesoderm); n = 1,183 (LPM); n = 701 (definitive endoderm); n = 389 (intermediate mesoderm); n = 350 (transitory progenitors); n = 278 (AME); n = 91 (nascent endothelium)). The colours correspond to normalized median gene expression for each group. f, UMAP plots coloured by the log[counts per million + 1] normalized gene expression. g, Schematic of endoderm and mesoderm differentiation of TGFP/+; Foxa2tagRFP/+ mESCs. h, Heatmap of FACS-sorted endodermal and mesodermal subpopulations expressing different levels of CD24 at days 2 and 4, showing RNA expression levels of pluripotency, endoderm, mesoderm and EMT genes in mESCs (ES), early (definitive endoderm progenitor (DEP)/mesoderm progenitor (MP)) and late (definitive endoderm (DE)/mesoderm (MES)) endoderm and mesoderm cells. The coloured boxes indicate differentially expressed genes (DEGs) in DEP versus mesoderm progenitor (green and orange, respectively) or definitive endoderm versus mesoderm (blue and red, respectively) and whether Foxa2 binds (pink) or binds and regulates them (purple). Source data
Fig. 3
Fig. 3. Snail1 is not required for endoderm formation.
a, Endoderm differentiation schematic of Snail1 knockout mESCs. b,c, Immunohistochemistry of differentiated wild-type (control) (b) and Snail1 knockout (c) endoderm cells at day 3 stained for Sox17 and Foxa2. d, FACS quantification of Foxa2+ and Sox17+/Foxa2+ cells in control versus Snail1 knockout endoderm differentiations (two-tailed unpaired Student’s t-test (no significant difference); n = 5 (control); n = 8 (Snail1 knockout)). e, Schematic of the generation of tetraploid aggregation chimeras with Snail1 knockout mESCs. EHF, early headfold stage. LB, late bud stage. 4n, tetraploid. f,g, Maximum projection from confocal images of wild-type (control) (f) and Snail1 knockout chimeric embryos (g) stained for RFP (mT) and Sox17, showing the dispersal of visceral endoderm (mT+) by Snail1 mutant or wild-type definitive endoderm cells. The bottom images show magnified views of the areas highlighted by dashed white rectangles in the images above. h, Quantification of formed definitive endoderm over visceral endoderm in wild-type (control) and Snail1 mutant embryos at the early headfold stage (two-sided unpaired Student’s t-test (no significant difference); n = 3 embryos each). All samples were derived from biologically independent experiments. The images in b and c are representative of five independent differentiations each. The images in f and g are representative of three embryos each. The data are presented as mean values ± s.e.m. Scale bars, 50 µm (insets, 10 µm). Source data
Fig. 4
Fig. 4. Foxa2 suppresses Snail1 in the endoderm lineage.
a, Schematic of endoderm differentiation of Foxa2Venus/Venus knockout mESCs. IHC, immunohistochemistry. b, Heatmap of Foxa2Venus/+ and Foxa2Venus/Venus endoderm showing the up- and downregulation of endoderm genes, EMT activators, inhibitors and Wnt signalling inhibitors (n = 3 independent differentiations). The pink boxes indicate genes bound by Foxa2. The green and brown boxes mark genes with significantly different expression in Foxa2Venus/+ and Foxa2Venus/Venus cells, respectively. c,d, Immunostainings against Venus and Snail1 of Foxa2Venus/+ control (c) and Foxa2Venus/Venus knockout mESCs (d) differentiated under endoderm conditions for 3 d. e, Schematic of aggregation chimeras generated with Foxa2Venus/+ and Foxa2Venus/Venus mESCs. LS, late-streak stage; WT, wild type. f,g, Maximum projections (top) and single optical sections (bottom) from confocal images of Foxa2Venus/+ (f) and Foxa2Venus/Venus late-streak stage mESC tetraploid aggregation chimeras (g) stained for Venus and Snail1. h, Quantification of Venushigh and Snail1+ or Snail1 cells in Foxa2Venus/+ and Foxa2Venus/Venus aggregation chimeras (****P < 0.0001; ordinary one-way analysis of variance with Tukey’s multiple comparisons test; n = 3 embryos). Statistically non-significant results are not indicated in the figure. All samples were derived from biologically independent experiments. The images in c and d are representative of four independent endoderm differentiations. The images in f and g are representative of three embryos each. The data are presented as mean values ± s.e.m. Scale bars, 50 µm (insets, 10 µm). Source data
Fig. 5
Fig. 5. Foxa2 activates Wnt inhibitors in endoderm.
a, Schematic of endoderm and mesoderm differentiation of TGFP/+; Foxa2tagRFP/+ mESCs. b, Heatmap of FACS-sorted endodermal and mesodermal subpopulations expressing different levels of CD24 at days 2 and 4, showing RNA expression levels of canonical Wnt signalling genes. c, Heatmap of endoderm and mesoderm from differentiations of TGFP/+; Foxa2tagRFP/+ cells, showing upregulation of EMT suppressors in endoderm. In b and c, the coloured boxes to the left indicate genes that were differentially expressed in DEP versus mesoderm progenitor (green and orange, respectively) or definitive endoderm versus mesoderm (blue and red, respectively) and whether Foxa2 binds (pink) or binds and regulates them (purple). d, Clustered heatmap showing the smoothed (sliding window of n = 100 cells) and scaled gene expression of Wnt signalling genes in mesoderm (paraxial mesoderm, intermediate mesoderm, LPM and nascent endothelium), posterior epiblast, transitory progenitors and definitive endoderm. e, Quadratic spline plots showing genes involved in activation and inhibition of Wnt signalling along diffusion pseudotime from epiblasts to posterior epiblasts to transitory progenitors to definitive endoderm. f,g, Maximum projections of control (representative of six embryos) (f) and Foxa2Venus/Venus knockout (representative of eight embryos) (g) late-streak-stage aggregation embryos immunostained for GFP or Foxa2, Snail1 and Cer1. All samples were derived from biologically independent experiments. All shown confocal images are single planes of a z stack unless otherwise stated. Scale bars, 50 µm.
Fig. 6
Fig. 6. Foxa2 indirectly suppresses Wnt signalling in endoderm.
a,b, Confocal image of a mid-streak-stage embryo (a) and a transverse section through the epiblast of a mid-streak-stage embryo (b) immunostained for Foxa2, Lef1 and Cer1. c,d, Western blot analysis (c) and quantification (d) of Lef1 from FACS-sorted FVFneg, FVFlow and FVFhigh cells of n = 36 and n = 122 FVF embryos (n = 2 experiments). The asterisk marks unspecific bands. e,f, Representative confocal images of control (e) and Foxa2Venus/Venus knockout late-streak-stage aggregation chimeras (f) immunostained for Foxa2/GFP, Lef1 and Snail1. g, Quantification of Venus or Foxa2high cells colocalizing with either Snail1 and Lef1high or Lef1low in control versus Foxa2 knockout aggregation embryos (****P < 0.0001; ordinary one-way analysis of variance with Tukey’s multiple comparison test; n = 3 embryos). The data are presented as mean values ± s.e.m. Statistically non-significant results are not indicated in the figure. h, Schematic illustrating how Foxa2 inhibits a full EMT in endoderm. Foxa2 directly (purple) or indirectly (blue) controls the expression of Wnt inhibitors. The purple and grey boxes represent the transcription factor-binding sites of gene specific promoters. TCF/LEF, T-cell factor/lymphoid enhancer factor. All samples were derived from biologically independent experiments. The images in a,b,e and f are representative of six, three, three and three embryos, respectively. All shown confocal images are single planes of a z stack unless otherwise stated. Scale bars, 50 µm (insets, 10 µm). Source data
Fig. 7
Fig. 7. Epithelial cell plasticity drives endoderm formation.
a, Representative image of a mid-streak-stage embryo stained for Foxa2 and E-cadherin. be, Transverse sections through the epiblasts of wild-type mid- and late-streak-stage embryos immunostained for Foxa2 and Claudin7 (b), Foxa2, laminin and E-cadherin (c), Foxa2, Ezrin and E-cadherin (maximum projection) (d) and Foxa2, EBP50 and E-cadherin (e). f, Clustered heatmap showing the smoothed (sliding window of n = 100 cells) and scaled gene expression of polarity, cell adhesion, intermediate filaments (IF), basement membrane (BM) and metalloproteinases (MPs) in mesoderm (paraxial mesoderm, intermediate mesoderm, LPM and nascent endothelium), posterior epiblasts, transitory progenitors and definitive endoderm. The asterisks mark genes that have been confirmed by immunohistochemistry. g, Quadratic spline plot showing the expression of polarity and cell adhesion genes along diffusion pseudotime from epiblast to posterior epiblast to transitory progenitors to definitive endoderm. h, Schematic of endoderm formation by partial EMT. All samples were derived from biologically independent experiments. The images in ad are representative of three embryos each. All shown confocal images are single planes of a z stack unless otherwise stated. Scale bars, 50 µm (insets, 10 µm).
Extended Data Fig. 1
Extended Data Fig. 1. The endoderm is formed independent of a full EMT-MET cycle.
a, Still images extracted from live cell imaging of a LS stage FVF/SCF embryo (representative of 4 embryos). The images show a single z-plane of the merge of the FVF channel in green and SCF channel in red. White dashed line shows the border of the epiblast, separating FVFlow and FVFhigh expressing cells. The yellow arrows show a single FVF cell that increases fluorescent intensity; red asterisks: DE progenitor upregulating Sox17 and intercalating into the DE layer. b, Immunohistochemistry of E6.25 (pre-streak) (2 embryos) and E6.5 (early-streak stage) (8 embryos) FVF/SCF embryos stained for Venus (Foxa2), E-cadherin and RFP (Sox17) showing Foxa2 expressing cells appearing before PS is present and (c) after PS induction (8 embryos) Foxa2 expressing cells are distal to the PS (blue dashed line indicates PS). d,e, Immunohistochemistry of LS stage FVF embryo (7 embryos) stained for Venus (Foxa2), Snail1 and T (d), LS stage wildtype embryo (3 embryos) stained for Foxa2, Snail1 and Sox17. Note, Foxa2high/Sox17+ TP does not express Snail1 (yellow arrowhead) (e). f, LS stage FVF embryo (3 embryos) immunostained for Venus (Foxa2), N-cadherin and E-cadherin. g, Quantification of Foxa2, T and Snail1 positive cells in MES, AME, Foxa2high TP of MS stage embryos (Ordinary one-way ANOVA with Tukey’s multiple comparison test, n = 4 embryos). h, Quantification of Foxa2, Sox17 and Snail1 expression in AME, Foxa2high TP/Foxa2high DE/VE and Foxa2high TP in MS stage embryos (Ordinary one-way ANOVA with Tukey’s multiple comparison test, n = 3 embryos). i, Quantification of E-cadherin and N-cadherin expression in FVF+, FVFhigh TP, FVFhigh DE/VE of MS stage embryos (Ordinary one-way ANOVA with Tukey’s multiple comparison test, n = 3 embryos). All samples are derived from biologically independent experiments. Data are presented as mean values ±SEM.; ****P < 0.0001, **P < 0.0019, *P < 0.0337. Statistically non-significant results are not indicated in the figure. All shown confocal images are single planes of a z-stack unless otherwise stated. Scale bar: 50 µm, insets 10 µm. Source data
Extended Data Fig. 2
Extended Data Fig. 2. Mapping and single cell transcriptional profiling of gastrulation.
a, Scheme for FACS sorting of FVF embryos for scRNA-seq analysis (2 FVFneg, 3 FVFlow and 3 FVFhigh samples were used in the scRNAseq analysis). b, UMAP plot colored by cell population. c, Dotplot of tissue-specific marker genes (top brackets). Colors indicate expression level, dot size indicates fraction of cells expressing the gene. d, UMAP plot with RNA velocity arrows, colored by both FVF-sorting and presence/absence of Foxa2 mRNA. RNA velocity shows gene dynamics derived from abundance of unspliced and spliced mRNA molecules for each gene. e, Barplots of the fate probability for the FVF-sorted and Foxa2 mRNA positive or negative subpopulations of the pEpi (cell numbers from left to right, n = 308; n = 52; n = 287; n = 428; n = 1140). Bar height denotes mean fate probability per state and upper/lower whiskers indicate SEM. The higher a bar, the more likely is the indicated fate for this group of cells. All shown confocal images are single planes of a z-stack unless otherwise stated. Scale bar: 50 µm.
Extended Data Fig. 3
Extended Data Fig. 3. Characterization of endoderm and mesoderm in vitro.
a, Targeting strategy to generate TGFP/+; Foxa2tagRFP/+ mESC line. An available T-GFP knock-in mESCs line was targeted with the described Foxa2tagRFP construct. Transcriptional start region (TSR), untranslated region (UTR). b, Gating strategy of differentiated TGFP/+; Foxa2tagRFP/+ mESC line towards Foxa2+ (RFP+) endodermal cells and (c) T+ (GFP+) mesodermal cells. Differentiated cells were stained for CD24 and sorted according to their CD24 expression levels Foxa2+/CD24low, Foxa2+/CD24high, T+/CD24low and T+/CD24neg at day 2 and 4 of differentiation for global mRNA expression profile analysis.
Extended Data Fig. 4
Extended Data Fig. 4. Endoderm does not show hallmarks of EMT in vitro.
a, Endoderm differentiation scheme of TGFP/+; Foxa2tagRFP/+ mESC line. b, Confocal images of differentiated TGFP/+; Foxa2tagRFP/+ mESC line (representative of 3 independent differentiations) at day 3 stained for GFP (T), Foxa2 and Snail1. Note, the presence of T+, Snail1+ MES population (yellow box), Foxa2high/T+ AME progenitors (white box) as well as Foxa2low/high DE progenitors, recapitulating the observations in vivo. c, Differentiation scheme of FVF mESCs towards endoderm fate. d, Confocal images of differentiated FVF mESCs (representative of 2 independent differentiations) at day 3 stained for Venus (Foxa2, white), E-cadherin and N-cadherin. e, Scheme of endoderm differentiation. f, Representative FACS plot of Foxa2Venus/+ cells after 3 days of differentiation, followed by FACS sorting of Foxa2Venus neg, Foxa2Venus low, Foxa2Venus high for (g) western blot analysis (2 experiments) and (h) quantification of E-cadherin (n = 2 experiments). All samples are derived from biologically independent experiments. Data are presented as mean values. All shown confocal images are single planes of a z-stack unless otherwise stated. Scale bar: 50 µm, insets 10 µm. Source data
Extended Data Fig. 5
Extended Data Fig. 5. Generation of Snail1 knockout mESCs.
a, Targeting strategy to generate Snail1 KO mESCs. b, 3′ end genotyping PCR (WT = 601 bp, KI = 529 bp) and 5′ end genotyping PCR (WT = 738 bp, KI = 657 bp) of the used Snail1 KO clones F11 and B4. c, Endoderm differentiation scheme of Snail1 KO mESCs. d, Confocal images of differentiated WT and Snail1 KO mESCs (representative of 2 independent differentiations) at day 3 stained against Snail1 and Foxa2. e, FACS analysis of differentiated WT and Snail1 KO mESCs (2 independent differentiations) at day 3 stained for Snail1 confirming the absence of Snail1 in the Snail1 KO mESCs line. f, FACS analysis of differentiated wildtype and Snail1 KO mESCs for Foxa2 and Sox17 expression (n = 5 (wildtype), n = 8 (Snail1 KO)). All samples are derived from biologically independent experiments. All shown confocal images are single planes of a z-stack unless otherwise stated. Scale bar: 50 µm, insets 10 µm. Source data
Extended Data Fig. 6
Extended Data Fig. 6. Inhibition of Wnt signaling promotes endoderm differentiation.
a, Scheme of endoderm differentiation under normal conditions (control) and with the supplementation of DKK1 or IWP2. b, Immunohistochemistry (representative of 3 independent differentiations), (c) FACS analysis and (d) quantification of differentiated TGFP/+; Foxa2tagRFP/+ under control, DKK1 and IWP2 conditions stained for GFP (T), Foxa2 and Snail1 (Ordinary one-way ANOVA with Bonferroni’s multiple comparison test, n = 4 independent differentiations). e, Confocal images (representative of 3 independent differentiations), (f) FACS analysis and (g) quantification of TGFP/+; Foxa2tagRFP/+ mESC differentiated for 3 days under control, DKK1 or IWP2 conditions and stained for GFP (T), Foxa2 and Sox17 (Ordinary one-way ANOVA with Bonferroni’s multiple comparison test, n = 3 independent differentiations). All samples are derived from biologically independent experiments. Data are presented as mean values ±SEM. d, *P < 0.0146, **P < 0.0011, (g) *P < 0.0233. Statistically non-significant results are not indicated in the figure. All shown confocal images are single planes of a z-stack unless otherwise stated. Scale bar: 50 µm, insets 10 µm. Source data
Extended Data Fig. 7
Extended Data Fig. 7. Epithelial cell plasticity drives endoderm formation.
a, UMAP plot colored by cell population. b, Stacked violin plots showing the gene expression distribution (columns) of AJ, TJ, AB polarity and metalloproteinases (MPs) genes in pEpi (n = 2215) versus Epi (n = 1929). Color corresponds to normalized median gene expression for each group. c, Quantification of E-cadherin (one-way ANOVA, n = 4 embryos) and Claudin7 (one-way ANOVA, n = 3 embryos) expression intensity at the anterior and posterior epiblast of MS stage embryos. d, Stacked violin plots showing the expression of TFs, AJ, TJ, AB polarity and metalloproteinases (MPs) genes in Foxa2+ pEpi (n = 616) versus Foxa2- pEpi (n = 1599). e, Immunostainings for Foxa2, Laminin and Collagen 4 of ES, (f) MS and (g) LS stage embryos (representative of 7 embryos used for (e-g). Yellow dashed line indicates PS. h, MS stage embryo (3 embryos) stained for Foxa2, Scribble and E-cadherin. All samples are derived from biologically independent experiments. Data are presented as mean values ±SEM.; **P < 0.0017, ***P < 0.0054. Statistically non-significant results are not indicated in the figure. All shown confocal images are single planes of a z-stack unless otherwise stated. Scale bar: 50 µm, insets 10 µm. Source data

References

    1. Argelaguet R, et al. Multi-omics profiling of mouse gastrulation at single-cell resolution. Nature. 2019;576:487–491. - PMC - PubMed
    1. Pijuan-Sala B, et al. A single-cell molecular map of mouse gastrulation and early organogenesis. Nature. 2019;566:490–495. - PMC - PubMed
    1. Nowotschin S, et al. The emergent landscape of the mouse gut endoderm at single-cell resolution. Nature. 2019;569:361–367. - PMC - PubMed
    1. Lim J, Thiery JP. Epithelial–mesenchymal transitions: insights from development. Development. 2012;139:3471–3486. - PubMed
    1. Nieto MA, Huang RY-J, Jackson RA, Thiery JP. EMT: 2016. Cell. 2016;166:21–45. - PubMed

Publication types

MeSH terms

Substances