. 2021 Oct;17(10):1065-1074.
doi: 10.1038/s41589-021-00813-7. Epub 2021 Jun 24.

Selective inhibitors of mTORC1 activate 4EBP1 and suppress tumor growth

Affiliations

Selective inhibitors of mTORC1 activate 4EBP1 and suppress tumor growth

Bianca J Lee et al. Nat Chem Biol. 2021 Oct.

Erratum in

  • Author Correction: Selective inhibitors of mTORC1 activate 4EBP1 and suppress tumor growth.
    Lee BJ, Boyer JA, Burnett GL, Thottumkara AP, Tibrewal N, Wilson SL, Hsieh T, Marquez A, Lorenzana EG, Evans JW, Hulea L, Kiss G, Liu H, Lee D, Larsson O, McLaughlan S, Topisirovic I, Wang Z, Wang Z, Zhao Y, Wildes D, Aggen JB, Singh M, Gill AL, Smith JAM, Rosen N. Lee BJ, et al. Nat Chem Biol. 2021 Aug;17(8):925. doi: 10.1038/s41589-021-00843-1. Nat Chem Biol. 2021. PMID: 34188221 No abstract available.
  • Author Correction: Selective inhibitors of mTORC1 activate 4EBP1 and suppress tumor growth.
    Lee BJ, Boyer JA, Burnett GL, Thottumkara AP, Tibrewal N, Wilson SL, Hsieh T, Marquez A, Lorenzana EG, Evans JW, Hulea L, Kiss G, Liu H, Lee D, Larsson O, McLaughlan S, Topisirovic I, Wang Z, Wang Z, Zhao Y, Wildes D, Aggen JB, Singh M, Gill AL, Smith JAM, Rosen N. Lee BJ, et al. Nat Chem Biol. 2021 Nov;17(11):1209. doi: 10.1038/s41589-021-00905-4. Nat Chem Biol. 2021. PMID: 34616097 No abstract available.

Abstract

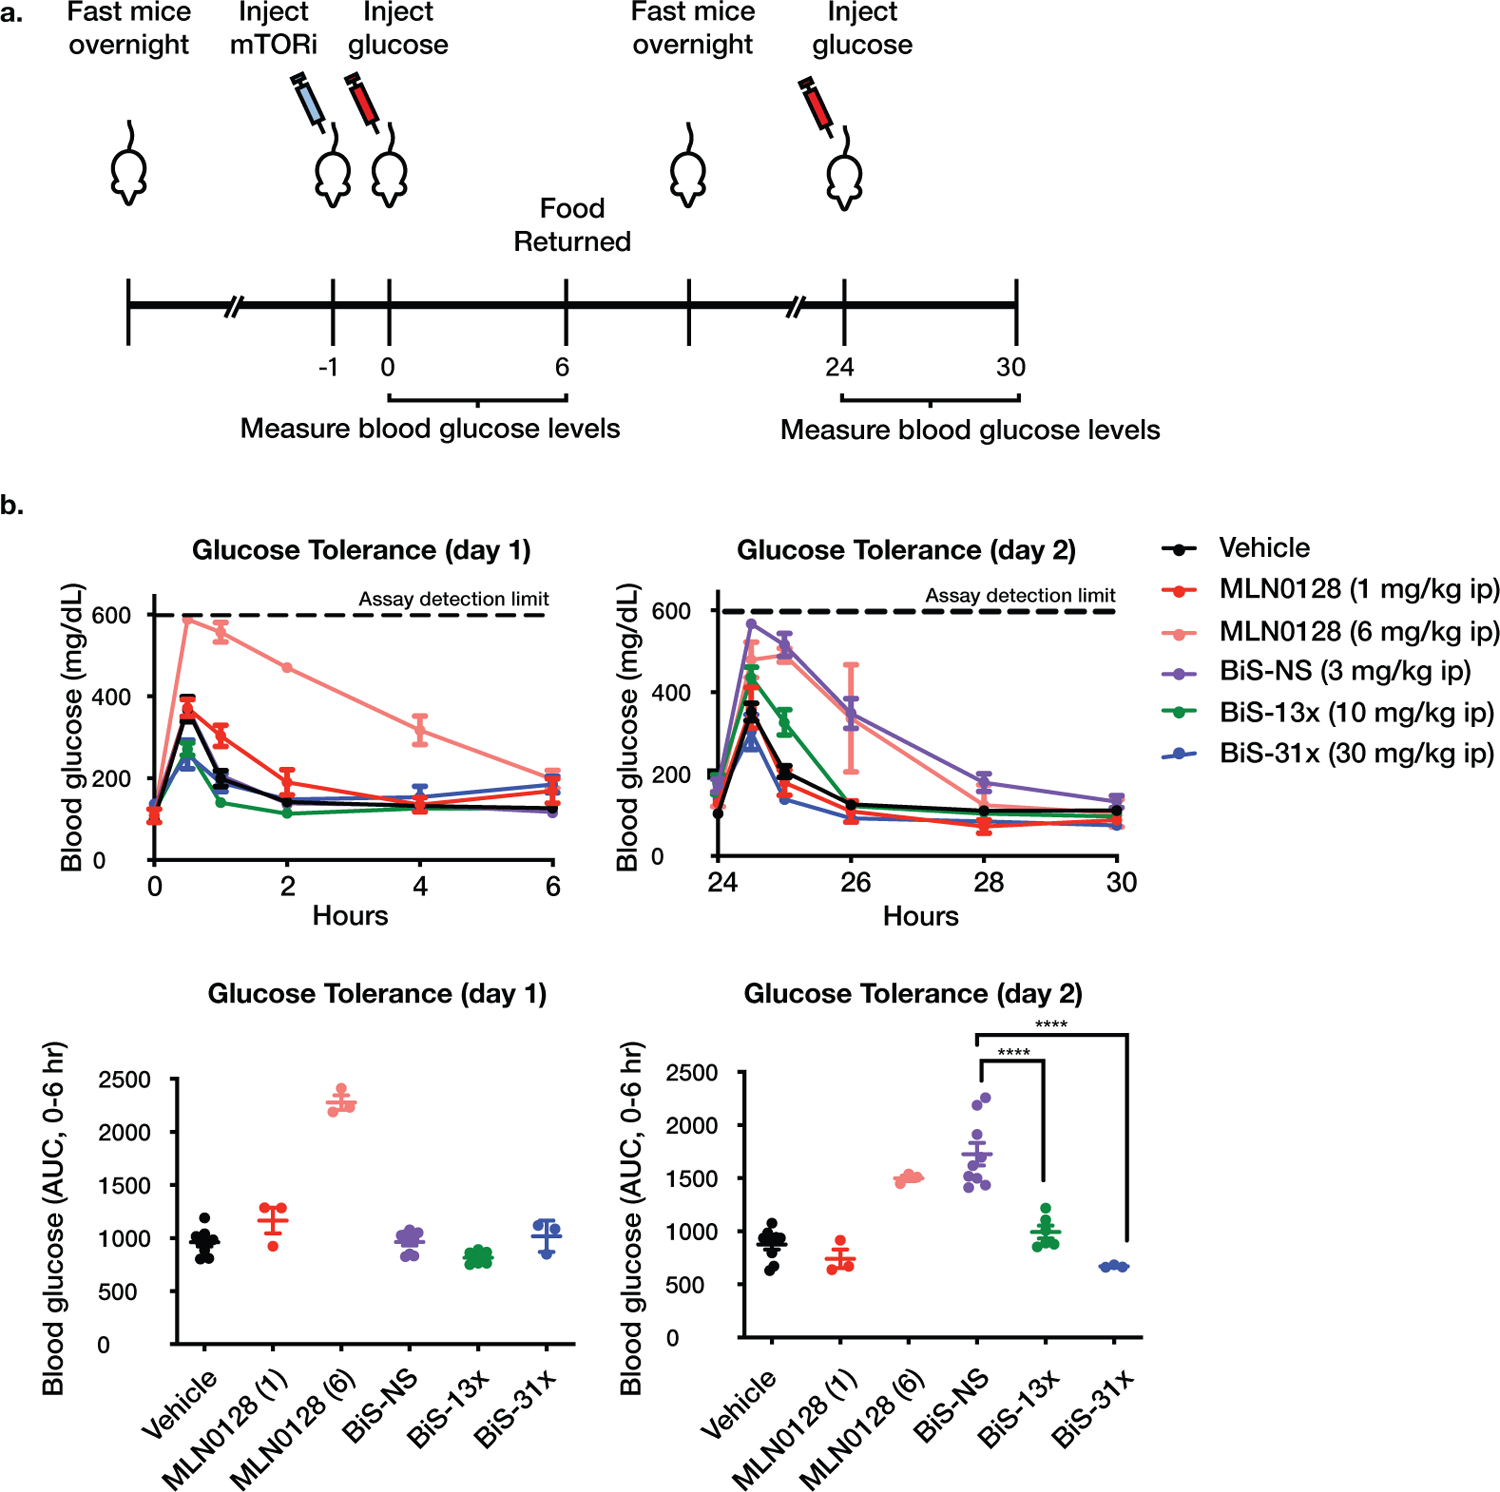
The clinical benefits of pan-mTOR active-site inhibitors are limited by toxicity and relief of feedback inhibition of receptor expression. To address these limitations, we designed a series of compounds that selectively inhibit mTORC1 and not mTORC2. These 'bi-steric inhibitors' comprise a rapamycin-like core moiety covalently linked to an mTOR active-site inhibitor. Structural modification of these components modulated their affinities for their binding sites on mTOR and the selectivity of the bi-steric compound. mTORC1-selective compounds potently inhibited 4EBP1 phosphorylation and caused regressions of breast cancer xenografts. Inhibition of 4EBP1 phosphorylation was sufficient to block cancer cell growth and was necessary for maximal antitumor activity. At mTORC1-selective doses, these compounds do not alter glucose tolerance, nor do they relieve AKT-dependent feedback inhibition of HER3. Thus, in preclinical models, selective inhibitors of mTORC1 potently inhibit tumor growth while causing less toxicity and receptor reactivation as compared to pan-mTOR inhibitors.


Conflict of interest statement

Competing interests

N.R. is on the scientific advisory board for BeiGene, MapKure, Ribon Therapeutics, Tarveda Therapeutics, Zai Lab, and Concarlo Holdings; is a consultant at Pfizer Array, Eli Lilly, AstraZeneca, and Chugai Pharmaceuticals; has received research support from Revolution Medicines, Pfizer Array, and Boehringer Ingelheim; and has equity at BeiGene, Zai Labs, Fortress, and Kura Oncology. I.T. and O.L. have consulted at and are recipients of research grants from Revolution Medicines. B.J.L., G.L.B., A.P.T., N.T., S.L.W., T.H., A.M., E.G.L., J.W.E., G.K., D.L., Z.W., Z.W., Y.Z., D.W., J.B.A., M.S., A.L.G., and J.A.M.S. are current or former employees of Revolution Medicines, Inc. The other authors declare no competing interests.

Figures

Extended Data Fig. 1
Extended Data Fig. 1. Bi-steric inhibitors are selective for mTORC1 in multiple cell lines.
a) Immunoblot analysis of whole cell lysates from MDA-MB-468 (ER-, PR-, HER2-/PTEN null, EGFR amplified), MCF-7 (ER+/PIK3CA E545K), ZR-75–1 (ER+/PTEN PL108R), and HCC1954 (HER2+/PIK3CA H1047R) breast cancer cell lines incubated with indicated compounds for 4 hours. Data are representative at least n=2 independent experiments. b) Immunoblot analysis of whole cell lysates from A375 (melanoma, BRAF V600E), MCF-7, and PC3 (prostate cancer, TP53 deletion) cells incubated with indicated compounds for 4 and 24 hours. Data are representative of at least n=2 independent experiments.
Extended Data Fig. 2
Extended Data Fig. 2. Selectivity of bi-steric inhibitors for mTORC1 is independent of feedback activation of AKT.
Immunoblot analysis of whole cell lysates from MCF-7 cells transfected with HA-Myr-AKT or vector control for 24 hours followed by exposure to indicated compounds for 4 hours. Data are representative of at least n=2 independent experiments.
Extended Data Fig. 3
Extended Data Fig. 3. Cellular activity of mTOR bi-steric inhibitors is dependent on formation of an FKBP12-mTOR-inhibitor FRB ternary complex.
a) Concentration-dependent formation of a ternary complex with emGFP-FKBP12, GST-mTOR (residues 1360–2549), and inhibitor detected by TR-FRET signal from LanthaScreen TB-anti-GST antibody. 100% ternary complex formation is defined by signal with 1 µM rapamycin. Data are the mean of technical duplicates from n=1 experiment. b) Immunoblot analysis for FKBP12 protein in parental and FKBP12 knockout NCI-H358 cells (analysis performed in n=1 experiment to verify FKBP12 knockout). c) Concentration responses of p4EBP1 T37/T46 determined from whole cell lysates of parental (filled circles) and FKBP12 knockout (open circles) NCI-H358 cells treated with increasing concentrations of indicated compounds for four hours. Data are the mean of n=2 experiments each done in technical duplicates, with error bars representing SD. d) Concentration responses of cellular proliferation determined for parental (filled circles) and FKBP12 knockout (open circles) NCI-H358 cells treated with increasing concentrations of indicated compounds for 72 hours. Data are the mean of n=2 experiments each done in technical duplicates, with error bars representing SD. e) Concentration responses of p4EBP1 T37/T46 determined from whole cell lysates of MDA-MB-468 cells treated with increasing concentrations of indicated compounds in the presence, or absence, of FK506 (10 μM) for four hours. Data are the mean of n=3 experiments each done in technical duplicates, with error bars representing SD. f) Immunoblot analysis of whole cell lysates from parental MCF-7 cells and MCF-7 cells harboring mTOR F2108L treated with increasing concentrations of indicated compounds for four hours. Data are representative of at least n=2 independent experiments.
Extended Data Fig. 4
Extended Data Fig. 4. mTORC1 bi-steric inhibitors cause reduced induction of HER3 in vitro and in vivo.
a) Immunoblot analysis of whole cell lysates from T47D cells treated with indicated compounds for 16 hours. Data are representative of at least n=2 independent experiments. b) Immunoblot analysis of lysates from T47D xenografts over a period of 24 hours following in vivo administration of a single dose of the indicated compounds. Data are representative of at least n=2 independent experiments.
Extended Data Fig. 5
Extended Data Fig. 5. Inhibition of 4EBP1 phosphorylation is important for maximal activity of mTOR bi-steric inhibitors.
a) Immunoblot analysis of whole cell lysates from MDA-MB-468 and MCF-7 sgGFP and sg4EBP1 cells incubated with increasing concentrations of RapaLink-1 for 4 hours. Data are representative of at least n=2 independent experiments. b) In vitro cap-binding affinity assay and immunoblot analysis of whole cell lysates from MDA-MB-468 sgGFP and sg4EBP1 cells. Data are representative of at least n=2 independent experiments. c) Cell viability of MDA-MB-468 sgGFP and sg4EBP1 cells incubated with increasing concentrations of RapaLink-1 for up to 5 days. Data are a mean of technical duplicates, and representative of at least n=2 independent experiments. d) In vitro cap-binding affinity assay and immunoblot analysis of MCF-7 shScr and sh4EBP1 KD cells serum-starved (0% FBS) for 18 hours, then serum-stimulated (10% FBS) and incubated for two hours with compounds at EC80 concentrations: BiS-13x (3 nM), BiS-35x (35 nM), and MLN0128 (40 nM). Serum-starved cells served as a control. Data are representative of two independent experiments with similar results. e) Cell viability of MCF-7 shScr and sh4EBP1 cells (knockdown by scrambled shRNA and shRNA against 4EBP1, respectively) exposed to the indicated compounds for 72 hours. Viability was measured as viable cell counts normalized to DMSO-treated cells, with center bars representing the mean of n=2 or 3 technical replicates and error bars representing SD of n=3 technical replicates. Data are a representative experiment of at least n=2 independent experiments. f) Cell viability of 4EBP1/2 WT and 4EBP1/2 DKO MEFs exposed to indicated compounds for 72 hours. Viability was measured as viable cell counts normalized to DMSO-treated cells, with center bars representing mean of n=2 or 3 experiments with error bars representing SD of n=3 experiments.
Extended Data Fig. 6
Extended Data Fig. 6. Inhibition of global protein synthesis by mTOR bi-steric inhibitors is partially dependent on 4EBP1.
a) Immunoblot analysis of whole cell lysates from MCF-7 cells incubated with indicated inhibitors for 4 hours and pulsed with 1 µM puromycin for the last 30 minutes. Data are representative of at least n=2 independent experiments. b) Immunoblot analysis of whole cell lysates from MCF-7 control (siScr) and 4EBP1-depleted (si4EBP1) cells incubated with increasing concentrations of RapaLink-1 for 4 hours and pulsed with 1 µM puromycin for the last 30 minutes. Data are representative of at least n=2 independent experiments.
Extended Data Fig. 7
Extended Data Fig. 7. Translational reprogramming by bi-steric and active-site inhibitors of mTOR is modulated by inhibition of mTORC1.
a) Scatter plots of polysome-associated RNA vs. cytosolic RNA log2 fold changes for the four comparisons: DMSO (complete media) vs. starvation [top left], MLN0128 vs. DMSO [top right], BiS-13x vs. MLN0128 [bottom left] and BiS-35x vs. MLN0128 [bottom right]. For each comparison, genes are colored according to their mode for regulation of gene expression derived from analysis using anota2seq and the number of such regulated transcripts is indicated: “translation“ denotes transcripts whose change in polysome-association (up or down) could not be explained by a corresponding change in total mRNA level (i.e. changes in translational efficiency leading to altered protein level); “buffering” denotes transcripts whose change in the total mRNA pool (up or down) was offset at the level of translation such that the association with polysomes remained largely unaltered (i.e. a change in total mRNA level opposed by a change in translational efficiency, which is expected to lead to unaltered protein levels despite changes in mRNA levels [as recently described],; “abundance” denotes transcript which show a similar change in the total mRNA pool and association with polysomes (i.e. a change in transcription or mRNA stability leading to altered protein level). b) Samples from the polysome-profiling experiment (normalized data) were projected on the 2 first components of a centered principal component analysis (the proportion of the variance explained by each component is indicated). Data points are colored according to their RNA source (total mRNA or polysome-associated mRNA), shapes denote treatments (DMSO, MLN0128, BiS-13, BiS-35x, or starvation) and the numbers indicate biological replicates (1–4). The library preparation was performed twice on biological replicate 1 providing 2 technical replicates labeled 1A and 1B. Replicate 1A was excluded from the downstream analysis.
Extended Data Fig. 8
Extended Data Fig. 8. mTORC1-selective bi-steric inhibitors suppress S6 phosphorylation in tumors and inhibit tumor growth in MCF-7 xenografts.
a) Levels of pS6 S240/S244 as percent of control determined for lysates from MCF-7 tumors at end of study over a period of 72 hours following the final dose of a repeat dosing schedule. Data are the mean signal of each group (n=3) and error bars represent SD. b) Mean tumor volume of MCF-7 xenografts following daily oral administration (po qd) of MLN0128, and once weekly intraperitoneal (ip qw) administration of bi-steric inhibitors (n=12 animals per group), with error bars representing SEM. c) Percent tumor volume change of individual MCF-7 xenografts with daily oral administration (po qd) of MLN0128, and once weekly intraperitoneal (ip qw) administration of bi-steric inhibitors. Gray zone represents 10% margin of error for tumor growth and shrinkage. Similar results for each agent were observed in at least n=2 independent experiments.
Extended Data Fig. 9
Extended Data Fig. 9. mTORC1-selective bi-steric inhibitors suppress 4EBP1 phosphorylation in tumors and inhibit tumor growth in HCC1954 xenografts.
a) Level of p4EBP1 T37/T46 as percent of control determined for lysates from HCC1954 tumors at end of study over a period of 72 hours following the final dose of a repeat dosing schedule (left), and unbound plasma concentration of inhibitors over time (right). Data are the mean signal of each group (n=3) and error bars represent SD. b) Level of p4EBP1 T37/T46 as percent of control determined for lysates from HCC1954 tumors after a single dose of inhibitors (left), and unbound plasma concentration of inhibitors over time (right). Data are the mean signal of each group (n=3) and error bars represent SD. c) Waterfall plot of individual end of study tumor responses, with tumor volume expressed as a percentage of initial tumor volume at time of study. Each animal is represented as a separate bar. d) Mean tumor volume of HCC1954 xenografts following once weekly intraperitoneal (ip qw) administration of bi-steric inhibitors (n=12 animals per group), with error bars representing SEM. e) Percent tumor volume change of individual HCC1954 xenografts with once weekly intraperitoneal (ip qw) administration of bi-steric inhibitors. Gray zone represents 10% margin of error for tumor growth and shrinkage. f) Mean percent body weight change of HCC1954 xenografts (n=12 animals per group), with error bars representing SEM. Similar results for each agent were observed in at least n=2 independent experiments.
Figure 1.
Figure 1.. Generation of mTOR bi-steric inhibitors with distinct mTORC1/2 selectivity profiles.
a) Representation of binding sites for FKBP12-rapamycin and active-site inhibitors in mTORC1 and mTORC2. Rapamycin has reduced affinity for mTORC2 due to partial occlusion of the FKBP12-rapamycin binding (FRB) domain, while active-site inhibitors have similar affinity for both complexes. b) Schematic representation of components of the bi-steric mTORC inhibitors: the rapamycin core (R), with sites of chemical modification shown as colored marks; the linker, with sites of attachment indicated by geometry of components and green and red color; and the active-site inhibitor analog (ASI). c) Structure of the rapamycin core, showing the linker attachment sites at C40 (green) and C26 (red), and the core modification sites at C32 (pink) and C16 (orange). d) Structures of the bi-steric molecules. The C40-linked bi-steric inhibitor RMC-4627 (BiS-13x) is shown in full, with modifications resulting in the inhibitors RMC-4287 (BiS-NS; replacement of the PP242 active-site inhibitor with MLN0128) and RMC-4745 (Bi-35x; methylcarbamate modification at C16) indicated. The C26-linked bi-steric inhibitor RMC-4529 (BiS-31x) is shown in full, with the C32 (R)-methoxy modification indicated in pink and the C26 oxime linker attachment indicated in red. e) Schematic representation of the design approach combining different linkers, active-site inhibitors, and core modifications to increase selectivity for mTORC1 over mTORC2 while maintaining potency. f) Levels of p4EBP1 T37/T46, pS6K T389, and pAKT S473 determined by MesoScale Discovery (MSD) or AlphaLISA platforms for whole cell lysates from MDA-MB-468 cells incubated with increasing concentrations of indicated compounds for two hours. These are graphs of representative experiments in which each data point is the mean of technical duplicates and normalized to vehicle control, with error bars representing SD. Independent replicate experiments: Rapamycin, n=5; MLN0128, n=7; RMC-4287, n=10; RMC-4627, n=11; RMC-4529, n=5; RMC-4745; n=5.
Figure 2.
Figure 2.. TORC1-selective bi-steric inhibitors induce apoptosis and do not induce HER3 expression in vitro.
m a, Cell viability (CTG assay) of MCF-7 cells incubated with increasing concentrations of indicated compounds for 72 hours. Cell viability data are expressed as percent of CTG signal normalized to signal at time zero (T0) (i.e. before compound addition). Data are the mean of n=4 experiments, with error bars representing SEM. b, IncuCyte® quantification of caspase 3/7 activity in MCF-7 cells treated with increasing concentrations of indicated inhibitors for 24 hours. Data are an average of n=5 experiments each done in technical duplicates, with error bars representing SEM. c, Immunoblot analysis of whole cell lysates from MCF-7 cells incubated with indicated compounds (representative of at least n=2 independent experiments). d, Immunoblot analysis of whole cell lysates from BT474 cells incubated with indicated compounds (representative of at least n=2 independent experiments).
Figure 3.
Figure 3.. Inhibition of 4EBP1 phosphorylation is sufficient to block cell growth in vitro.
Immunoblot analysis of lysates from (a) MDA-MB-468 and (b) MCF-7 cells transduced by lentivirus with rtTA3–4EBP1–4A and treated with vehicle or doxycycline (1 μg/ml) for indicated times. c, Cell viability of MDA-MB-468 rtTA3–4EBP1–4A cells treated with indicated concentrations of doxycycline for seven days. Data are the mean of technical duplicates. d, Cell viability of MCF-7 rtTA3–4EBP1–4A cells treated with indicated concentrations of doxycycline for three days, with error bars representing SD (representative of at least n=2 independent experiments). Each data point represents the mean cell viability of technical duplicates.
Figure 4.
Figure 4.. mTORC1-selective bi-steric inhibitors suppress 4EBP1 phosphorylation in tumors and inhibit tumor growth in MCF-7 xenografts.
a, Levels of p4EBP1 T37/T46 as percent of control determined for lysates from MCF-7 tumors at end of study over a period of 72 hours following the final dose of a repeat dosing schedule. Data points are the mean signal of each group (n=3) and error bars represent SD. b, Unbound plasma concentration of inhibitors over time (dotted lines). Data points are the mean signal of each group (n=3 animals) and error bars represent SD. c, Immunoblot analysis of lysates from MCF-7 tumors at end of study. d, Waterfall plot of individual tumor responses at end of study, with tumor volume expressed as a percentage of initial tumor volume at time of study start. Each animal is represented as a separate bar. e, Mean percent body weight change of MCF-7 xenografts (n=12 animals per group), with error bars representing SEM. Similar results for each agent were observed in at least n=2 independent experiments.
Figure 5.
Figure 5.. mTORC1-selective bi-steric inhibitors do not cause glucose intolerance in vivo.
a, Schematic of glucose tolerance test (GTT). Naïve mice were fasted overnight, given a single dose of compound or vehicle 1 hour prior to initial glucose challenge, fasted overnight a second time, and given a second glucose challenge 24 hours after the first challenge (n=3 animals per group). Blood glucose was monitored for a period of 6 hours after each glucose challenge. b, Blood glucose measured over time after each glucose challenge for mice dosed with indicated compounds, plotted as mg/dL (upper panel) or area under the curve (AUC, 0–6 hours) (lower panel), with center bar representing mean and error bars representing SEM. Glucometer detection of glucose has an upper limit quantification of 600 mg/dL. Data are a compilation of three studies (n=3 animals per group per study): Vehicle (n=9 animals), MLN0128 1 mg/kg (n=3 animals), MLN0128 6 mg/kg (n= 3 animals), BiS-NS (n=9 animals), BiS-13x (n=6 animals), and BiS-31x (n=3 animals) (**** P = 4.3x10⁻⁶ between BiS-NS and BiS-13x, **** P = 4.2x10⁻⁷ between BiS-NS and BiS-31x, one-way ANOVA with post-hoc Tukey’s test).

Comment in

  • Split-personality inhibitors.
    Thoreen CC. Thoreen CC. Nat Chem Biol. 2021 Oct;17(10):1012-1013. doi: 10.1038/s41589-021-00820-8. Nat Chem Biol. 2021. PMID: 34168366 No abstract available.

References

Main Text References

    1. Chalhoub N & Baker SJ PTEN and the PI3-kinase pathway in cancer. Annu Rev Pathol 4, 127–150, doi: 10.1146/annurev.pathol.4.110807.092311 (2009). - DOI - PMC - PubMed
    1. Vivanco I & Sawyers CL The phosphatidylinositol 3-Kinase AKT pathway in human cancer. Nat Rev Cancer 2, 489–501, doi: 10.1038/nrc839 (2002). - DOI - PubMed
    1. Sarbassov DD et al. Rictor, a novel binding partner of mTOR, defines a rapamycin-insensitive and raptor-independent pathway that regulates the cytoskeleton. Curr Biol 14, 1296–1302, doi: 10.1016/j.cub.2004.06.054 (2004). - DOI - PubMed
    1. Sengupta S, Peterson TR & Sabatini DM Regulation of the mTOR complex 1 pathway by nutrients, growth factors, and stress. Mol Cell 40, 310–322, doi: 10.1016/j.molcel.2010.09.026 (2010). - DOI - PMC - PubMed
    1. Dowling RJ et al. mTORC1-mediated cell proliferation, but not cell growth, controlled by the 4E-BPs. Science 328, 1172–1176, doi: 10.1126/science.1187532 (2010). - DOI - PMC - PubMed

Methods References

    1. Thoreen CC et al. A unifying model for mTORC1-mediated regulation of mRNA translation. Nature 485, 109–113, doi: 10.1038/nature11083 (2012). - DOI - PMC - PubMed
    1. Gandin V et al. Polysome fractionation and analysis of mammalian translatomes on a genome-wide scale. J Vis Exp, doi: 10.3791/51455 (2014). - DOI - PMC - PubMed
    1. Oertlin C et al. Generally applicable transcriptome-wide analysis of translation using anota2seq. Nucleic Acids Res 47, e70, doi: 10.1093/nar/gkz223 (2019). - DOI - PMC - PubMed
    1. Picelli S et al. Full-length RNA-seq from single cells using Smart-seq2. Nat Protoc 9, 171–181, doi: 10.1038/nprot.2014.006 (2014). - DOI - PubMed
    1. Ewels PA et al. nf-core: Community curated bioinformatics pipelines. bioRxiv, 610741, doi: 10.1101/610741 (2019). - DOI - PubMed

Publication types

MeSH terms

Substances

LinkOut - more resources