. 2021 Oct;17(10):1057-1064.
doi: 10.1038/s41589-021-00832-4. Epub 2021 Jun 24.

Rapid generation of potent antibodies by autonomous hypermutation in yeast

Affiliations

Rapid generation of potent antibodies by autonomous hypermutation in yeast

Alon Wellner et al. Nat Chem Biol. 2021 Oct.

Abstract

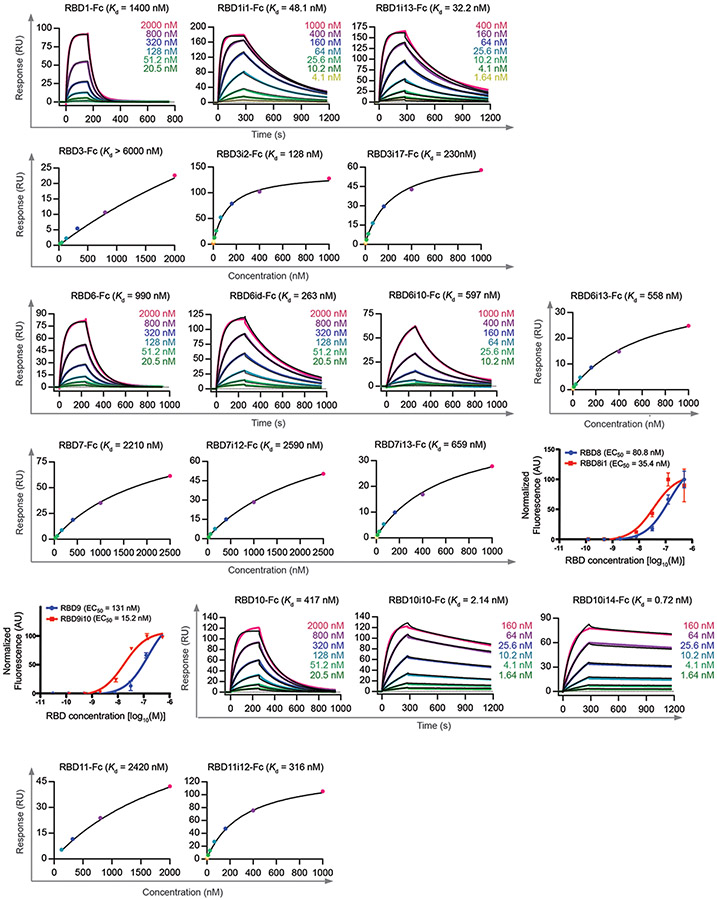
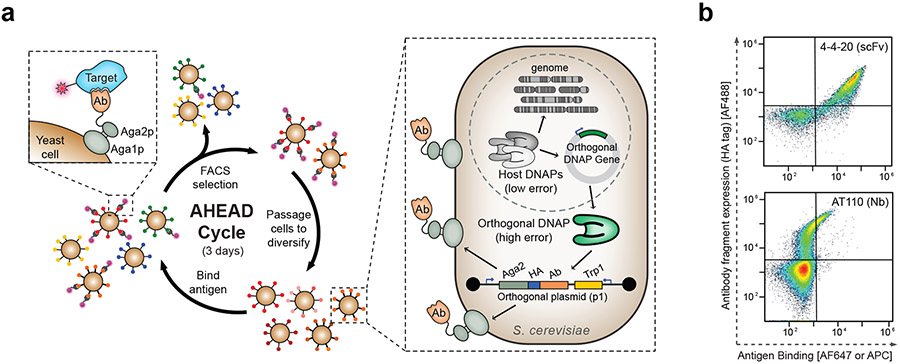
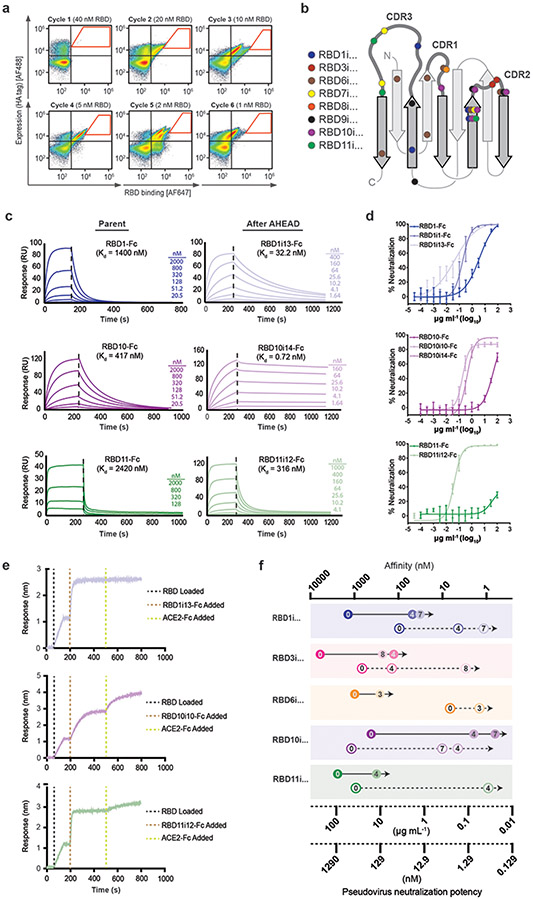
The predominant approach for antibody generation remains animal immunization, which can yield exceptionally selective and potent antibody clones owing to the powerful evolutionary process of somatic hypermutation. However, animal immunization is inherently slow, not always accessible and poorly compatible with many antigens. Here, we describe 'autonomous hypermutation yeast surface display' (AHEAD), a synthetic recombinant antibody generation technology that imitates somatic hypermutation inside engineered yeast. By encoding antibody fragments on an error-prone orthogonal DNA replication system, surface-displayed antibody repertoires continuously mutate through simple cycles of yeast culturing and enrichment for antigen binding to produce high-affinity clones in as little as two weeks. We applied AHEAD to generate potent nanobodies against the SARS-CoV-2 S glycoprotein, a G-protein-coupled receptor and other targets, offering a template for streamlined antibody generation at large.


Figures

Extended Data Figure 1.
Extended Data Figure 1.. Antibody fragments.
Single-chain variable fragments and nanobodies are displayed on the surface of yeast in this study. Their relationships to conventional antibodies are depicted.
Extended Data Figure 2.
Extended Data Figure 2.. Evolution of anti-AT1R nanobodies by AHEAD.
(a) Contributions of individual mutations fixed during the evolution of AT110 by AHEAD. Affinity (EC50) of each nanobody for AT1R was determined by measuring binding of yeast-displayed nanobodies to each concentration of AT1R-angiotensin II complex (X-axis) in a single replicate and fitting the resulting binding curve. (b) Amino acid sequence of AT110 and evolved variants. Mutations that were discovered using AHEAD are underlined in bold. Mutations that were discovered in a previous AT110 evolution experiment using a standard error prone PCR library approach are highlighted in yellow.
Extended Data Figure 3.
Extended Data Figure 3.. Optimization of antibody display in AHEAD.
(a) Maps of orthogonal p1 plasmids containing OrthoRep parts driving expression of nanobodies in the first-generation AHEAD 1.0 and improved second-generation AHEAD 2.0 systems. Nb = nanobody, tAHD1 = ADH1 terminator, polyA = polyadenosine tail (b) Increased functional expression of nanobody AT110 using all AHEAD 2.0 parts as determined by FACS. The induced population in AHEAD 2.0 shows an ~25-fold increase in nanobody display levels (determined by mean fluorescence intensity of the cell population) compared to AHEAD 1.0.
Extended Data Figure 4.
Extended Data Figure 4.. Optimization of antibody display in AHEAD and evolution of anti-GFP and anti-HSA antibodies using the optimized second-generation AHEAD 2.0 system.
(a) Architectures for nanobody display in the first-generation AHEAD 1.0 and improved second-generation AHEAD 2.0 systems. (b) Selection of a new leader sequence for higher nanobody display. FACS plots showing the progressive enrichment of higher efficiency leader sequences across 3 rounds of selection (left panel). Nanobody display level using app8 compared to the selected app8i1 variant (right panel). n = 6, error bars represent ± s.d. (c) Selected FACS plots showing affinity maturation of Nb.b201 through AHEAD cycles. (d) Selected FACS plots showing affinity maturation of Lag42 through AHEAD cycles. (e) (left) Affinities (EC50) of improved high-affinity anti-HSA nanobodies evolved using AHEAD. Binding of yeast-displayed nanobodies by each concentration of HSA was measured in replicate (n = 3, error bars represent ± s.d.) and EC50s were determined by fitting each binding curve. (right) Affinities (EC50) of improved high-affinity anti-GFP nanobodies evolved using AHEAD. Binding of yeast-displayed nanobodies by each concentration of GFP was measured in replicate (n = 3, error bars represent ± s.d.) and EC50s were determined by fitting each binding curve.
Extended Data Figure 5.
Extended Data Figure 5.. Evolution of anti-RBD nanobodies.
(a) Isolation of parent anti-RBD nanobodies. (left) FACS plot showing enrichment of initial anti-RBD nanobody clones from a naïve nanobody library. The green polygon corresponds to the gate used for sorting. (right) Schematic showing the separation of parent clones into different AHEAD experiments in order to minimize competition among parents and their lineages, avoiding early loss of weak parents that have the potential to yield superior descendants later during affinity maturation. (b) Selected FACS plots showing anti-RBD affinity maturation by cycles of AHEAD in 8 independent experiments, each starting from one of the 8 parent clones identified from the naïve nanobody library (see Extended Data Fig. 5a). Red polygons correspond to the gates used for sorting.
Extended Data Figure 6.
Extended Data Figure 6.. Affinities of anti-RBD nanobodies determined by surface plasmon resonance (SPR) or EC50 measurements.
SPR or EC50 binding curves are shown for each anti-RBD nanobody characterized in this study. For SPR measurements (Y-axis = Response), kinetic fits are shown where available and steady-state affinity fits are shown for nanobodies for which the on and off rates could not be determined. For EC50 affinities (Y-axis = Normalized Fluorescence), binding of yeast-displayed nanobodies by each concentration of RBD was determined in biological triplicate (n = 3, error bars represent ± s.d.) and EC50s were determined by fitting each binding curve.
Extended Data Figure 7.
Extended Data Figure 7.. Neutralization assays and ACE2 competition assays for anti-RBD nanobodies evolved with AHEAD.
(a) Neutralization plots for all anti-RBD nanobodies characterized in this study. Each nanobody concentration (X-axis) was tested in replicate. n = 6, error bars represent ± s.d. (b) Bio-layer interferometry (BLI) traces measuring ACE2 competition for anti-RBD nanobodies. CR3022 is an anti-RBD antibody that does not compete with ACE2 binding (no competition control) whereas SC1A-B12 is an anti-RBD antibody that competes strongly with RBD binding.
Extended Data Figure 8.
Extended Data Figure 8.. Evolution of an anti-GFP nanobody from a computationally-designed 200,000-member naïve nanobody library encoded on AHEAD.
(a) Representative FACS plots showing enrichment of a GFP-binding clone from the nanobody library and subsequent emergence and fixation of a mutation that increases GFP binding across AHEAD cycles. (b) Affinity (EC50) of the AHEAD-evolved anti-GFP nanobody, NbG1i1, isolated from AHEAD cycle 6 as compared to its parent, NbG1, that fixed in AHEAD cycle 3. Binding of yeast-displayed nanobodies by each concentration of GFP was determined in relicate (n = 3, error bars represent ± s.d.) and EC50s were determined by fitting each binding curve.
Extended Data Figure 9.
Extended Data Figure 9.. Gating strategy for singlets in all FACS experiments.
(left) Forward scatter (horizontal axes) versus side scatter (vertical axes) of a representative population of yeast cells. Red circle represents cells passing the gate. (right) Forward scatter area (horizontal axes) vs. forward scatter height (vertical axes) gating of cells that passed through the previous gate. Green boundry represents cells passing the gate. For all FACS experiments, only cells sorted through both gates were used in nanobody expression and binding gates and measurements.
Figure 1.
Figure 1.. Autonomous Hypermutation yEast surfAce Display (AHEAD).
(a) Scheme for rapid evolution of high-affinity binding using AHEAD. Ab = antibody fragment, DNAP = DNA polymerase, HA = hemagglutinin tag. (b) Cytometry plot showing detection of a functionally surface-displayed scFv and a functionally surface-displayed Nb encoded on the p1 orthogonal plasmid, replicated by an associated orthogonal DNAP. The orthogonal DNAP used in this case was the wt TP-DNAP1 (see Online Methods) rather than the error-prone TP-DNAP1-4-2 variant that was used for all subsequent AHEAD evolution experiments. Cognate antigens for 4-4-20 (fluorescein) and AT110 (AT1R) were labeled with biotin and FLAG tag, respectively, and detected with AF647-conjugated streptavidin and APC-conjugated anti-FLAG, respectively. The HA tag was detected with mouse anti-HA and a goat anti-mouse AF488-conjugated secondary antibody.
Figure 2.
Figure 2.. Evolution of anti-AT1R nanobodies.
(a) Enrichment of affinity-increasing mutations in anti-AT1R nanobodies through cycles of AHEAD as determined by NGS of the p1-encoded nanobody population in each cycle of AHEAD. Pre = population composition before the first cycle of AHEAD. (b) Nanobody potency was assessed in a radioligand allosteric shift assay (see Online Methods). This measures the ability of each nanobody to enhance agonist affinity by stabilizing an active-state receptor conformation, serving as an indirect measure of nanobody binding affinity. Error bars represent the SEM from three independent experiments performed as single replicates.
Figure 3.
Figure 3.. Evolution of anti-SARS-CoV-2 nanobodies and activities of potent anti-SARS-CoV-2 nanobodies.
(a) Sequential FACS plots showing affinity maturation of an anti-SARS-CoV-2 nanobody (Parent = RBD10). Red polygons correspond to gates used for sorting. (See Extended Data Fig. 5b for similar plots showing affinity maturation from all parents.) (b) Location of nanobody mutations fixed in 8 independent AHEAD experiments starting from different parental clones. (See Supplementary Data Set 1 for exact mutations.) (c) Surface plasmon resonance (SPR) traces and associated monovalent affinities for select anti-SARS-CoV-2 nanobodies evolved using AHEAD. (See Extended Data Fig. 6 for affinity measurements on additional nanobodies.) Each nanobody was tested as an immobilized Fc fusion over which listed concentrations of RBD was flowed. (d) Neutralization activities of select anti-SARS-CoV-2 nanobodies on pseudotyped SARS-CoV-2 virus. Each nanobody concentration (X-axis) was tested in replicate. n = 6, error bars represent ± s.d. (See Extended Data Fig. 7a for neutralization activities of additional nanobodies.) (e) Bio-layer interferometry (BLI) traces measuring ACE2 competition for RBD binding in the presence of select anti-SARS-CoV-2 nanobodies evolved using AHEAD. (See Extended Data Fig. 7b for ACE2 competition activities of additional nanobodies and control antibodies.) (f) Affinity and neutralization potency improvements of nanobodies isolated from different cycles of AHEAD during each parent nanobody’s affinity maturation. Each closed circle represents a nanobody’s affinity and the open circle of identical color represents the nanobody’s neutralization potency. The number within each circle designates the AHEAD cycle from which the nanobody was isolated.
Figure 4.
Figure 4.. Epitope mapping using deep mutational scanning libraries of RBD.
(a) Logo plots showing the enrichment of RBD mutations that escape binding by each nanobody for each of the libraries as determined by NGS. Libraries 1 and 2 are biological replicates using independent RBD mutational scanning libraries to ensure consistency in the escape mutations identified. Following Greaney et al., enrichment is plotted as “escape fraction” for each mutation shown and is defined as the fraction of cells with a given RBD mutation sorted into the low nanobody labeling gate. (b) Structural mapping of each nanobody’s binding site using escape profile information. The escape mutation positions are highlighted in red magenta and yellow for RBD1i1, RBD10i10, and RBD11i12, respectively. The images were prepared using the structure of the RBD/ACE2 complex (PDB: 6M17). RBD is colored in blue; ACE2 is colored in green.

Update of

Comment in

  • Full speed AHEAD in antibody discovery.
    Sargunas PR, Spangler JB. Sargunas PR, et al. Nat Chem Biol. 2021 Oct;17(10):1011-1012. doi: 10.1038/s41589-021-00838-y. Nat Chem Biol. 2021. PMID: 34211163 No abstract available.

References

    1. Lu RM et al.Development of therapeutic antibodies for the treatment of diseases. J. Biomed. Sci 27, 1 (2020). - PMC - PubMed
    1. Gravbrot et al.Therapeutic Monoclonal Antibodies Targeting Immune Checkpoints for the Treatment of Solid Tumors. Antibodies 8, 51 (2019). - PMC - PubMed
    1. Czajka TF, Vance DJ & Mantis NJ Slaying SARS-CoV-2 One (Single-domain) Antibody at a Time. Trends Microbiol. 29, 195–203 (2021). - PMC - PubMed
    1. Byrne B, Stack E, Gilmartin N & O’Kennedy R Antibody-Based Sensors: Principles, Problems and Potential for Detection of Pathogens and Associated Toxins. Sensors 9, 4407–45 (2009). - PMC - PubMed
    1. Yao H et al.Patient-derived SARS-CoV-2 mutations impact viral replication dynamics and infectivity in vitro and with clinical implications in vivo. Cell Discov. 6, 76 (2020). - PMC - PubMed

Additional Online Methods References

    1. Gunge N & Sakaguchi K Intergeneric transfer of deoxyribonucleic acid killer plasmids, pGKl1 and pGKl2, from Kluyveromyces lactis into Saccharomyces cerevisiae by cell fusion. J. Bacteriol 147, 155–160 (1981). - PMC - PubMed
    1. Gietz RD & Schiestl RH High-efficiency yeast transformation using the LiAc/SS carrier DNA/PEG method. Nat. Protoc 2, 31–34 (2007). - PubMed
    1. Lee ME, DeLoache WC, Cervantes B & Dueber JE A Highly Characterized Yeast Toolkit for Modular, Multipart Assembly. ACS Synth. Biol 4, 975–986 (2015). - PubMed
    1. Radoshitzky SR et al.Transferrin receptor 1 is a cellular receptor for New World haemorrhagic fever arenaviruses. Nature 446, 92–6 (2007). - PMC - PubMed
    1. Zhang F et al.Efficient construction of sequence-specific TAL effectors for modulating mammalian transcription. Nat. Biotechnol 29, 149–153 (2011). - PMC - PubMed

Publication types

MeSH terms