. 2021 Aug;22(8):1052-1063.
doi: 10.1038/s41590-021-00958-6. Epub 2021 Jun 24.

Intratumoral follicular regulatory T cells curtail anti-PD-1 treatment efficacy

Affiliations

Intratumoral follicular regulatory T cells curtail anti-PD-1 treatment efficacy

Simon Eschweiler et al. Nat Immunol. 2021 Aug.

Abstract

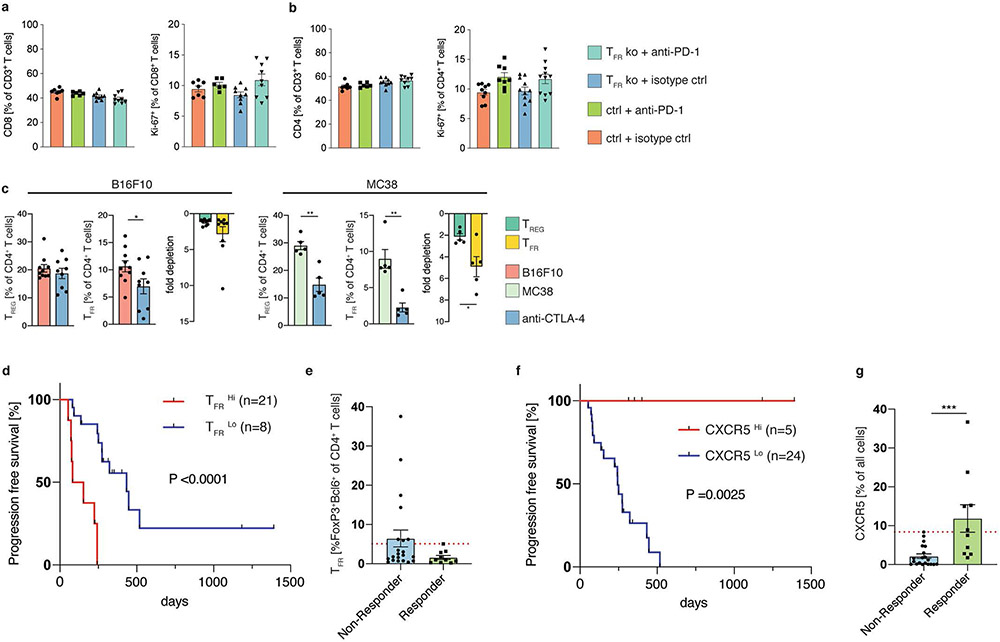
Immune-checkpoint blockade (ICB) has shown remarkable clinical success in boosting antitumor immunity. However, the breadth of its cellular targets and specific mode of action remain elusive. We find that tumor-infiltrating follicular regulatory T (TFR) cells are prevalent in tumor tissues of several cancer types. They are primarily located within tertiary lymphoid structures and exhibit superior suppressive capacity and in vivo persistence as compared with regulatory T cells, with which they share a clonal and developmental relationship. In syngeneic tumor models, anti-PD-1 treatment increases the number of tumor-infiltrating TFR cells. Both TFR cell deficiency and the depletion of TFR cells with anti-CTLA-4 before anti-PD-1 treatment improve tumor control in mice. Notably, in a cohort of 271 patients with melanoma, treatment with anti-CTLA-4 followed by anti-PD-1 at progression was associated with better a survival outcome than monotherapy with anti-PD-1 or anti-CTLA-4, anti-PD-1 followed by anti-CTLA-4 at progression or concomitant combination therapy.


Figures

Extended Data Fig. 1 ∣
Extended Data Fig. 1 ∣. Selection criteria for the integrated single-cell analysis and gating strategies.
a, Violin plots depicting single-cell expression levels for BCL6, CXCR5 and FOXP3 transcripts (left panel) in tumor-infiltrating CD4+ T cells of an exemplary dataset; dotted lines indicate threshold used for defining positive cells. The scatter plot (right panel) shows expression levels of BCL6 and CXCR5 transcripts in FOXP3-expressing CD4+ T cells b, Gating strategy (surface panel) to sort tumor-infiltrating TREG (LINCD45+CD3+CD4+CXCR5CD127CD25+) and TFR (LINCD45+CD3+CD4+CXCR5+GITR+) cells is shown in the representative FACS plots. c, Gating strategy (intracellular panel) to identify tumor-infiltrating TREG (LINCD45+CD3+CD4+CXCR5FOXP3+BCL-6) and TFR (LINCD45+CD3+CD4+BCL-6+FOXP3+) cells is shown in the representative FACS plots. d, Representative immunohistochemistry staining for one of the ten NSCLC patients in (Fig. 1d-i) is shown, PanCK (white), CD4 (light blue), CXCR5 (yellow), CD20 (magenta) FOXP3 (green) and BCL-6 (red), scale bars are 25 μm.
Extended Data Fig. 2 ∣
Extended Data Fig. 2 ∣. Transcriptome analysis of murine TFR cells and characterization of TFR cells in murine tumors.
a, Schematic of immunization model in which mice were immunized intraperitoneally (i.p.) with Ovalbumin in complete Freund’s adjuvant, Ovalbumin in Monophosphoryl Lipid A or mock PBS. b, tSNE plot of TEFF (CD19CD45+CD3+CD4+CXCR5GITRCD25CD62LCD44+), TREG (CD19CD45+CD3+CD4+CXCR5GITR+CD25+), TFH (CD19CD45+CD3+CD4+CXCR5+GITR) and TFR (CD19CD45+CD3+CD4+CXCR5+GITR+). Each symbol represents data from an individual mouse sample (n = 9 for TEFF, n = 11 for TREG, n = 11 for TFH, n = 11 for TFR) that passed quality controls. c, Euler diagrams show the overlap of differentially expressed genes (left, upregulated in TFR, right, downregulated in TFR) in TFR cells compared to the indicated cell types. d, Heatmap comparing gene signatures of TEFF, TREG, TFH and TFR cells. Depicted are transcripts that change in expression more than 2-fold with a DEseq2 adjusted-P value of ≤ 0.05. e, Log-transformed RNA-seq expression values for each of the indicated differentially expressed genes. Each symbol represents an individual sample, data are mean +/− s.e.m. f, Representative histogram plot showing MFI of the surface expression of indicated markers in human tumor-infiltrating TFR cells (n = 4).
Extended Data Fig. 3 ∣
Extended Data Fig. 3 ∣. Transcriptome analysis of human tumor-infiltrating TFR cells.
a, Weighted gene co-expression network analysis (WGCNA) depicted as a Topological Overlap Matrix (TOM) heatmap. It included all genes used in the WGCNA analysis and each row and column correspond to a single gene. Red color indicates the degree of topological overlap. The signed network was generated with bulk RNA-seq data of sorted cells enriched for tumor-infiltrating TREG (LINCD45+CD3+CD4+CXCR5CD127CD25+) and TFR (LINCD45+CD3+CD4+CXCR5+GITR+) populations respectively from 10 treatment naïve NSCLC patients (as described in Fig. 2a-d). b, Spearman correlation analysis of the modules identified in (a), depicting module correlation with TFR phenotype. Genes in the pink module are visualized in Gephi, BCL6 and FOXP3 are highlighted. c, Ingenuity pathway analysis of genes in pink module (b). Shown are the top 5 canonical pathways ordered by P value. d, flow cytometric analysis of the frequency (upper panel, P = 0.002 for indicated comparison) and MFI (lower panel, P = 0.002 for indicated comparison) of Ki67-expressing cells, representative histogram plots (right panel) for tumor-infiltrating CD8+ T cells, TREG and TFR cells from n = 10 NSCLC patient samples (described in Fig. 1e,f). e, Heatmap comparing gene expression signatures of enriched population of tumor-infiltrating TREG cells (green) and TFR cells (yellow). Depicted are transcripts that change in expression more than 2-fold with an adjusted-P value of ≤ 0.05. f, Weighted gene co-expression network analysis visualized in Gephi, the nodes are colored and sized according to the number of edges (connections), and the edge thickness is proportional to the edge weight (strength of correlation). The top 10 most differentially expressed genes between TREG and TFR cells are highlighted. g, flow cytometric analysis of the frequency of tumor-infiltrating TCF-1+ TREG and TFR cells from n = 5 NSCLC patient samples, P = 0.0159). Data are mean +/− s.e.m. Significance for comparisons were computed using two-tailed Wilcoxon matched-pairs signed-rank test between TREG and TFR cells (d) or two-tailed Mann–Whitney test (g).
Extended Data Fig. 4 ∣
Extended Data Fig. 4 ∣. Cell-trajectory analysis of human TREG and TFR cells from primary tumor tissue and metastasized tumor-infiltrated lymph nodes.
a, Single-cell pseudotime trajectory of cells in cluster 1 (TREG cells) and cluster 6 (TFR cells) (left) or cells from primary tumor tissue or metastatic tumor-infiltrated lymph nodes (right) constructed using the Monocle3 algorithm. b, Normalized gene expression of IL1R2, CCR8, TNFRSF9, TNFRSF18 and PDCD1 on pseudotime path as in (a).
Extended Data Fig. 5 ∣
Extended Data Fig. 5 ∣. TCR-seq analysis of tumor-infiltrating TREG and TFR cells.
a, the pie chart illustrates the mean percentage of TFR clonotypes that were shared with TREG cells (light blue) and non-TREG cells (gray) respectively, from 4 patients with the highest numbers of clonally expanded FOXP3-expressing cells from a published single-cell RNA-seq dataset. The lower panel plot displays the percentage of TFR clonotypes that overlap with 4-1BB or 4-1BB+ tumor-infiltrating TREG cells. b, Euler diagram depicting the degree of clonal overlap between TREG, TFH and TFR cells. c, Representative TraCer plot of patient 1010 depicting all clonally expanded cells, color indicates the type of tumor-infiltrating CD4+ T cells: non-TREG (gray, FOXP3), 4-1BB TREG (green), 4-1BB+ TREG (red) and TFR (yellow) cells. d, Single-cell pseudotime trajectory of 4-1BB, 4-1BB+ TREG, clonally expanded, TCR-sharing TREG and TFR cells (indicated with colored circles) constructed using the Monocle3 algorithm. e, Correlation of Monocle component 1 (x-axis) with the genes commonly unregulated in 4-1BB+ TREG, clonally expanded, TCR-sharing TREG and TFR cells compared to 4-1BB TREG cells (y-axis). The solid line represents LOESS fitting between the shared signature and Monocle component 1. f, flow cytometric analysis of the frequency (left panel, P = 0.002 for indicated comparison), MFI (middle panel, P = 0.002 for indicated comparison) for 4-1BB expression in tumor-infiltrating CD8+ T cells, TREG and TFR cells (n = 10 treatment naïve NSCLC patients as in Fig. 2a-d). Data are mean +/− s.e.m. Significance for comparisons were computed using two-tailed Wilcoxon matched-pairs signed-rank test between TREG and TFR cells.
Extended Data Fig. 6 ∣
Extended Data Fig. 6 ∣. Characterization of murine TFR cells in an immunization and cancer setting.
a, Gating strategy to identify tumor-infiltrating TREG (CD19CD45+CD3+CD4+BCL-6FOXP3+) and TFR (CD19CD45+CD3+CD4+BCL-6+FOXP3+) cells in B16F10-OVA inoculated mice at d21 (upper panel), shown are representative FACS plots. The FACS plots in the lower panel illustrate intracellular expression of BCL-6 in the indicated cell types (left panel), expression of GITR (middle upper panel), KI-67 (right upper panel), PD-1 (middle lower panel), and CTLA-4 (right lower panel) versus FOXP3 in CD4+ T cells. b, Contour plots depicting the expression levels of FOXP3 in the indicated cell populations from (Fig. 4d). c, Luminex analysis of supernatants from an in vitro proliferation assay (repeat of in vitro suppression assay experiment in Fig. 4g,h), depicted is the concentration of secreted IFN-γ, IL-2 and TNF. d, Flow-cytometric analysis of the frequency of tumor-infiltrating TREG and TFR cells (P = 0.0025 in MC38-OVA, n = 5 mice for day 14 and n = 7 mice for day 21; P = 0.0017 in B16F10-OVA, n = 10 mice for day 14 and n = 6 mice for day 21) in indicated tumor models at indicated time points. Data are mean +/− s.e.m., Significance for comparisons were computed using two-tailed Mann–Whitney test (d). Data in b-d are representative of two independent experiments.
Extended Data Fig. 7 ∣
Extended Data Fig. 7 ∣. Human TFR cells are responsive to anti-PD-1 therapy.
a, Heatmap comparing gene signatures of human tumor-infiltrating TFR cells pre- (n = 21 patients) and post- (n = 26 patients) anti-PD-1 therapy. TFR cells from 5 patients (P2, P3, P12, P15, P20) receiving anti-PD-1 monotherapy were combined. IPA analysis of transcripts (n = 98) more highly expressed post anti-PD-1 treatment (right upper panel) and transcripts that overlap with CD28 signaling, ICOS-ICOSL signaling and T cell receptor signaling are highlighted (right lower panel and heatmap). b-i, Mice were s.c. inoculated with B16F10-OVA cells and treated with tamoxifen (days 5-8 and days 11-14) and anti-PD-1 Abs (day 9). Tumor volume (b,f), TFR cell frequencies (c, P = n.s., g, P = 0.035), eGFP cell frequencies (d, P = 0.0025, h, P = 0.0012) and FOXP3 frequencies (e,i) for n = 6 Foxp3eGFP-cre-ERT2 mice, n = 7 Foxp3eGFP-cre-ERT2/wt x Bcl6fl/fl mice, n = 7 Foxp3eGFP-cre-ERT2 mice and n = 5 Foxp3eGFP-cre-ERT2/wt mice. Data are mean +/− s.e.m., Significance for comparisons were computed using two-tailed Mann–Whitney test (b-i). Data in b-i are representative of two independent experiments.
Extended Data Fig. 8 ∣
Extended Data Fig. 8 ∣. Murine TFR cells are depleted by anti-CTLA-4 thereapy.
a,b, Foxp3YFPcre/YFPcreBcl6fl/fl (TFR knockout) mice or Foxp3YFPcre/YFPcre Bcl6+/+ control mice were s.c. inoculated with B16F10-OVA cells and treated with isotype control or anti-PD-1 Abs at indicated time points, frequency and Ki-67 expression of CD8+ T cells and CD4+ T cells in tumor-draining lymph nodes of mice treated as indicated in, n = 7 mice for ctrl+isotype ctrl, n = 6 mice for ctrl+anti-PD-1, n = 9 mice for the two TFR ko groups. c, Mice were s.c. inoculated with B16F10-OVA or MC38-OVA cells and treated with anti-CTLA-4 Abs at day 10 and day 13. Flow-cytometric analysis of the frequency of tumor-infiltrating TREG and TFR cells, as well as fold depletion of both cell types following anti-CTLA-4 therapy in the B16F10-OVA model (left panel, n = 9 mice, P = 0.0435) and MC38-OVA model (right panel, n = 5 mice, P = 0.0079). d, Survival curves of an independent cohort of melanoma patients (n = 29) stratified into TFRhi (>5.075% of CD4+ cells co-expressing FOXP3 and BCL-6) and TFRlo (<5.075% of cells co-expressing FOXP3 and BCL-6) e, IHC analysis of the frequency of FOXP3+BCL6+ TFR cells with a cutoff (orange line) set to upper limit of normal of 5.075% pertaining to (Extended Data Fig. 8d), P = 0.0654. f, Survival curves of melanoma patients stratified into CXCR5hi (frequency of CXCR5 + cells >8.336%) and CXCR5lo (frequency of CXCR5 + cells <8.336%). g, IHC analysis of the frequency of CXCR5+ cells with a cutoff (orange line) set to upper limit of normal of 8.375% pertaining to (Extended Data Fig. 8f), P = 0.0002. Data are mean +/− s.e.m., Significance for comparisons were computed using two-tailed Mann–Whitney test (c,e,g) or Mantel–Cox test (d,f). Data in (a–c) are representative of two independent experiments.
Fig. 1 ∣
Fig. 1 ∣. Tumor-infiltrating TFR cells are highly prevalent in human cancers.
a, Integrated analysis of nine single-cell RNA-seq datasets from six different cancer types displayed by UMAP. Seurat clustering of 25,149 CD4+ T cells colored based on cluster type (left) and study (middle). Seurat-normalized expression of FOXP3 in different clusters (right; see also Extended Data Fig. 1 and Methods). b,c, Frequency of FOXP3 and FOXP3+ (TREG) cells in tumor-infiltrating CD4+ T cells (b), and BCL6+ TFR, CXCR5+ TFR and BCL6+CXCR5+ TFR in tumor-infiltrating TREG cells (c) in the assessed datasets. The sequencing technologies employed (10x Genomics, MARS and Smart sequencing) in the different datasets are indicated.
Fig. 2 ∣
Fig. 2 ∣. Tumor-infiltrating TFR cells are primarily located in the TLS.
ad, Flow-cytometric analysis of CD4+ T, TREG, TFH and TFR cells from n = 10 treatment-naive patients with NSCLC. FMO, fluorescence minus one control. Representative contour plots (a) and histogram plots (bd) of CD8+ and CD4+ TILs are shown. a, Frequency of CD8+ T (LINCD45+CD3+CD8+), TREG (LINCD45+CD3+CD4+CXCR5CD127CD25+), TFH (LINCD45+CD3+CD4+CXCR5+GITR) and TFR (LINCD45+CD3+CD4+CXCR5+GITR+) cells (left). The numbers in the contour plots (right) indicate the percentage of cells in the outlined areas. b, Frequency and mean fluorescence intensity (MFI) of CD25 and ICOS (CD25, P = 0.002 and 0.0137 for the frequency and MFI, respectively; and ICOS, P = 0.0645 and 0.0039 for the frequency and MFI, respectively, of the indicated comparisons). c, Intracellular CTLA-4 expression and MFI in TREG (LINCD45+CD3+CD4+CXCR5FOXP3+BCL-6), TFH (LINCD45+CD3+CD4+BCL-6+FOXP3) and TFR (LINCD45+CD3+CD4+BCL-6+FOXP3+) cells (P = 0.0039 and 0.0020 for the frequency and MFI, respectively, of the indicated comparisons). d, Frequency and MFI of PD-1 expression (P = 0.0020 for the indicated comparisons in the frequency and MFI plots). e, Whole-slide multiplexed immunohistochemistry analyses of TREG and TFR cells in NSCLC tissue sections from the patients in ad (left and middle). The micrographs show PanCK, CD4, CXCR5, CD20, FOXP3 and BCL-6 staining. The pink arrows indicate CD4+FOXP3+BCL-6+ TFR cells in a region of interest that was selected for the high density of TFR cells. Scale bars, 250 μm (left) and 25 μm (middle). i, Zoomed-in area shown in the top middle images. ii, Zoomed-in area shown in the bottom middle images. The proportion of FOXP3 and FOXP3+ CD4+ T cells (top right), and TREG and TFR cells (bottom right) from the whole-slide histocytometry analyses of each sample from ad are shown. f, Proportion of TREG and TFR cells in the tumor stroma and TLS (P = 0.0002 for both TREG and TFR) from whole-slide histocytometry analyses for n = 8 treatment-naive patients with NSCLC. All data are the mean ± s.e.m. Statistical analyses were performed using a two-tailed Wilcoxon matched-pairs signed-rank test between TREG and TFR cells (bd) and two-tailed Mann–Whitney test between TLS and stroma localization for TREG and TFR cells (f); *P < 0.05, **P < 0.01 and ***P < 0.001.
Fig. 3 ∣
Fig. 3 ∣. Comparison of human tumor-infiltrating TREG and TFR cells.
a, Analysis of 10x Genomics single-cell RNA-seq data, displayed by UMAP. Seurat clustering of 8,722 CD4+ and CD8+ T cells from primary tumor tissue and metastasized tumor-infiltrated lymph nodes colored according to the cluster type (left). The other three panels show the Seurat-normalized expression of CD8B, CD4 and FOXP3. b, Heatmap comparing the gene expression of the cells in clusters 1 and 6. Transcripts that change in expression more than 0.25-fold with an adjusted P ≤ 0.05 are depicted. c,d, Gene-set enrichment analysis for follicular-feature (c) and TFR-feature genes (d; derived from Fig. 3j) for cells in clusters 1 and 6 ordered by the log2-transformed fold-change value. e, Ingenuity pathway analysis of transcripts that are differentially expressed (n = 1,245) between clusters 1 and 6. f, Comparison of the expression levels of the indicated transcripts in the cells in clusters 1 (left) and 6 (right). CPM, counts per million. g, TraCer plots of all clonally expanded cells (≥2 clonotypes) in clusters 1 and 6 colored according to the cluster origin. h, Euler diagram showing the overlap between clonotypes in clusters 1 and 6. i, Mean percentage of clonally expanded cells in clusters 1 and 6. j, Heatmap illustrating the intersection of genes that were differentially expressed (with mean transcripts per million (TPM) > 25) when comparing 4-1BB TREG cells with three populations: 4-1BB+ TREG cells, clonally expanded TREG cells sharing their TCRs with TFR cells, and clonally expanded TFR cells (the distinct cell populations are indicated with colored bars). Genes linked to immunosuppressive function, co-stimulation and tissue residency are highlighted.
Fig. 4 ∣
Fig. 4 ∣. Frequency and functional responsiveness of TFR cells in murine tumor models.
ac, Mice were inoculated with B16F10-OVA or MC38-OVA cells subcutaneously (s.c.) on the right flank. Analyses of tumor-infiltrating TREG (CD19CD45+CD3+CD4+BCL-6FOXP3+) and TFR (CD19CD45+CD3+CD4+BCL-6+FOXP3+) cells were performed. a, Flow-cytometric analysis of the frequency of tumor-infiltrating TREG and TFR cells in the two tumor models at day 21 after tumor inoculation (n = 6 (B16F10) and 7 (MC38) mice). b, Flow-cytometric analysis of the MFI and frequencies of expression of KI-67 (P = 0.002), TCF-1 (P = 0.002) and 4-1BB (P = 0.002) in the two cell types in the B16F10-OVA model at day 14 after tumor inoculation (n = 10 mice per group). c, Representative FACS contour plots depicting the expression of TOX and TCF-1 in CD8+ T cells, TREG cells and TFR cells (left). Flow-cytometric analysis of the frequency of TOX-expressing cells in the indicated cell types in the B16F10-OVA model at day 14 (right; n = 10 mice per group). d, Mice were intraperitoneally (i.p.) immunized with OVA in alum and treated with a complex of IL-2 and anti-IL-2 receptor (IL-2R) on days 3, 4 and 5 for in vivo TREG cell expansion. Representative FACS plots characterizing splenic TREG (CD4+CXCR5CD25+GITR+) and TFR (CD4+CXCR5+CD25+GITR+) cells are shown. e, Representative histogram plots depicting the dilution of CellTrace Violet (CTV) in CD8+ T cells with or without the addition of TREG or TFR cells. ce, The percentages of cells in each quadrant (c) or in the outlined regions (d,e) are shown. f, Flow-cytometric analysis of an in vitro proliferation assay showing the frequency of proliferating CD8+ T cells when co-cultured with different proportions of TREG or TFR cells. Results for n = 3 technical replicates for the dilutions and n = 4 technical replicates for CD8+ T cells (1:0 dilution) are depicted. g, Concentration of secreted IFN-γ, IL-2 and TNF in the supernatants of the in vitro proliferation assays in e,f, determined using Luminex analysis; n = 2 technical replicates. h, Fold-change reduction in the secretion of the indicated cytokines between TREG and TFR cells at a 4:1 ratio of CD8+ T cells to either TREG or TFR cells. i, The indicated cells were transferred into B16F10-OVA tumor-bearing Rag1−/− recipient mice on day 3 after tumor inoculation. The tumor volume of the mice treated as indicated is shown (n = 5 mice per group). Data are the mean ± s.e.m.; all data are representative of two independent experiments. Statistical significance for the comparisons was computed using a two-tailed Mann–Whitney test; **P < 0.01 and ****P < 0.0001.
Fig. 5 ∣
Fig. 5 ∣. Intratumoral TFR cells gradually increase over time.
a, Analysis of 10x Genomics single-cell RNA-seq data. Seurat clustering of tumor-infiltrating FOXP3-expressing T cells colored according to the cluster type. UMAPs of tumor-infiltrating FOXP3-expressing T cells on days 11 (left) and 18 (middle). The proportion of cells in individual mice, (i)–(iv), at the indicated time points are shown (right). The percentage of cells in cluster 2 (TFR cells) is depicted. b, Heatmap showing genes that are enriched in the identified clusters. Transcripts with a significant change in expression (>twofold and adjusted P ≤ 0.05) are depicted. c, Proportion of cells in each cluster, colored according to the developmental stage of the tumor. d,e, Gene-set enrichment analysis for a T cell activation signature (d) as well as TFH (e; derived from Extended Data Fig. 2a-e) and TFR (e; derived from Fig. 2j and Extended Data Fig. 2a-e) signature genes for the cells in cluster 2 versus the other clusters, ordered by the log2-transformed fold change. f, Volcano plot of cells in cluster 2 versus the other clusters. Differentially expressed transcripts (adjusted P ≤ 0.05) that change in expression more than twofold are depicted. FDR, false discovery rate; dashed lines depict the threshold used for fold change and FDR. g, Average transcript expression (color scale) and percentage of expressing cells (size scale) for select genes in each cluster. h, Euler diagram showing the overlap between the clonotypes in cluster 2 and the other clusters. i, Single-cell pseudotime trajectory analysis of tumor-infiltrating FOXP3-expressing T cells (a) constructed using the Monocle3 algorithm. j, Flow-cytometric analysis depicting the MFI of the expression of PD-1 (P = 0.002) and CTLA-4 (P = 0.002) in the indicated cell types in the B16F10-OVA model on day 14 after tumor inoculation. Representative histogram plots are displayed. Data are the mean ± s.e.m.; data are representative of two independent experiments. Statistical significance of the comparisons was computed using a two-tailed Wilcoxon matched-pairs signed-rank test; **P < 0.01.
Fig. 6 ∣
Fig. 6 ∣. TFR cells are highly responsive to ICB.
a, Mice were s.c. inoculated with B16F10-OVA or MC38-OVA cells and treated with anti-PD-1 at the indicated time points. Flow-cytometric analysis of the frequency of tumor-infiltrating TREG and TFR cells as well as fold induction of both cell types following anti-PD-1 therapy in the B16F10-OVA model (left; n = 9 mice per group) and MC38-OVA (right; n = 5 mice per group) model. b,c, Foxp3YFP–cre/YFP–cre Bcl6fl/fl (TFR knockout) and Foxp3YFP–cre/YFP–cre Bcl6+/+ control mice were s.c. inoculated with B16F10-OVA cells and treated with isotype control or anti-PD-1 at the indicated time points. Tumor volume (b) and frequency of granzyme B (GzmB)+CD8+ T cells in the tumor-draining lymph nodes of the mice (c); n = 7–9 mice per group. d, Mice were i.p. immunized with OVA in alum and additionally treated with an IL-2/anti-IL-2R complex at days 3, 4 and 5. OT-I CD8+ T cells and eGFP+ and YFP+ TREG cells were adoptively transferred into B16F10-OVA tumor-bearing Rag1−/− mice on day 3 after tumor inoculation. Representative contour plots and the frequencies of eGFP and YFP cells in the spleen (left; P = 0.007) and tumor tissue (right; P = 0.0006) are shown for n = 7 mice. e, Flow-cytometric analysis of BCL-6 expression in splenic CD4+FOXP3+ cells of Foxp3YFP–cre × Bcl6fl/fl and Foxp3eGFP mice as well as tumor-infiltrating CD4+FOXP3+ cells 13 days after adoptive transfer into B16F10-OVA tumor-bearing Rag1−/− mice. f, Mice were i.p. immunized with OVA in alum and additionally treated with an IL-2/anti-IL-2R complex at days 3, 4 and 5. OT-I CD8+ T cells and RFP+ and YFP+ TREG cells were adoptively transferred into B16F10-OVA tumor-bearing Rag1−/− mice on day 3 after tumor inoculation. Representative contour plots and the frequencies of RFP+ and YFP+ cells in the spleen (left; P = 0.0087) and tumor tissue (right; P = 0.0022) are shown for n = 6 mice per group. d,f, The numbers in the contour plots indicate the percentage of cells in the outlined areas. Data are the mean ± s.e.m.; all data are representative of two independent experiments. Statistical significance was computed using a two-tailed Mann–Whitney test (a,b,d,f) or one-way analysis of variance (ANOVA) comparing the mean of each group with the mean of the control group (control + anti-PD-1), followed by Dunnett’s test (c); *P < 0.05, **P < 0.01 and ***P < 0.001.
Fig. 7 ∣
Fig. 7 ∣. Clinical benefit of sequential ICB.
ac, Mice were s.c. inoculated with B16F10-OVA cells and treated with anti-CTLA-4 (days 10 and 13; n = 8 mice), anti-PD-1 (days 14 and 17; n = 10 mice), anti-CTLA-4 (days 10 and 13) and anti-PD-1 (days 14 and 17; n = 8 mice), or isotype control at the respective time points (n = 13 mice). a,b, Tumor volume (a) and cell frequencies (b) of the mice treated as indicated. Data are the mean ± s.e.m. and are representative of two independent experiments. Not significant, P = 0.1234; *P = 0.0332; ***P = 0.0002; and ****P < 0.0001. c, Survival curves of an independent cohort of patients with melanoma (n = 271) stratified into five groups based on the ICB treatment regimen. d,e, Survival curves for patients with early onset (d; M1a and M1b combined) and late-stage (e; M1c and M1d combined) disease and according to their BRAF-mutation status (f). Statistical significance was computed using a two-tailed Mann–Whitney test (a); one-way ANOVA to compare the mean of each group with the mean of the control group (B16F10), followed by a Dunnett’s test (b) or Mantel–Cox test (ce).

References

    1. De Simone M et al. Transcriptional landscape of human tissue lymphocytes unveils uniqueness of tumor-infiltrating T regulatory cells. Immunity 45, 1135–1147 (2016). - PMC - PubMed
    1. Linterman MA et al. Foxp3+ follicular regulatory T cells control the germinal center response. Nat. Med 17, 975–982 (2011). - PMC - PubMed
    1. Sage PT, Paterson AM, Lovitch SB & Sharpe AH The coinhibitory receptor CTLA-4 controls B cell responses by modulating T follicular helper, T follicular regulatory, and T regulatory cells. Immunity 41, 1026–1039 (2014). - PMC - PubMed
    1. Sage PT, Alvarez D, Godec J, Von Andrian UH & Sharpe AH Circulating T follicular regulatory and helper cells have memory-like properties. J. Clin. Invest 124, 5191–5204 (2014). - PMC - PubMed
    1. Sage PT, Francisco LM, Carman CV & Sharpe AH The receptor PD-1 controls follicular regulatory T cells in the lymph nodes and blood. Nat. Immunol 14, 152–161 (2013). - PMC - PubMed

Publication types

MeSH terms