. 2021 Jul;22(7):839-850.
doi: 10.1038/s41590-021-00956-8. Epub 2021 Jun 24.

The cellular architecture of the antimicrobial response network in human leprosy granulomas

Affiliations

The cellular architecture of the antimicrobial response network in human leprosy granulomas

Feiyang Ma et al. Nat Immunol. 2021 Jul.

Abstract

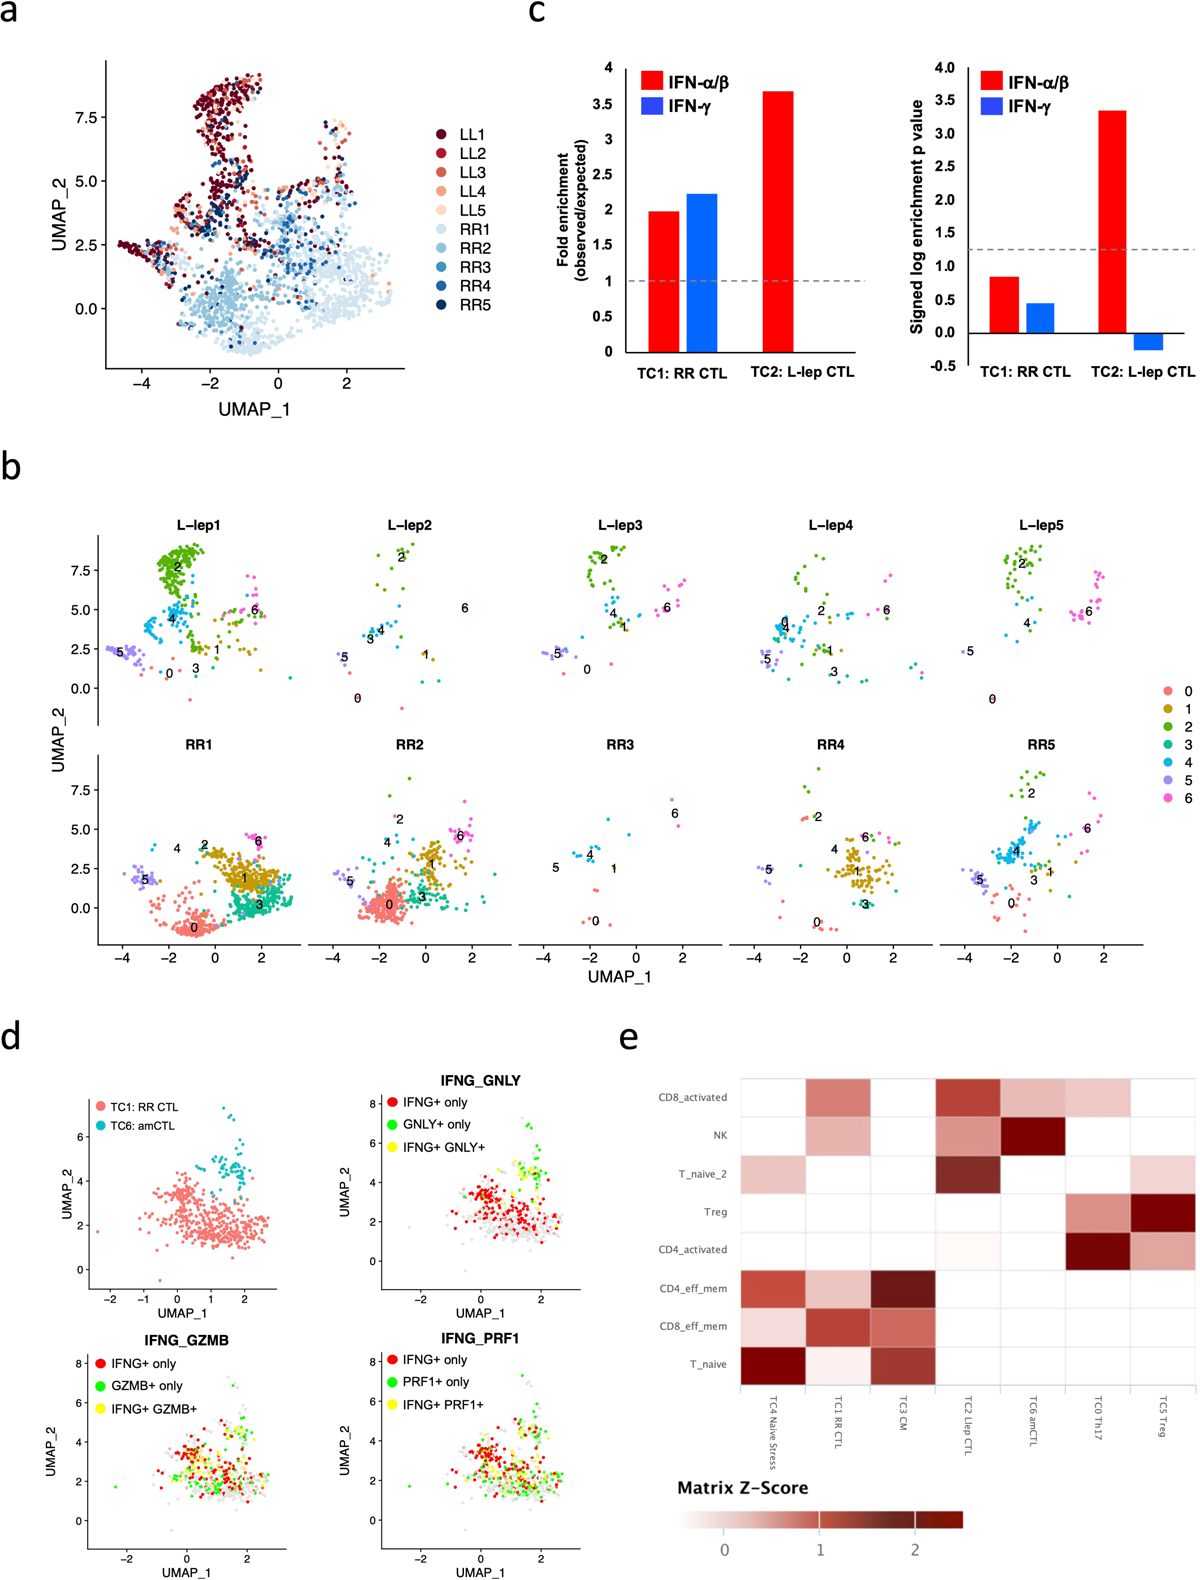
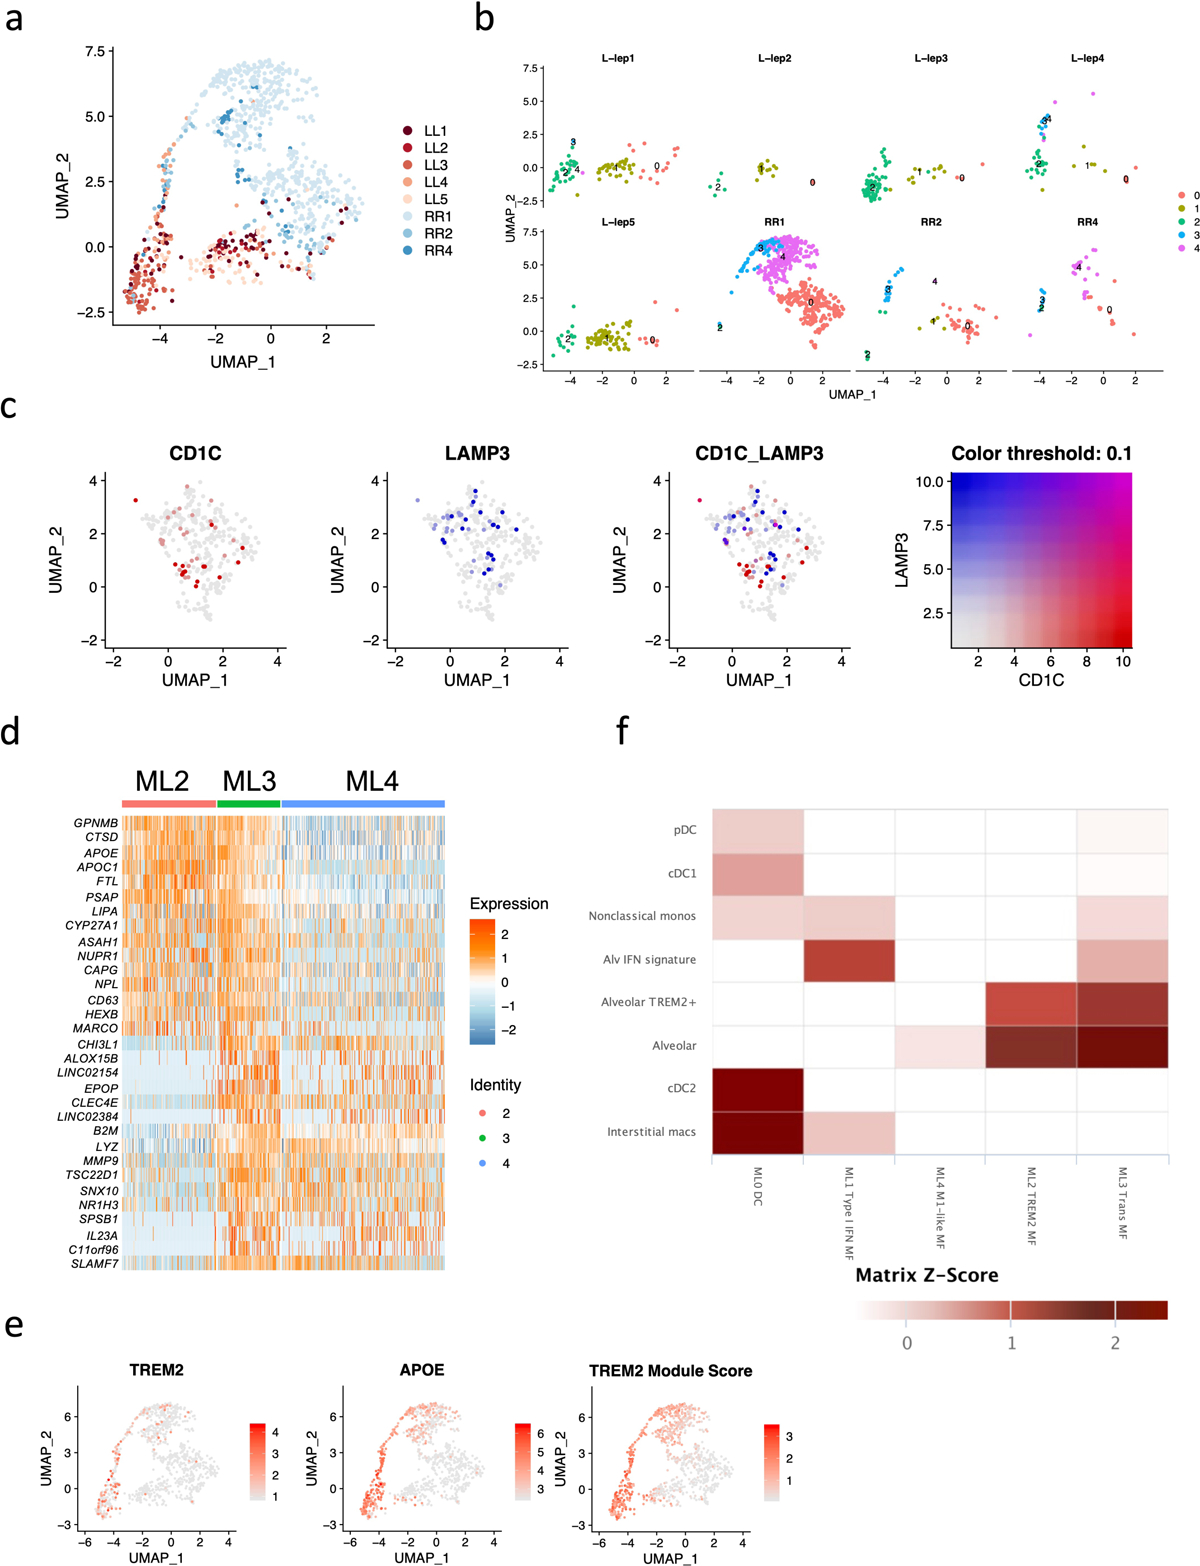
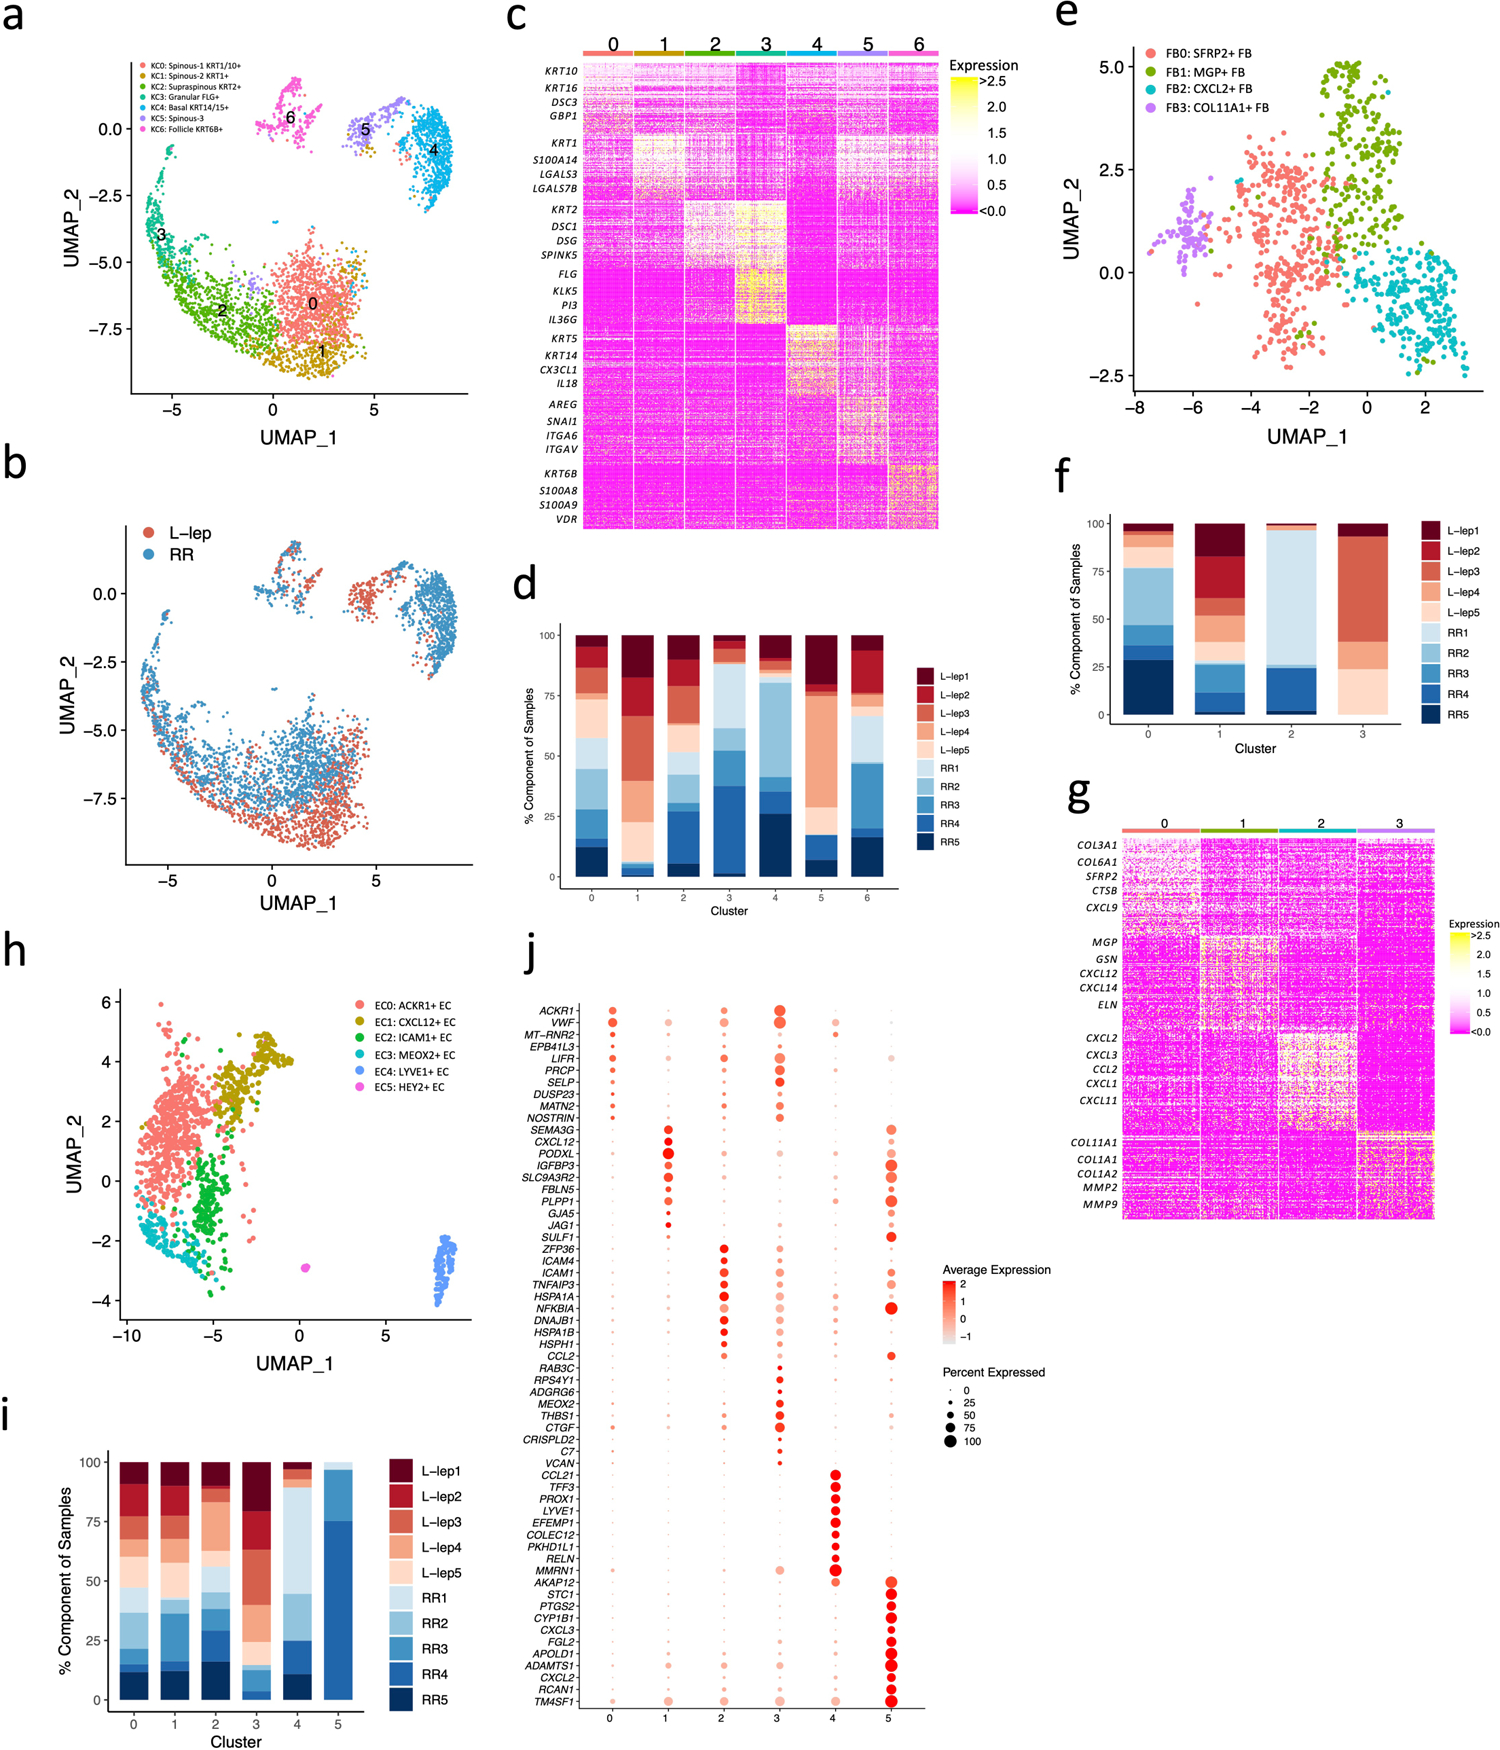
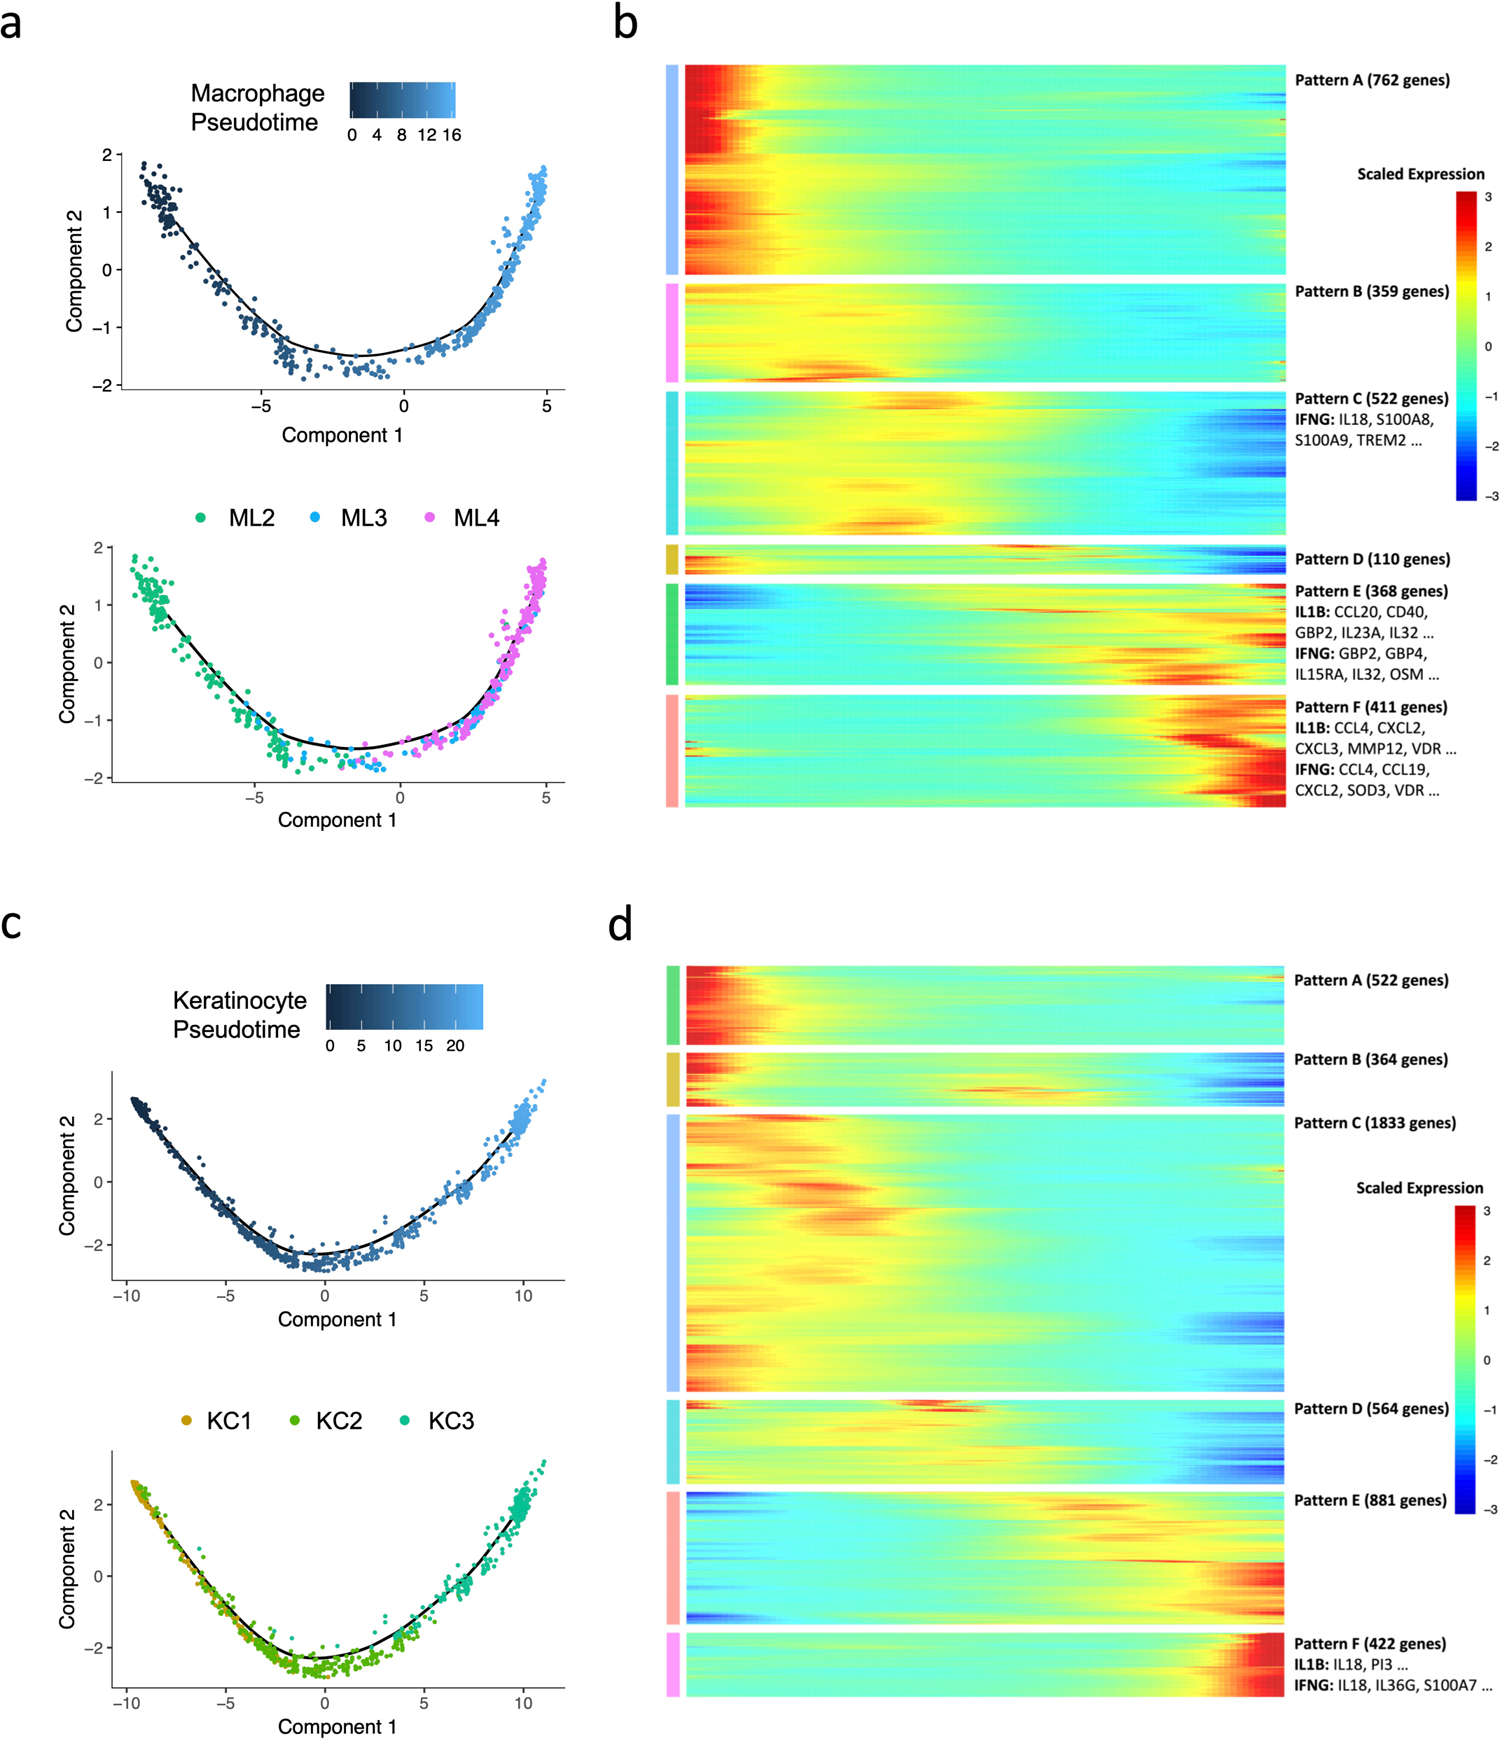
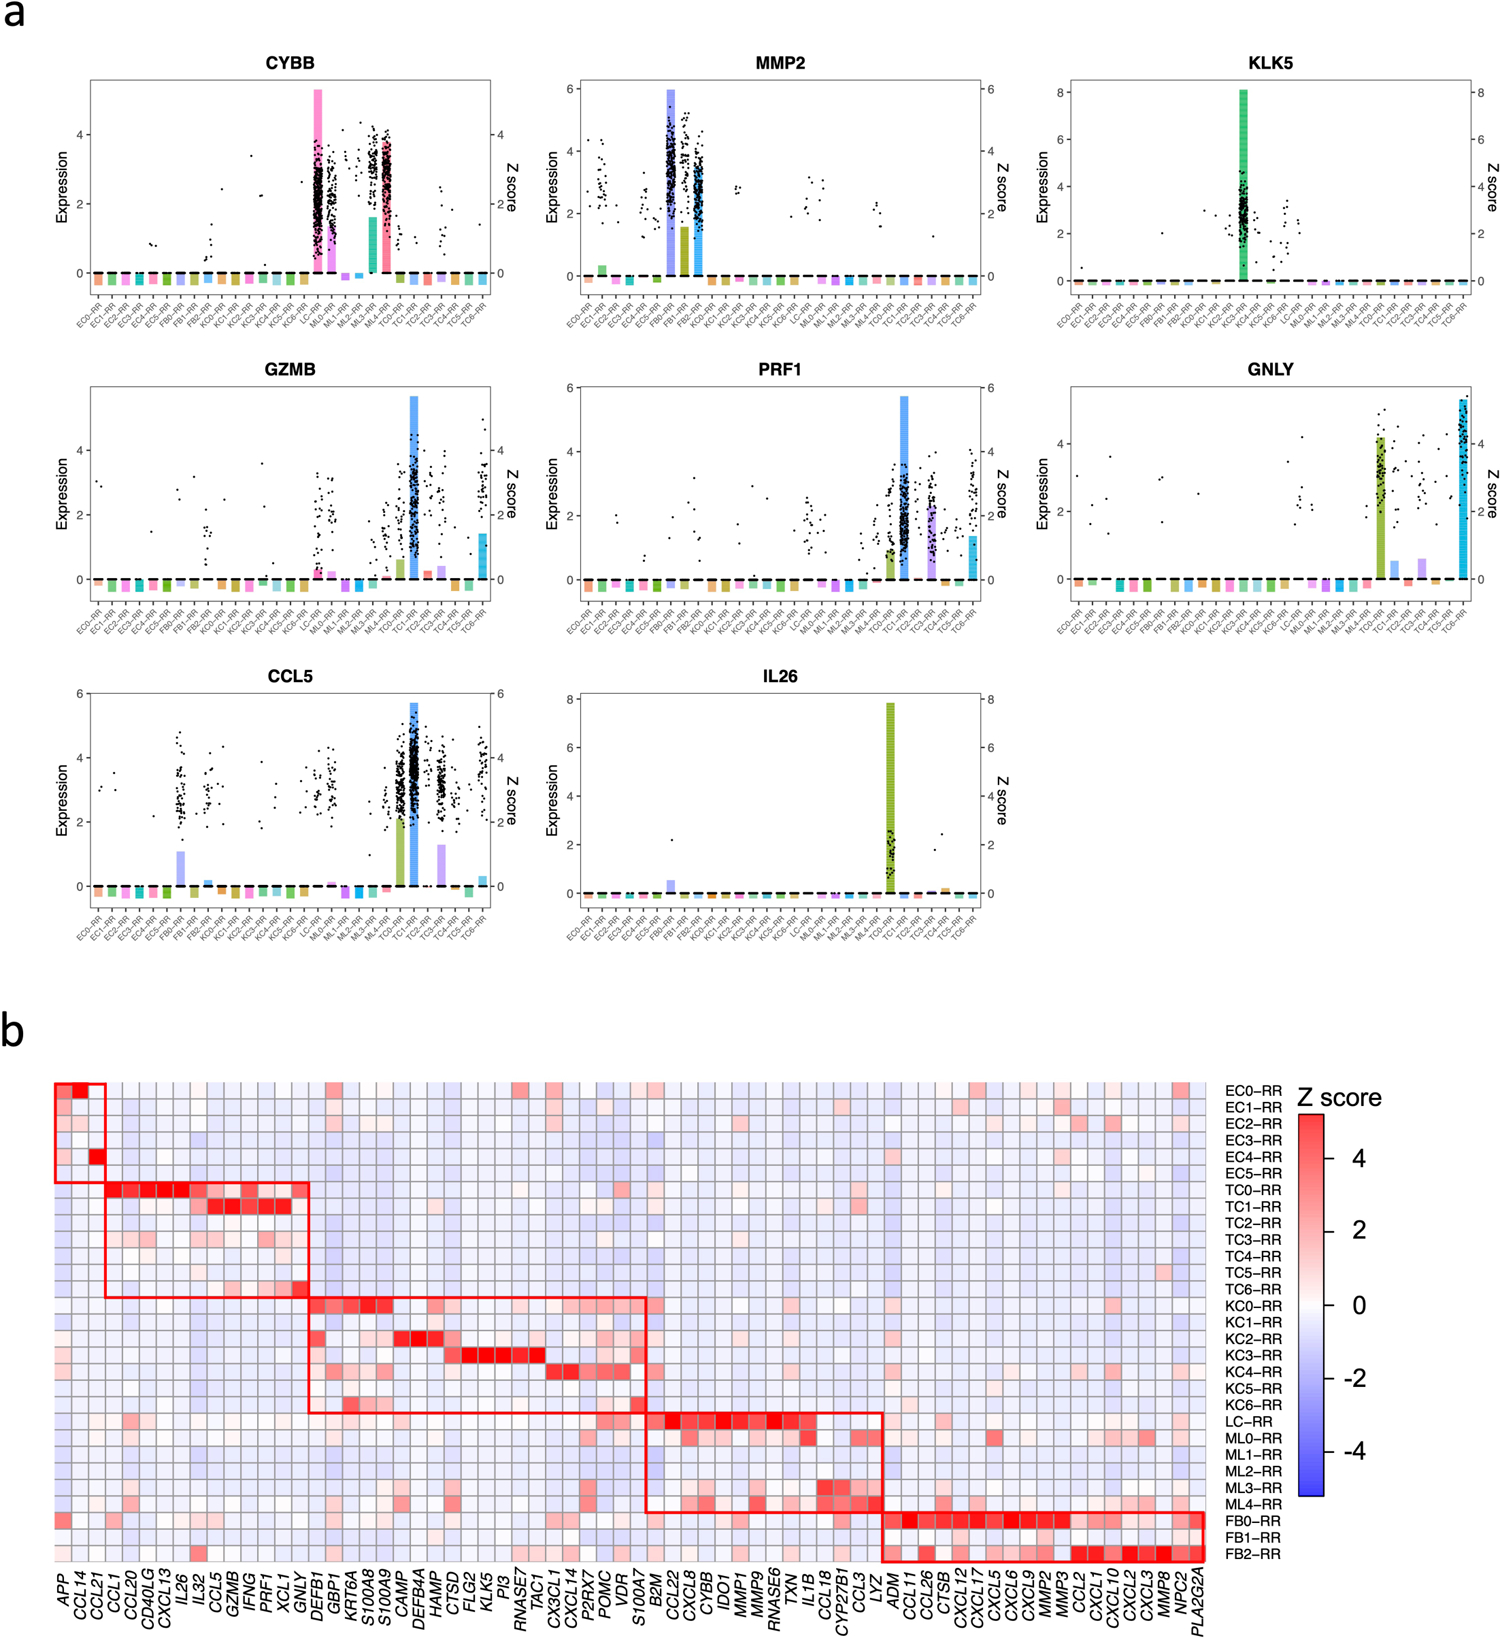
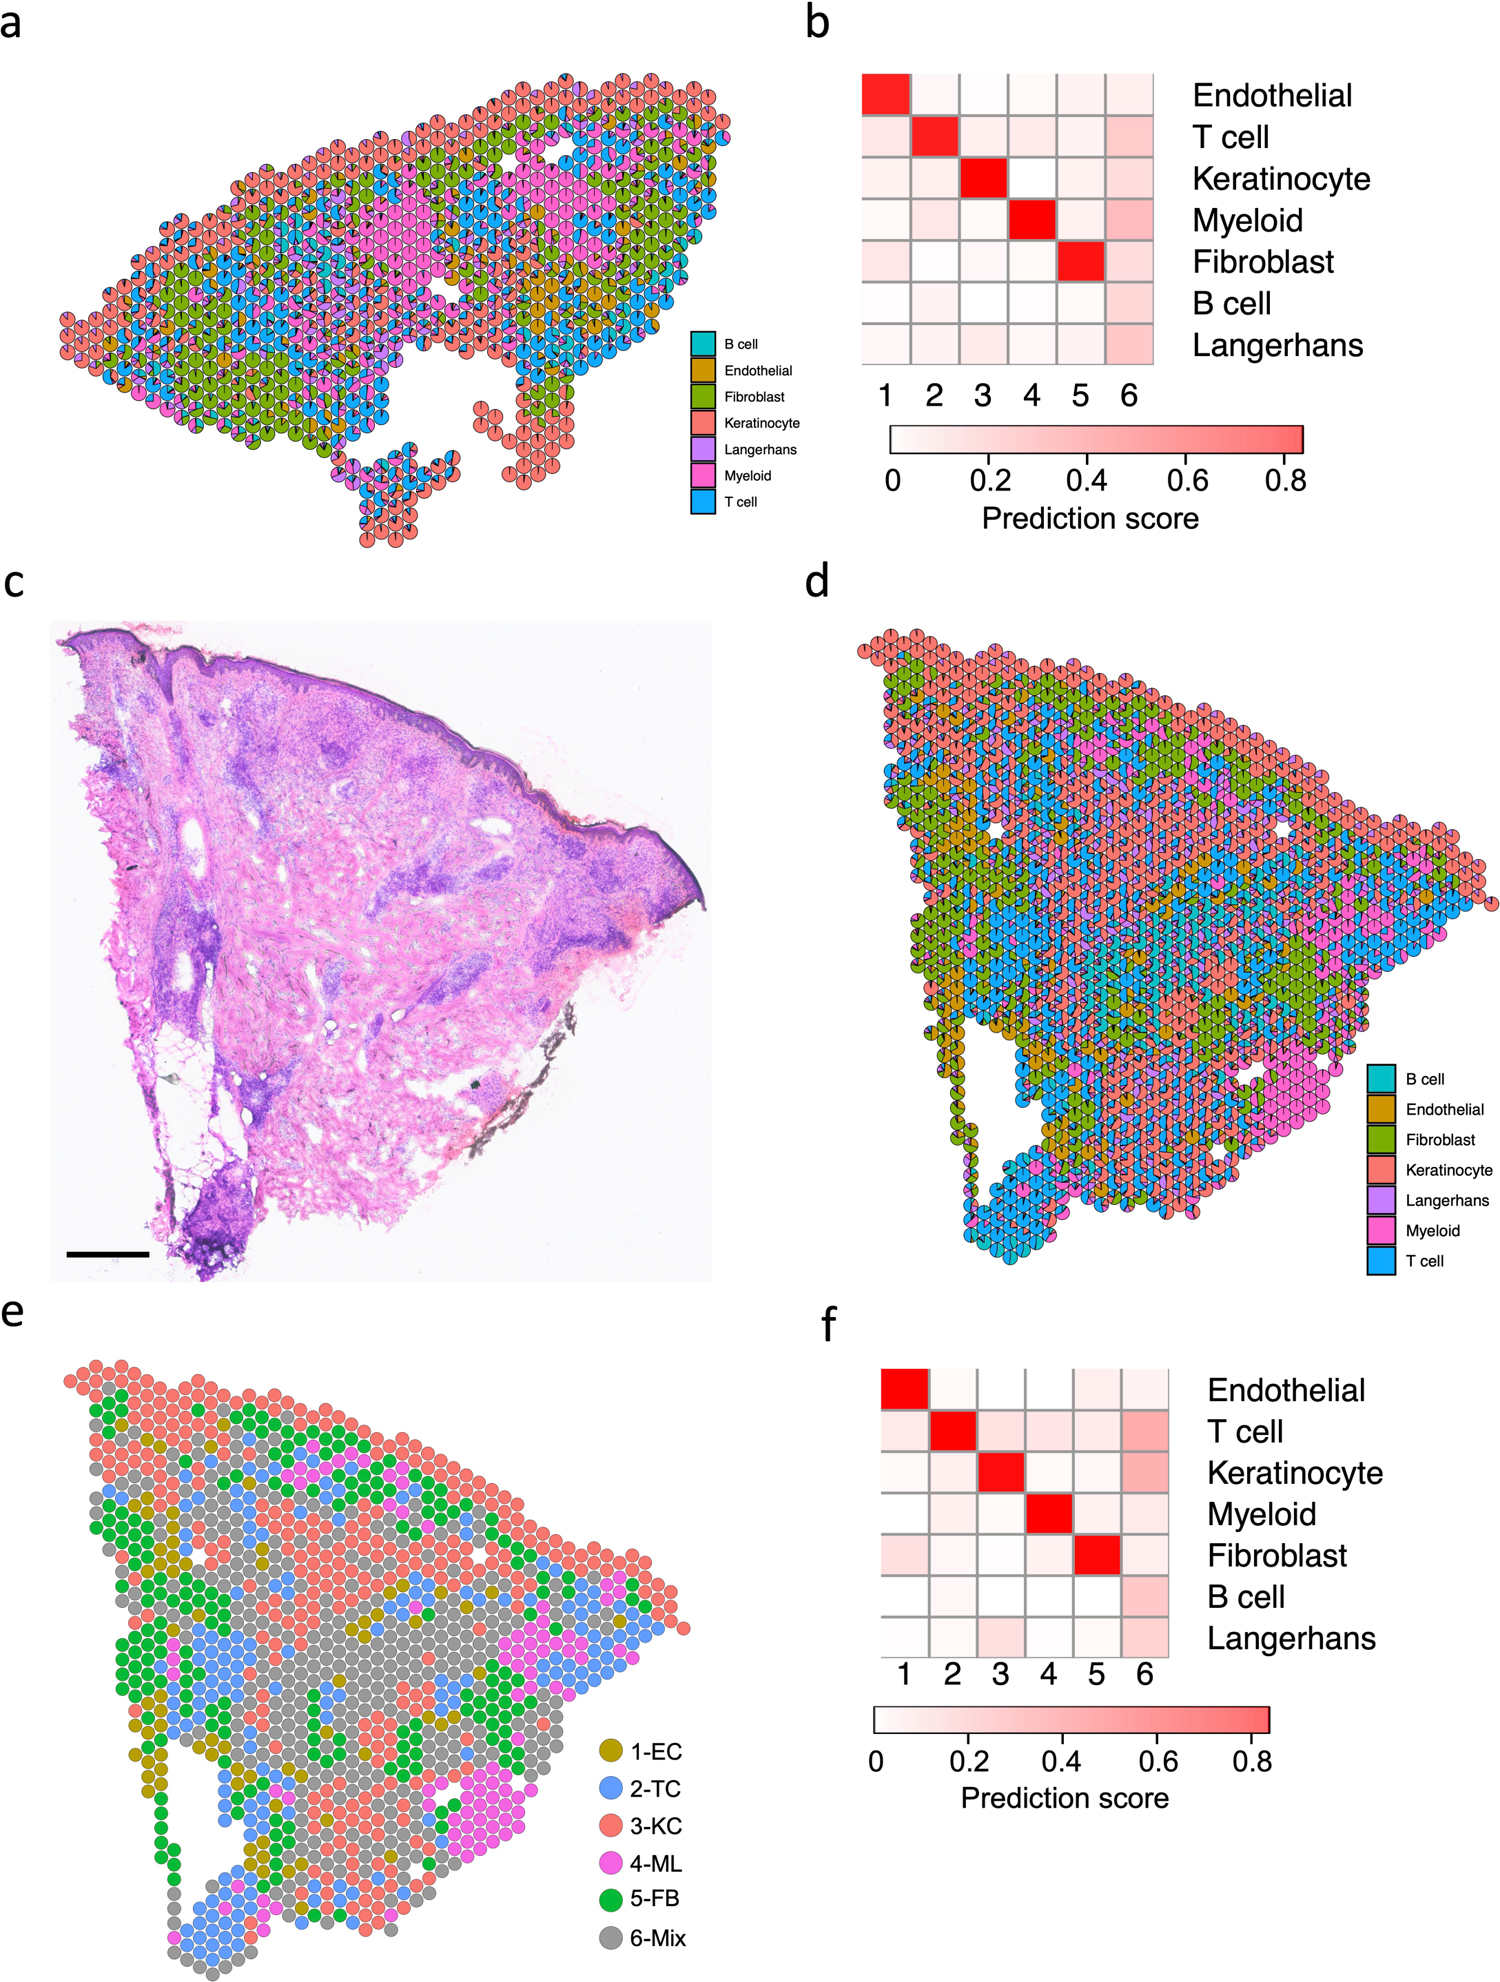
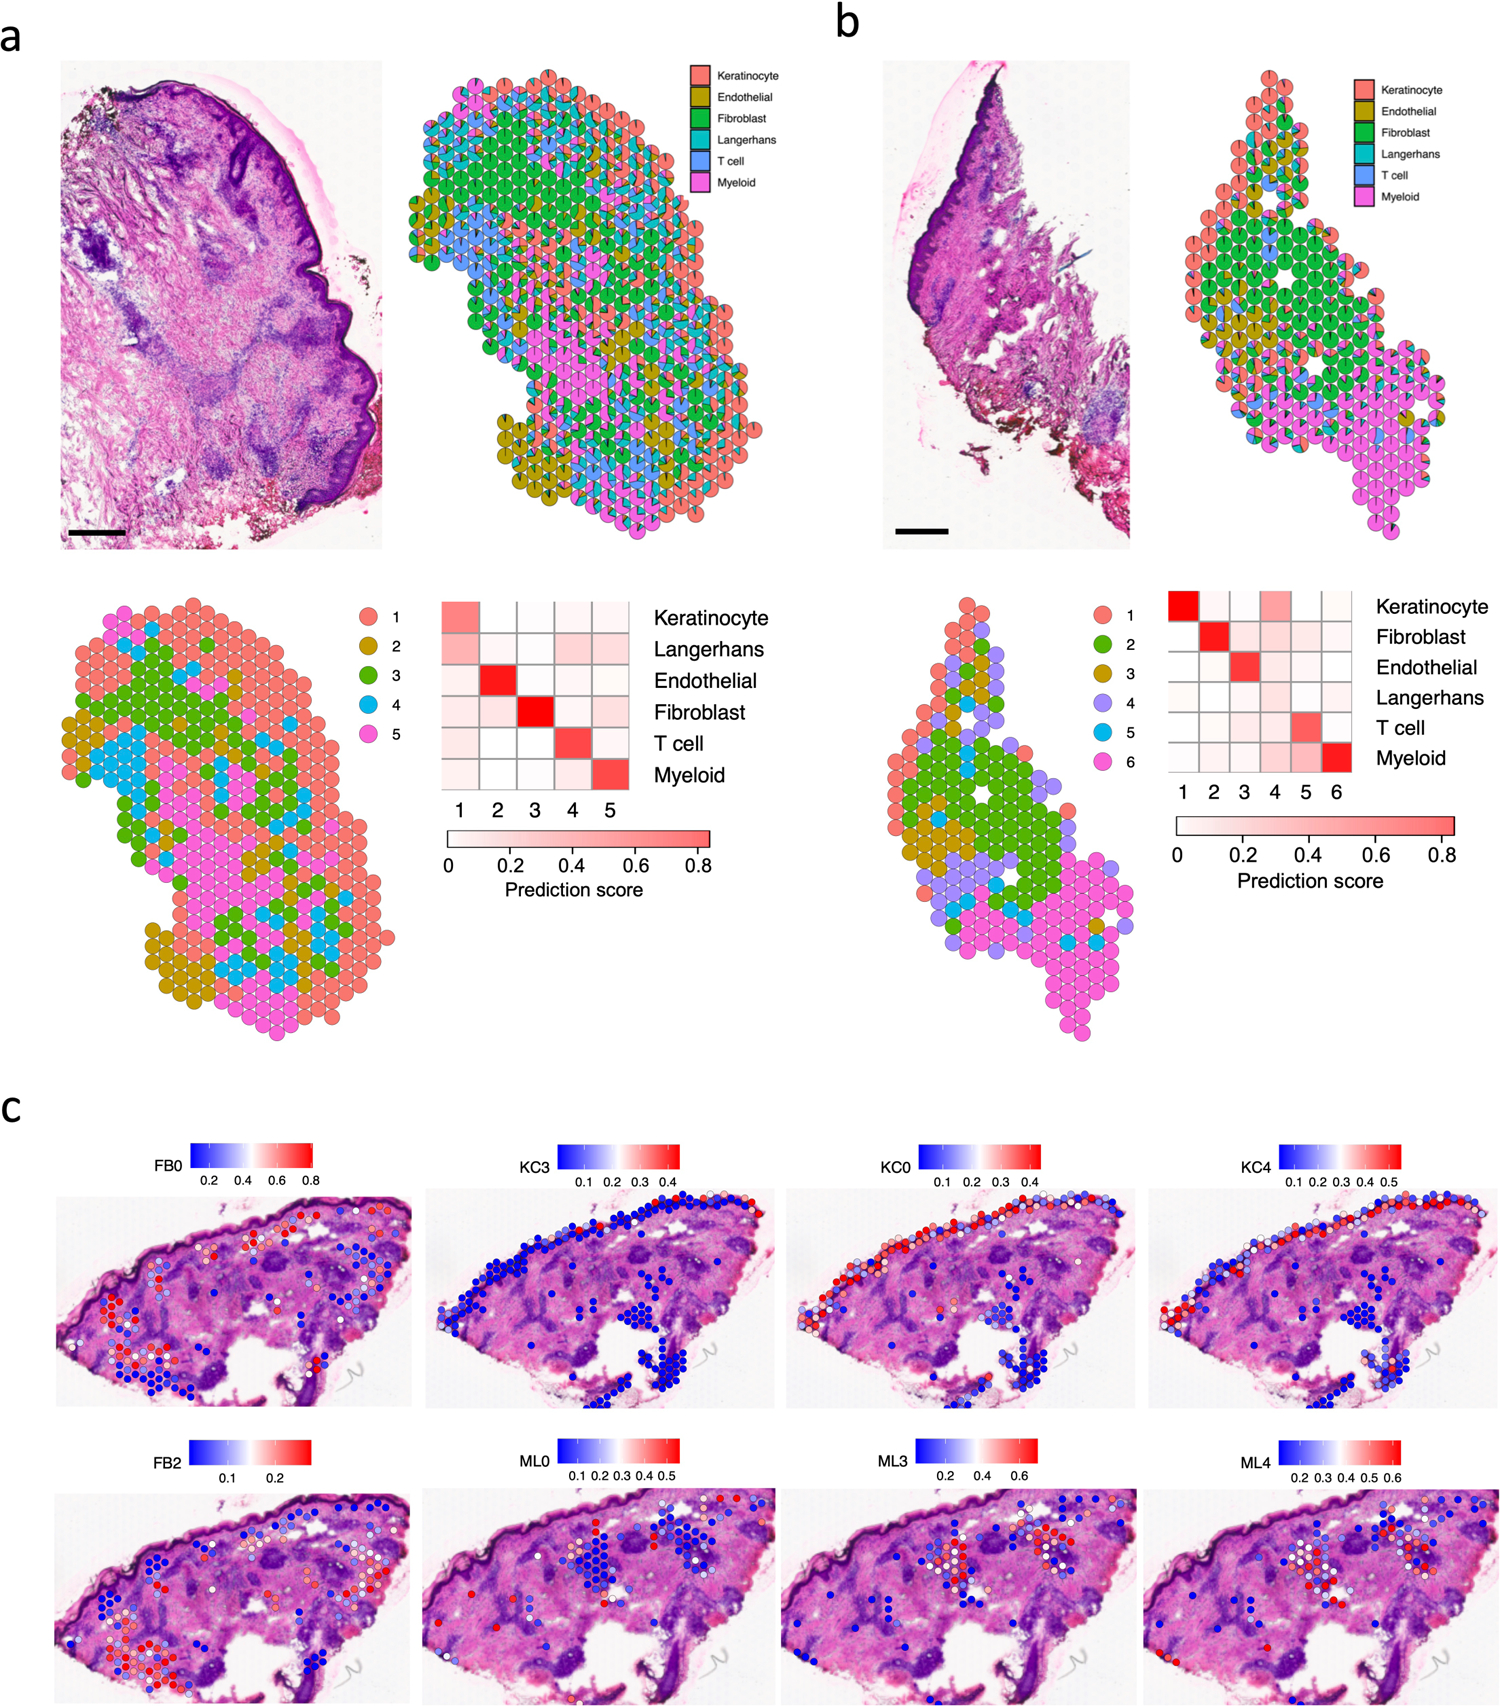
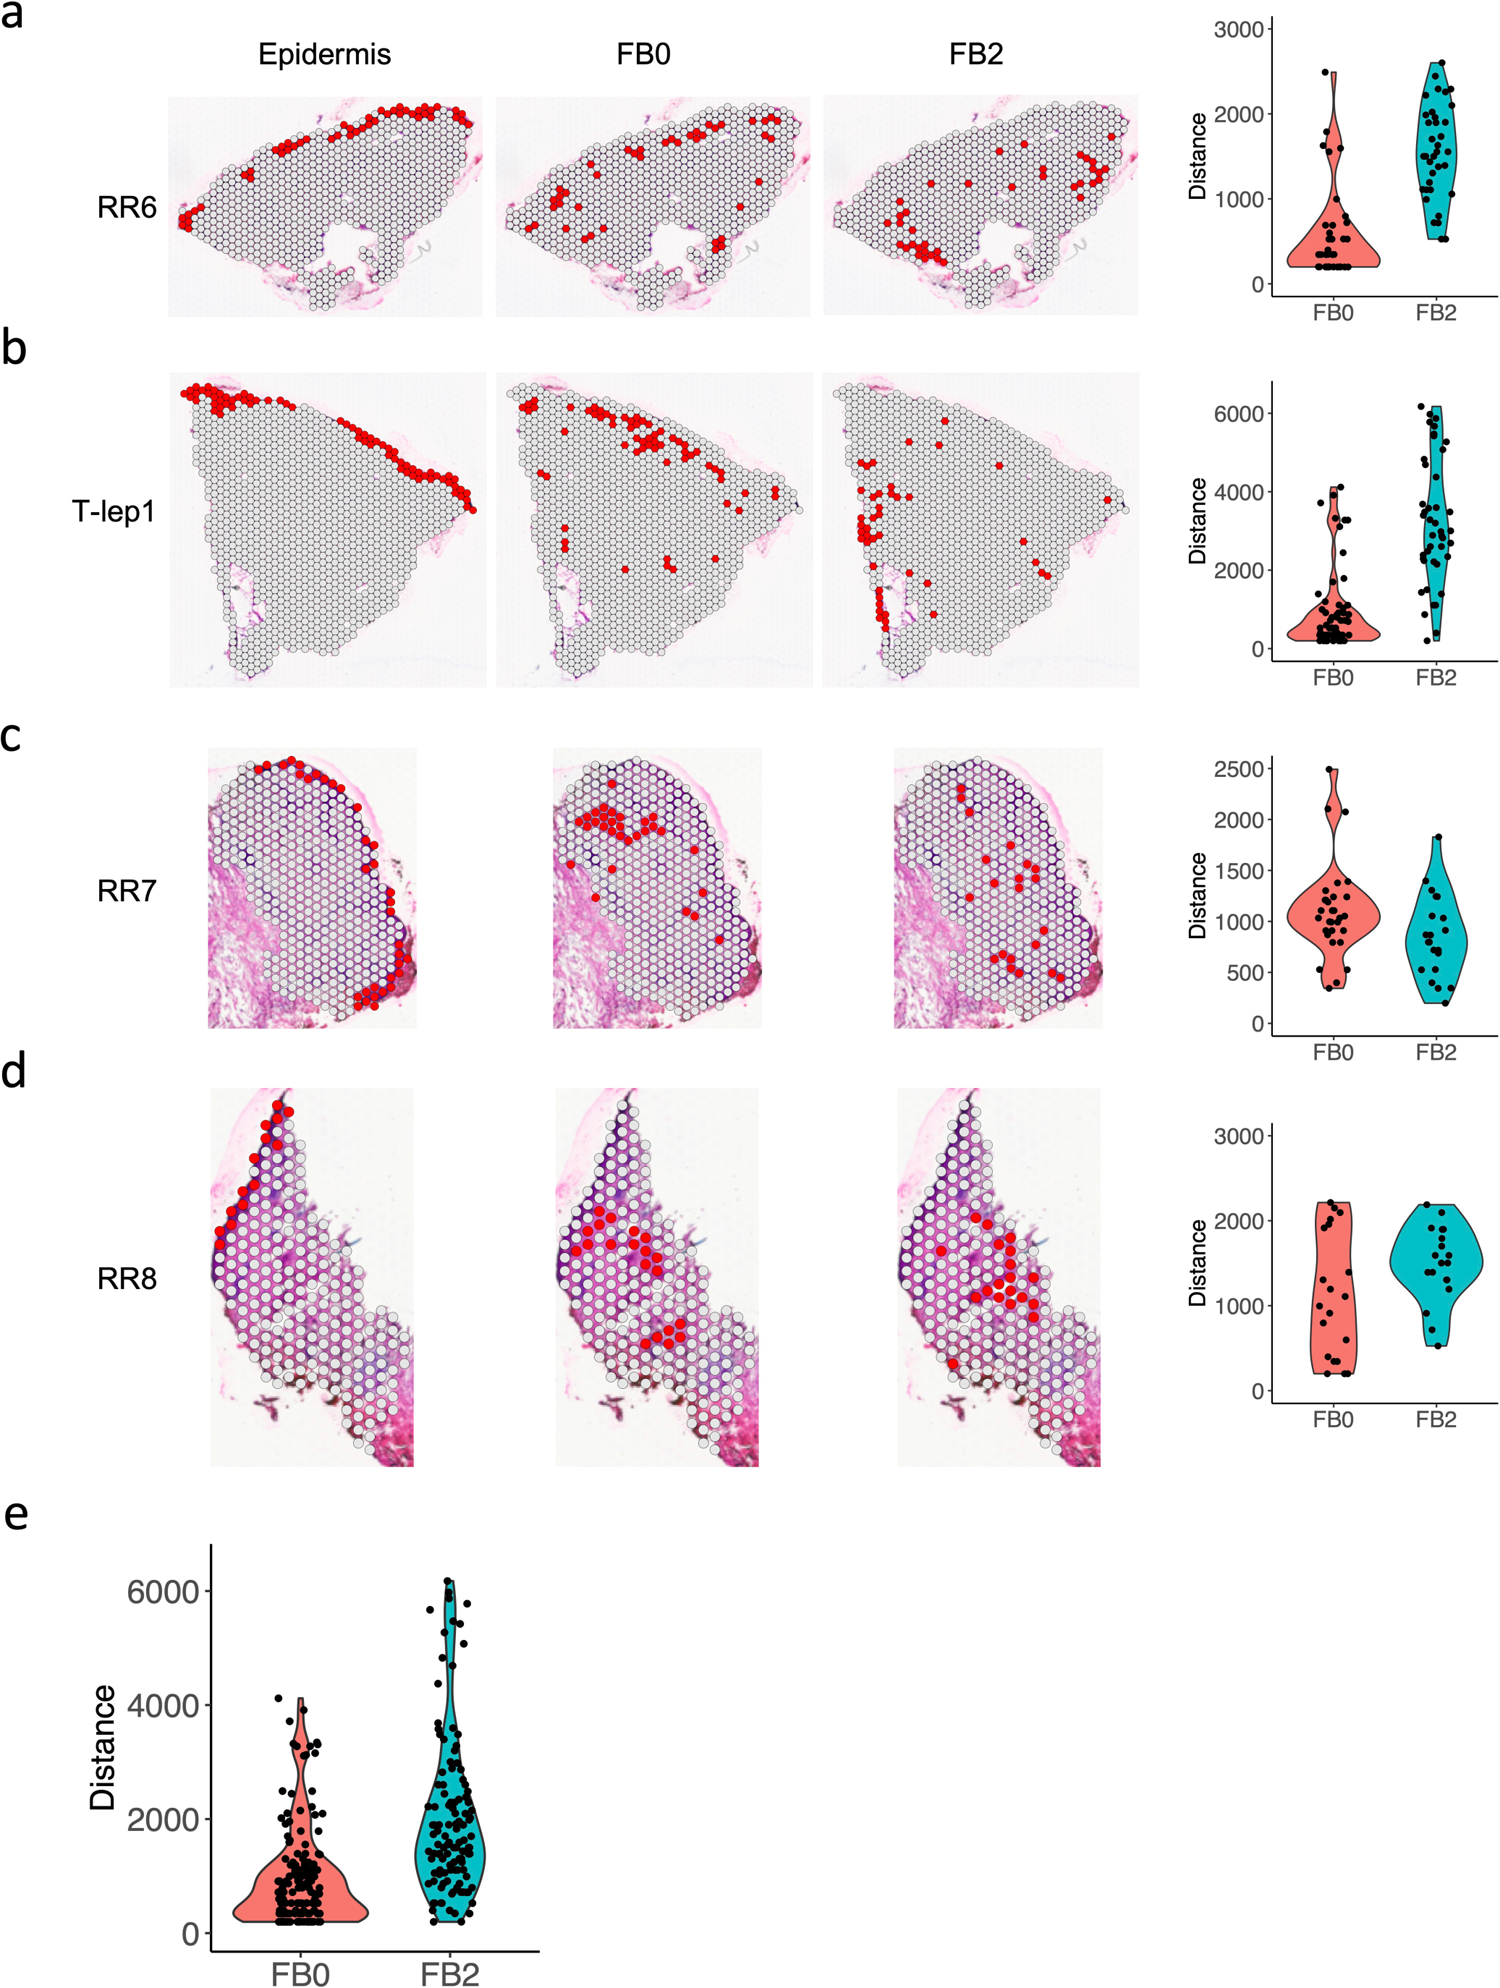
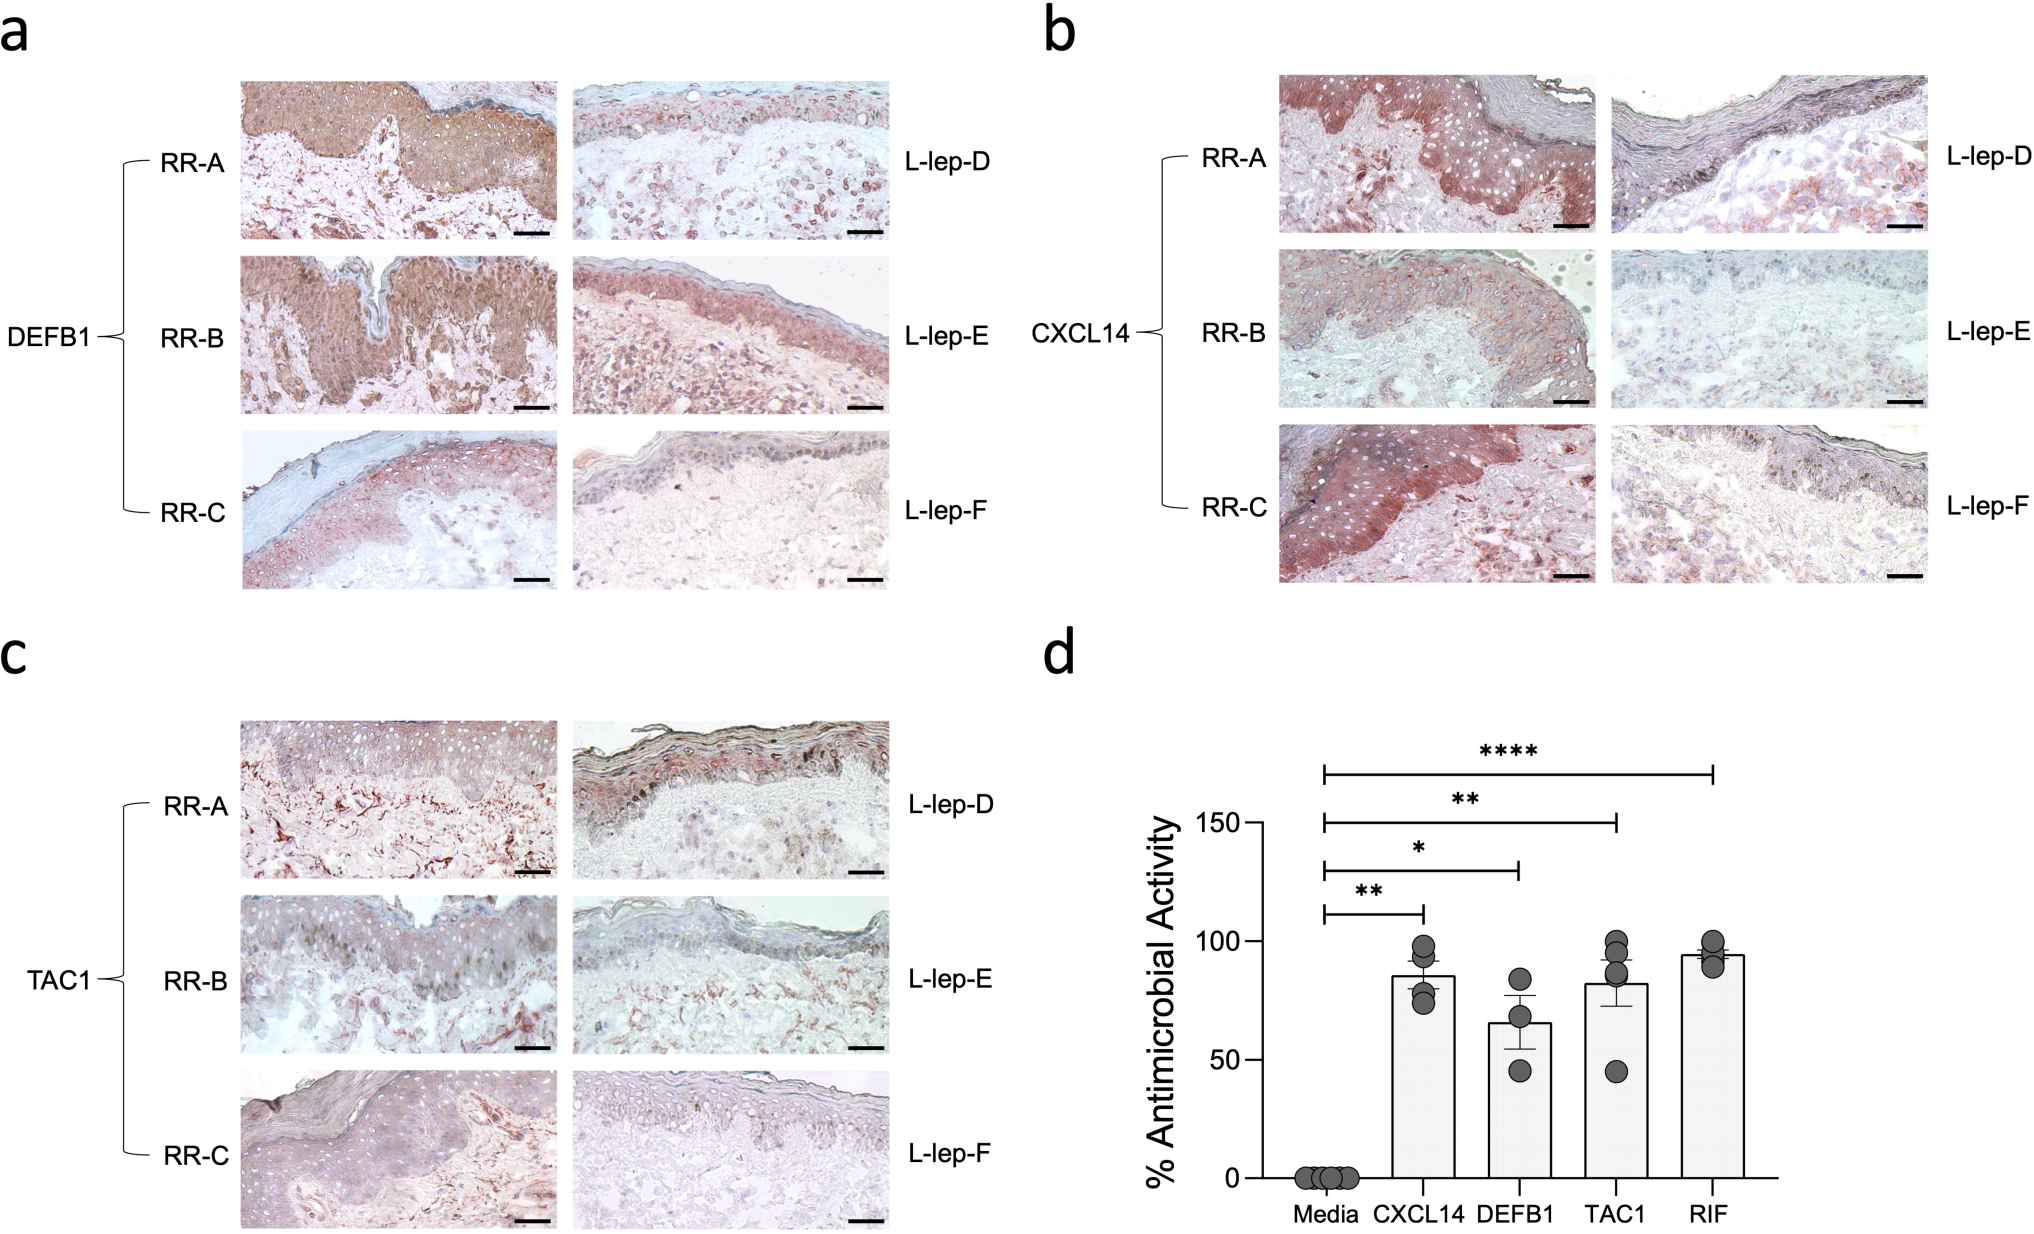
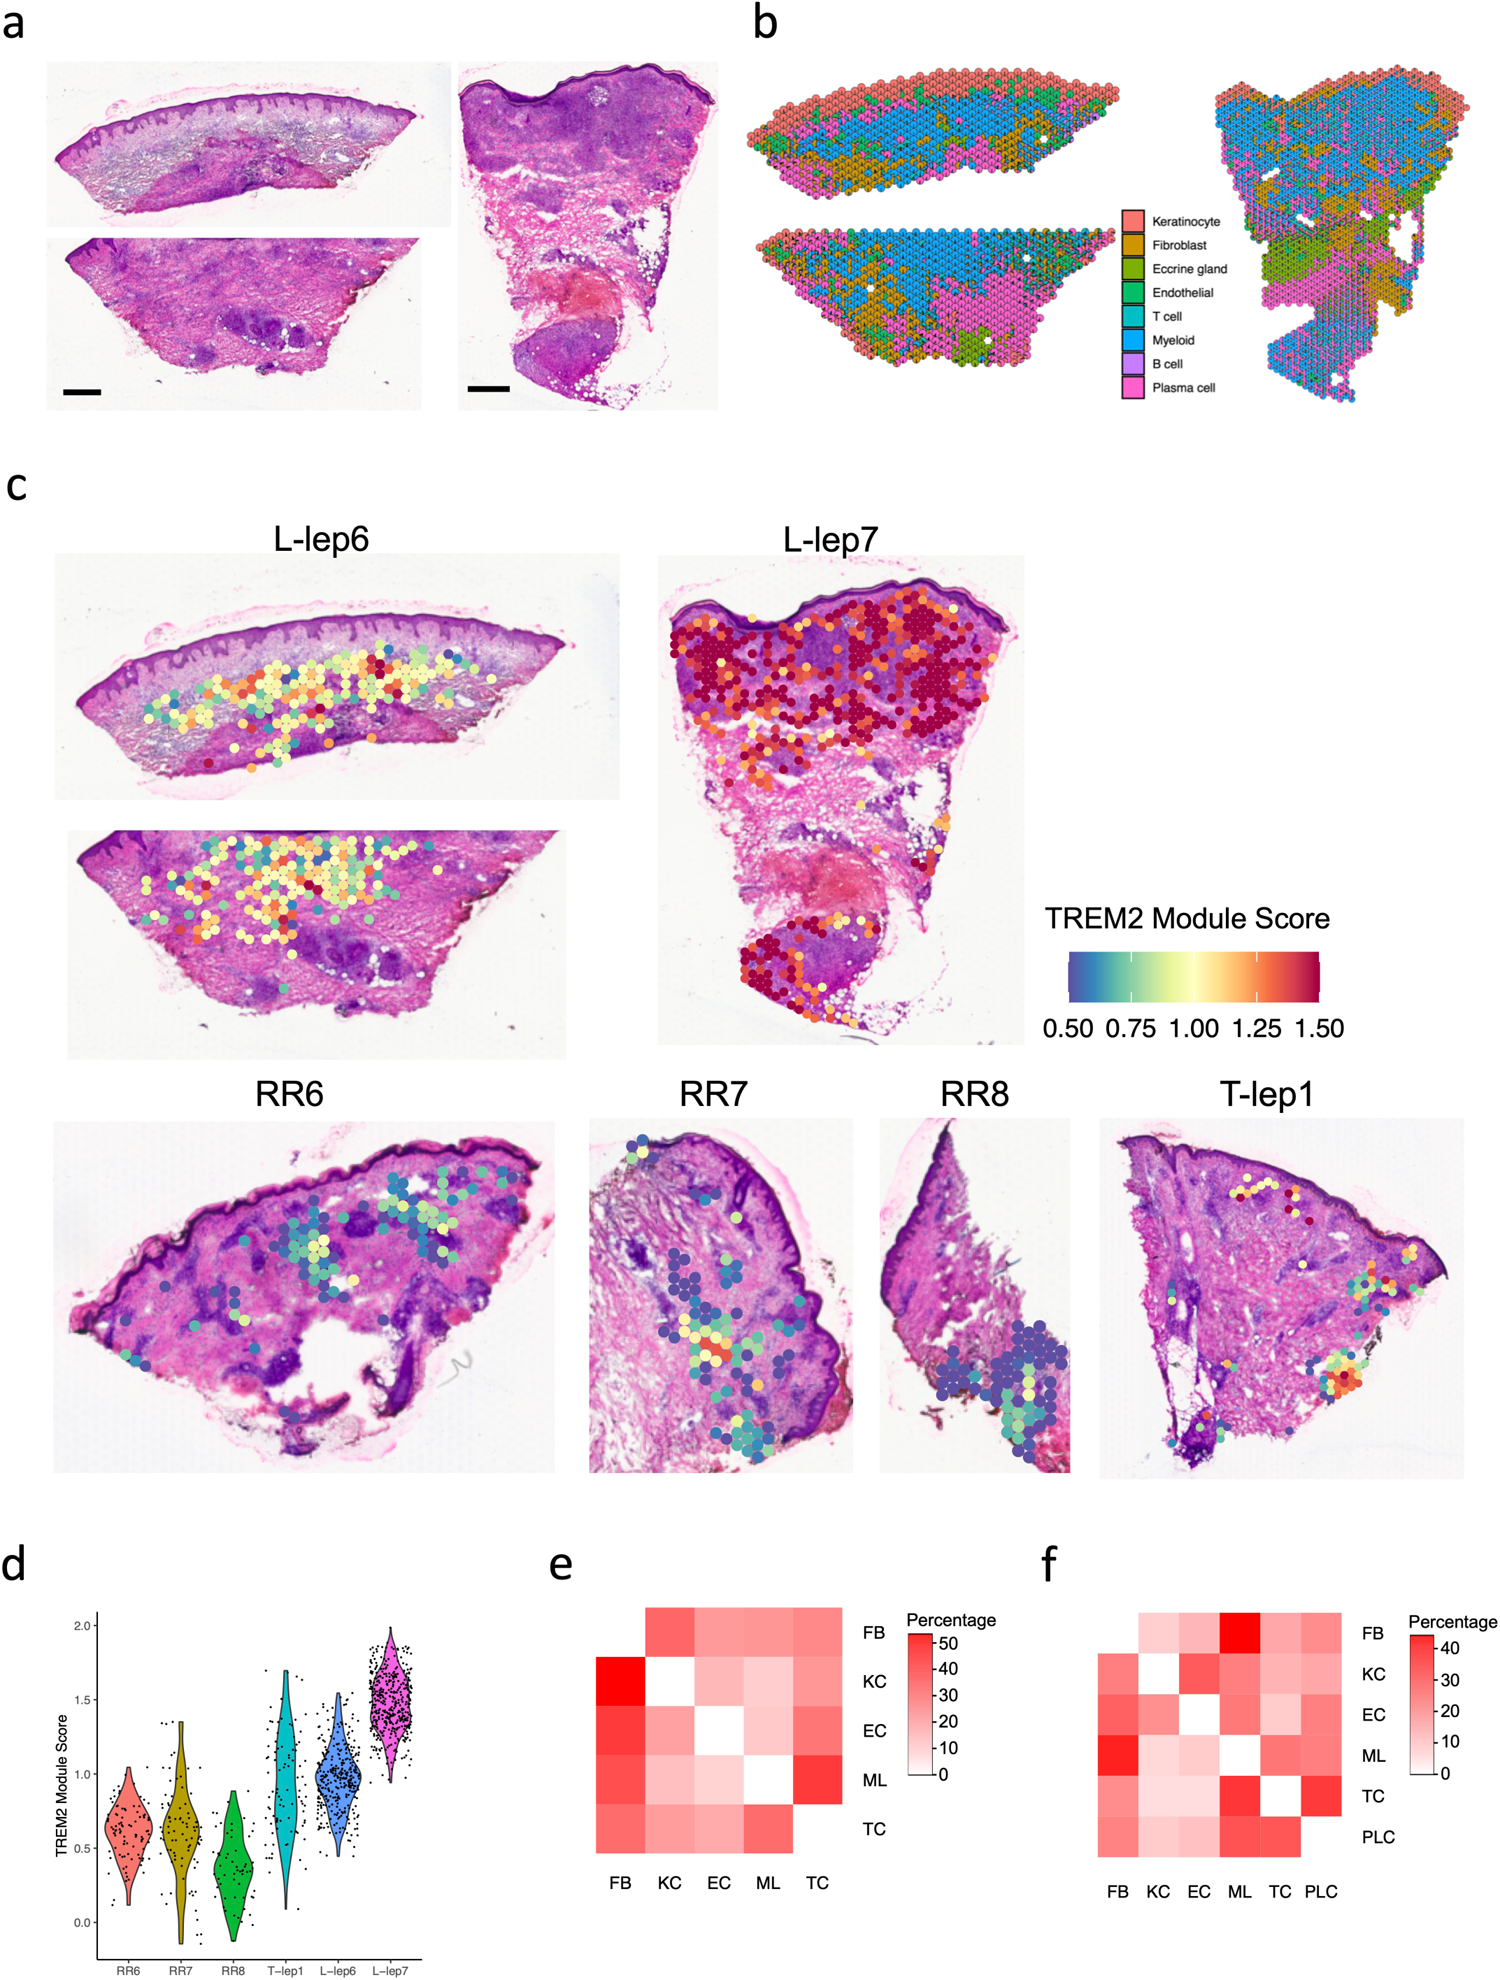
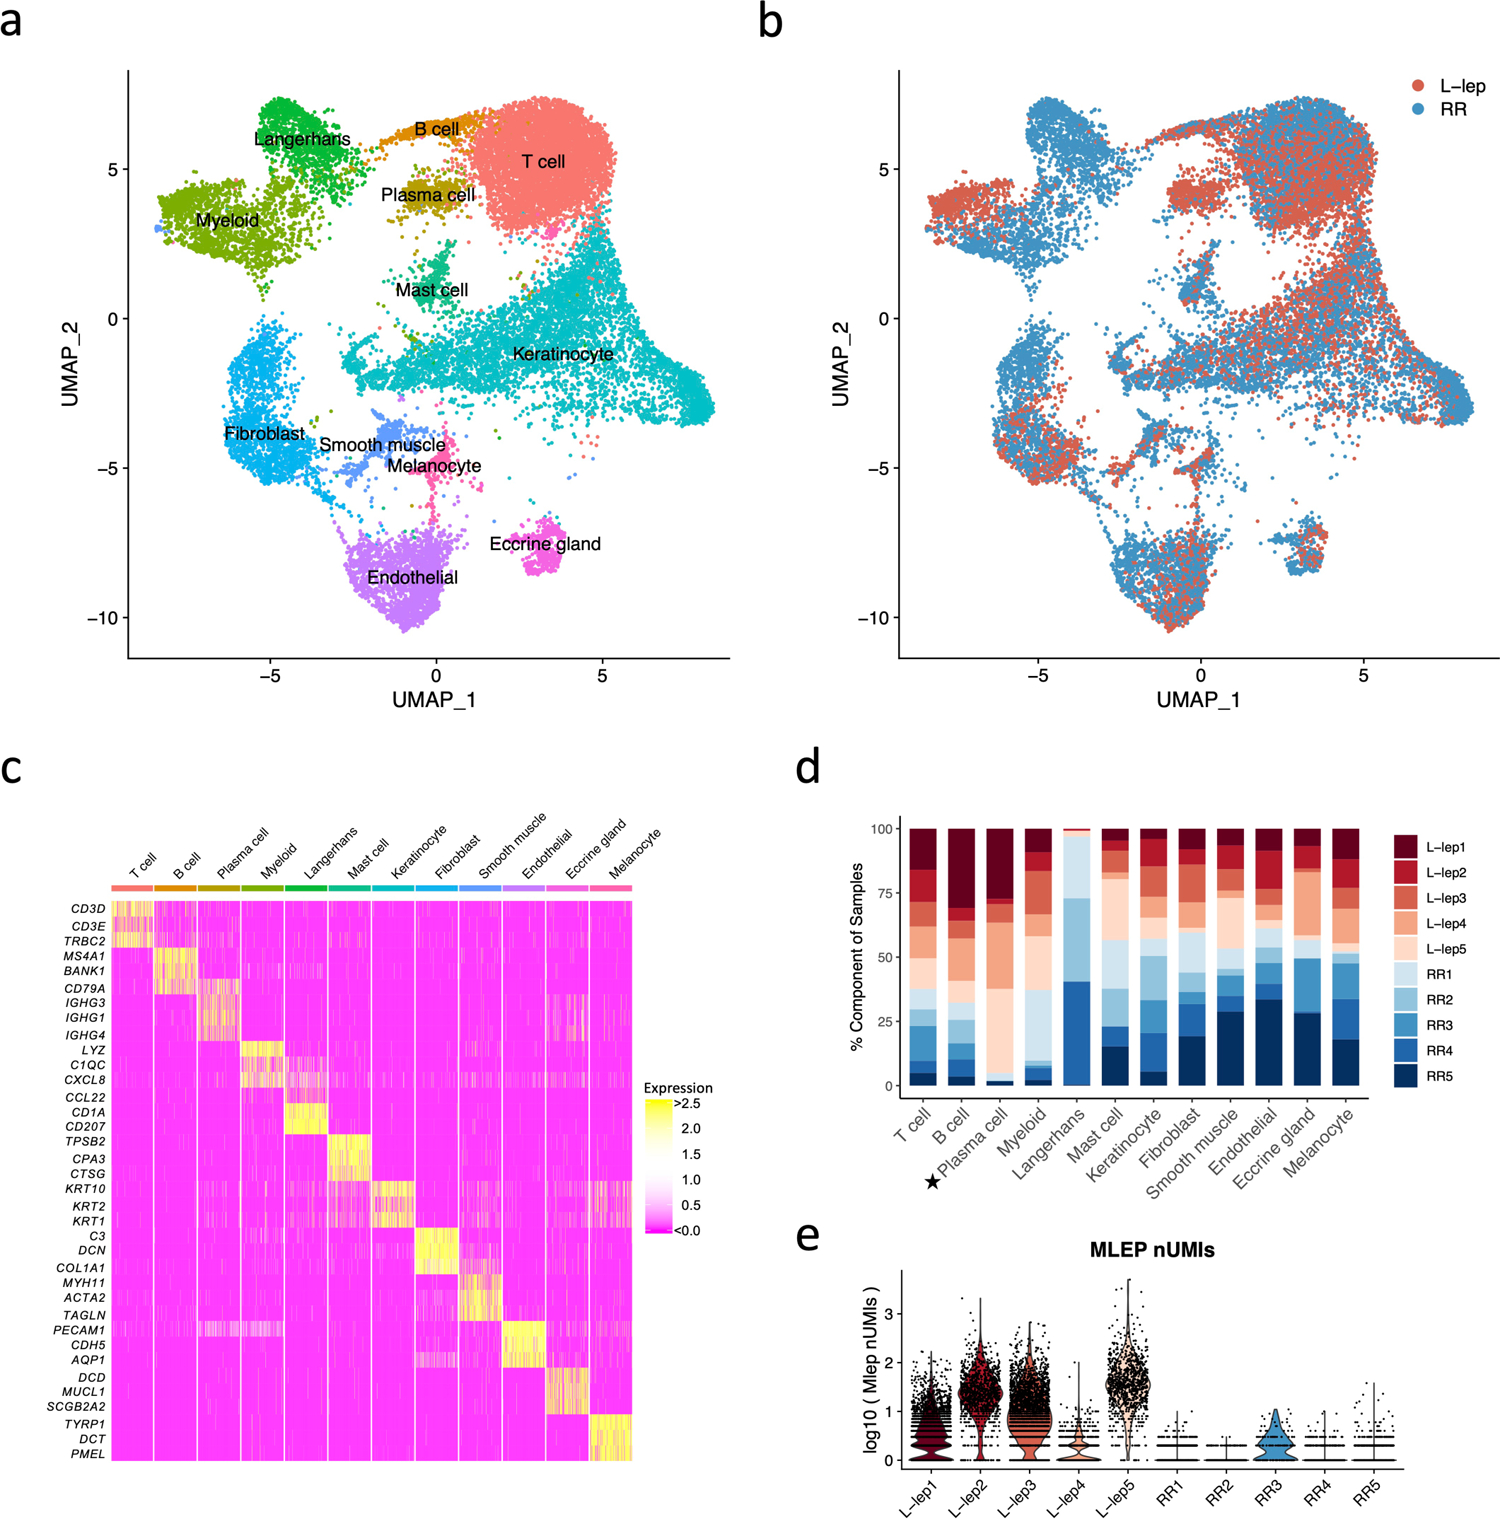
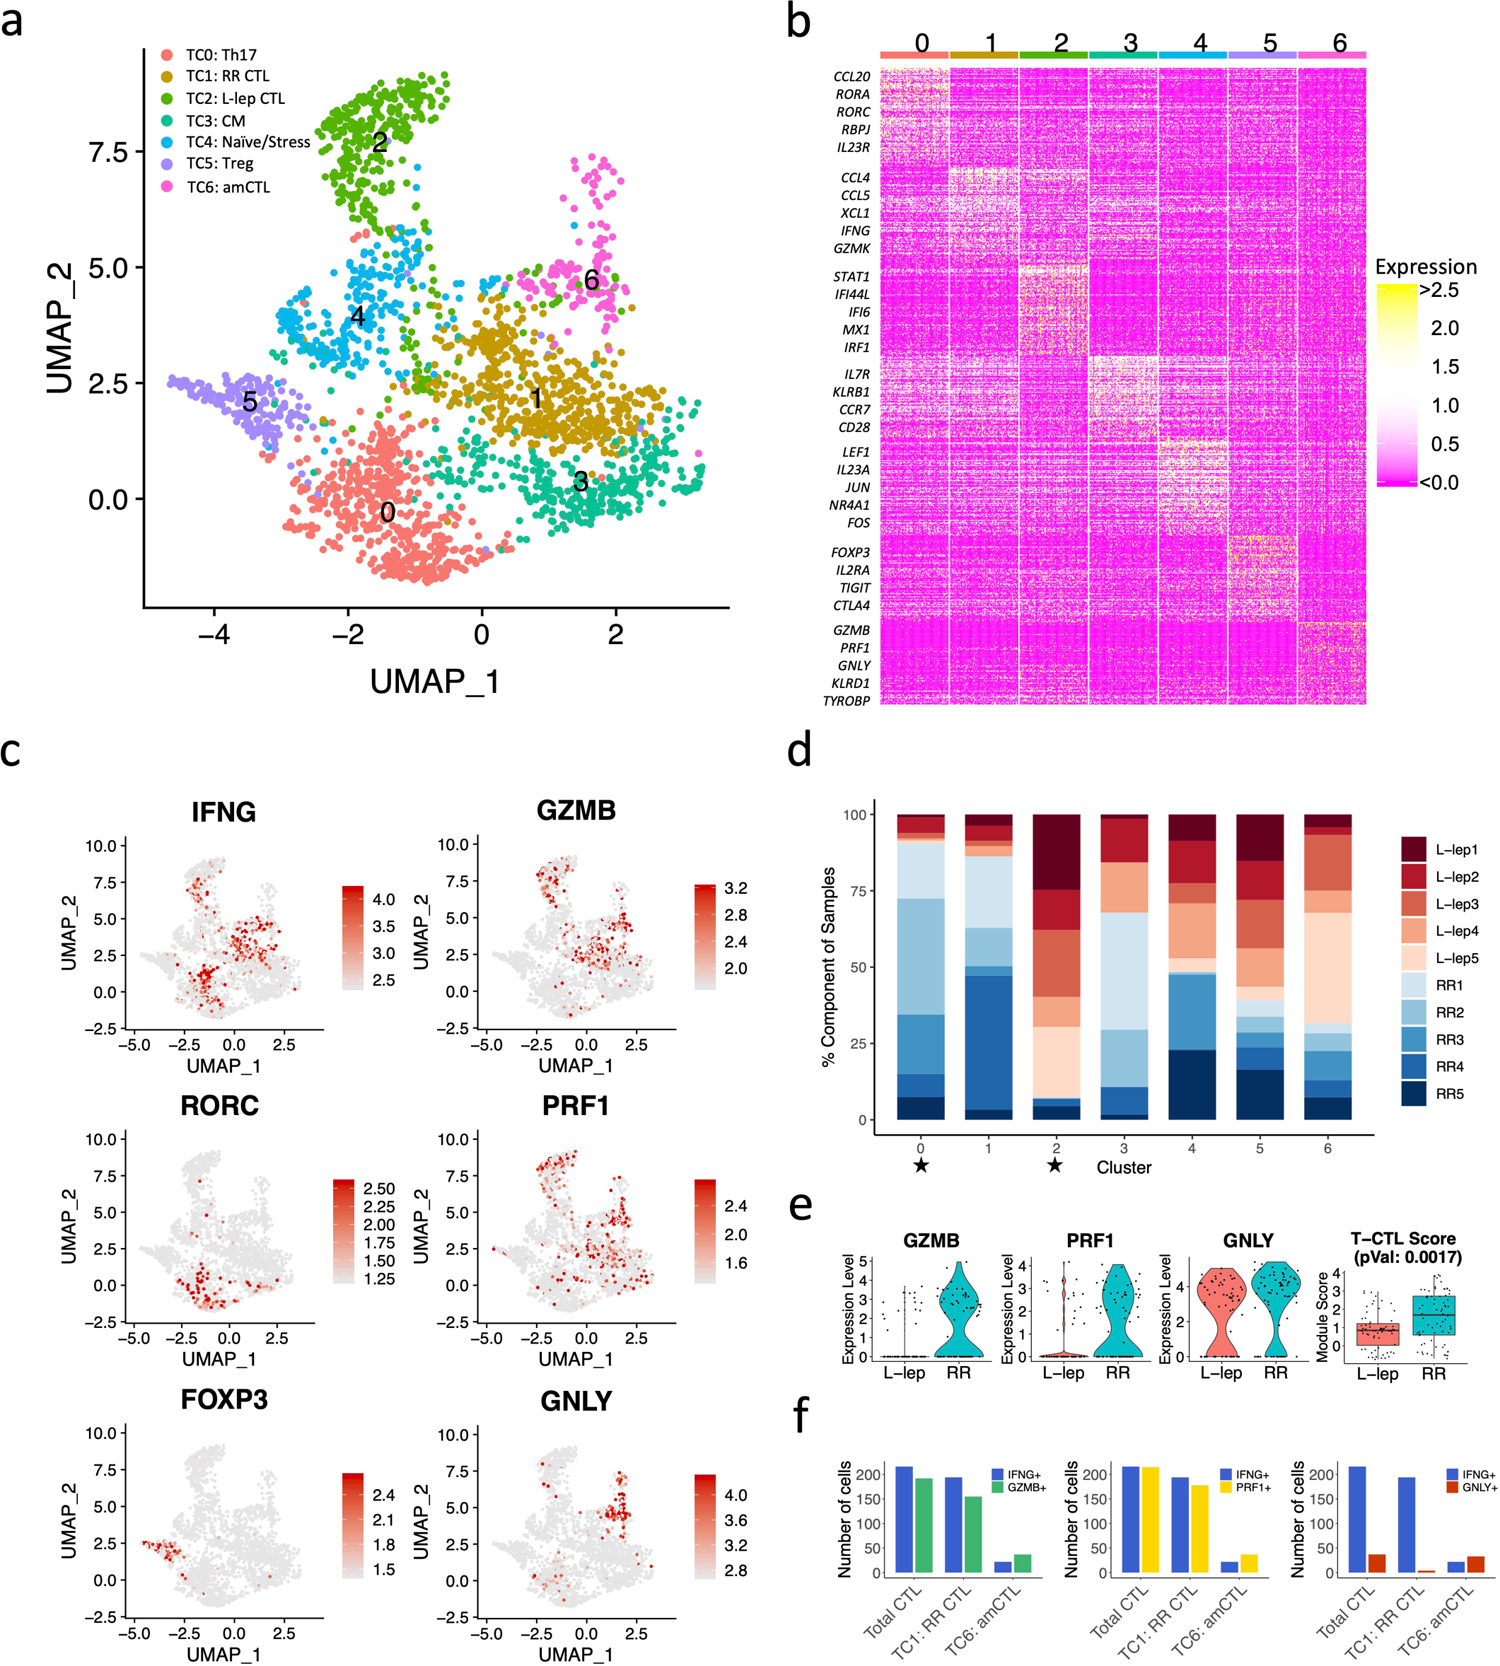
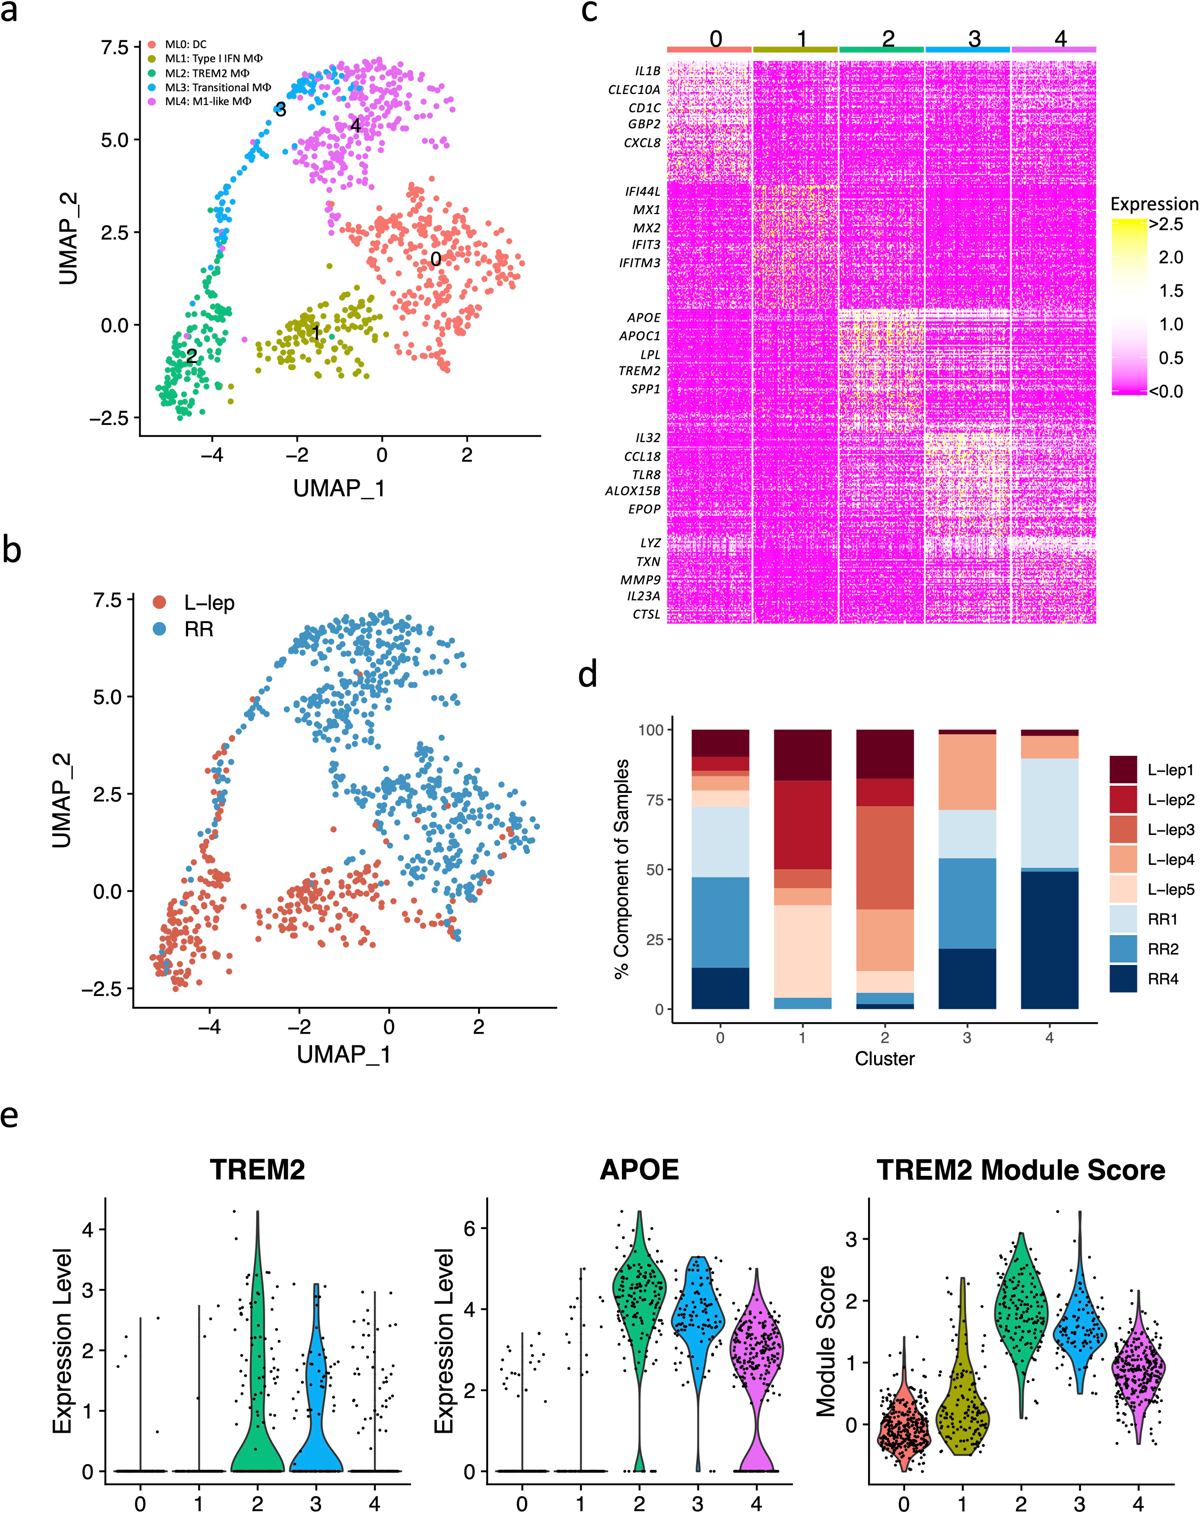
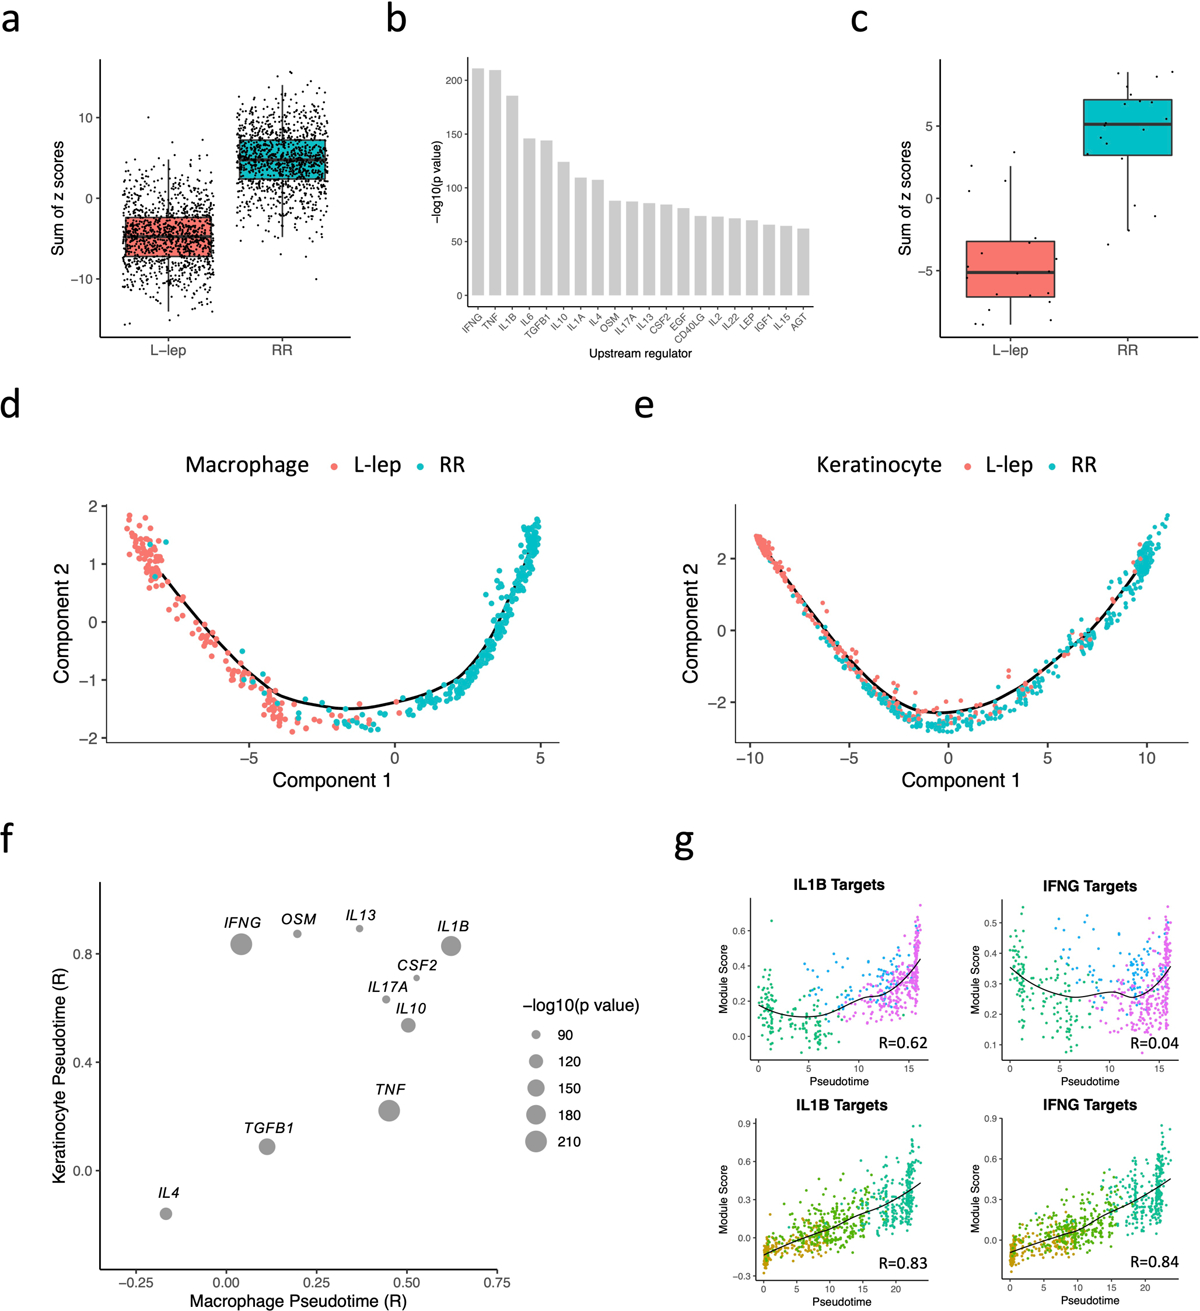
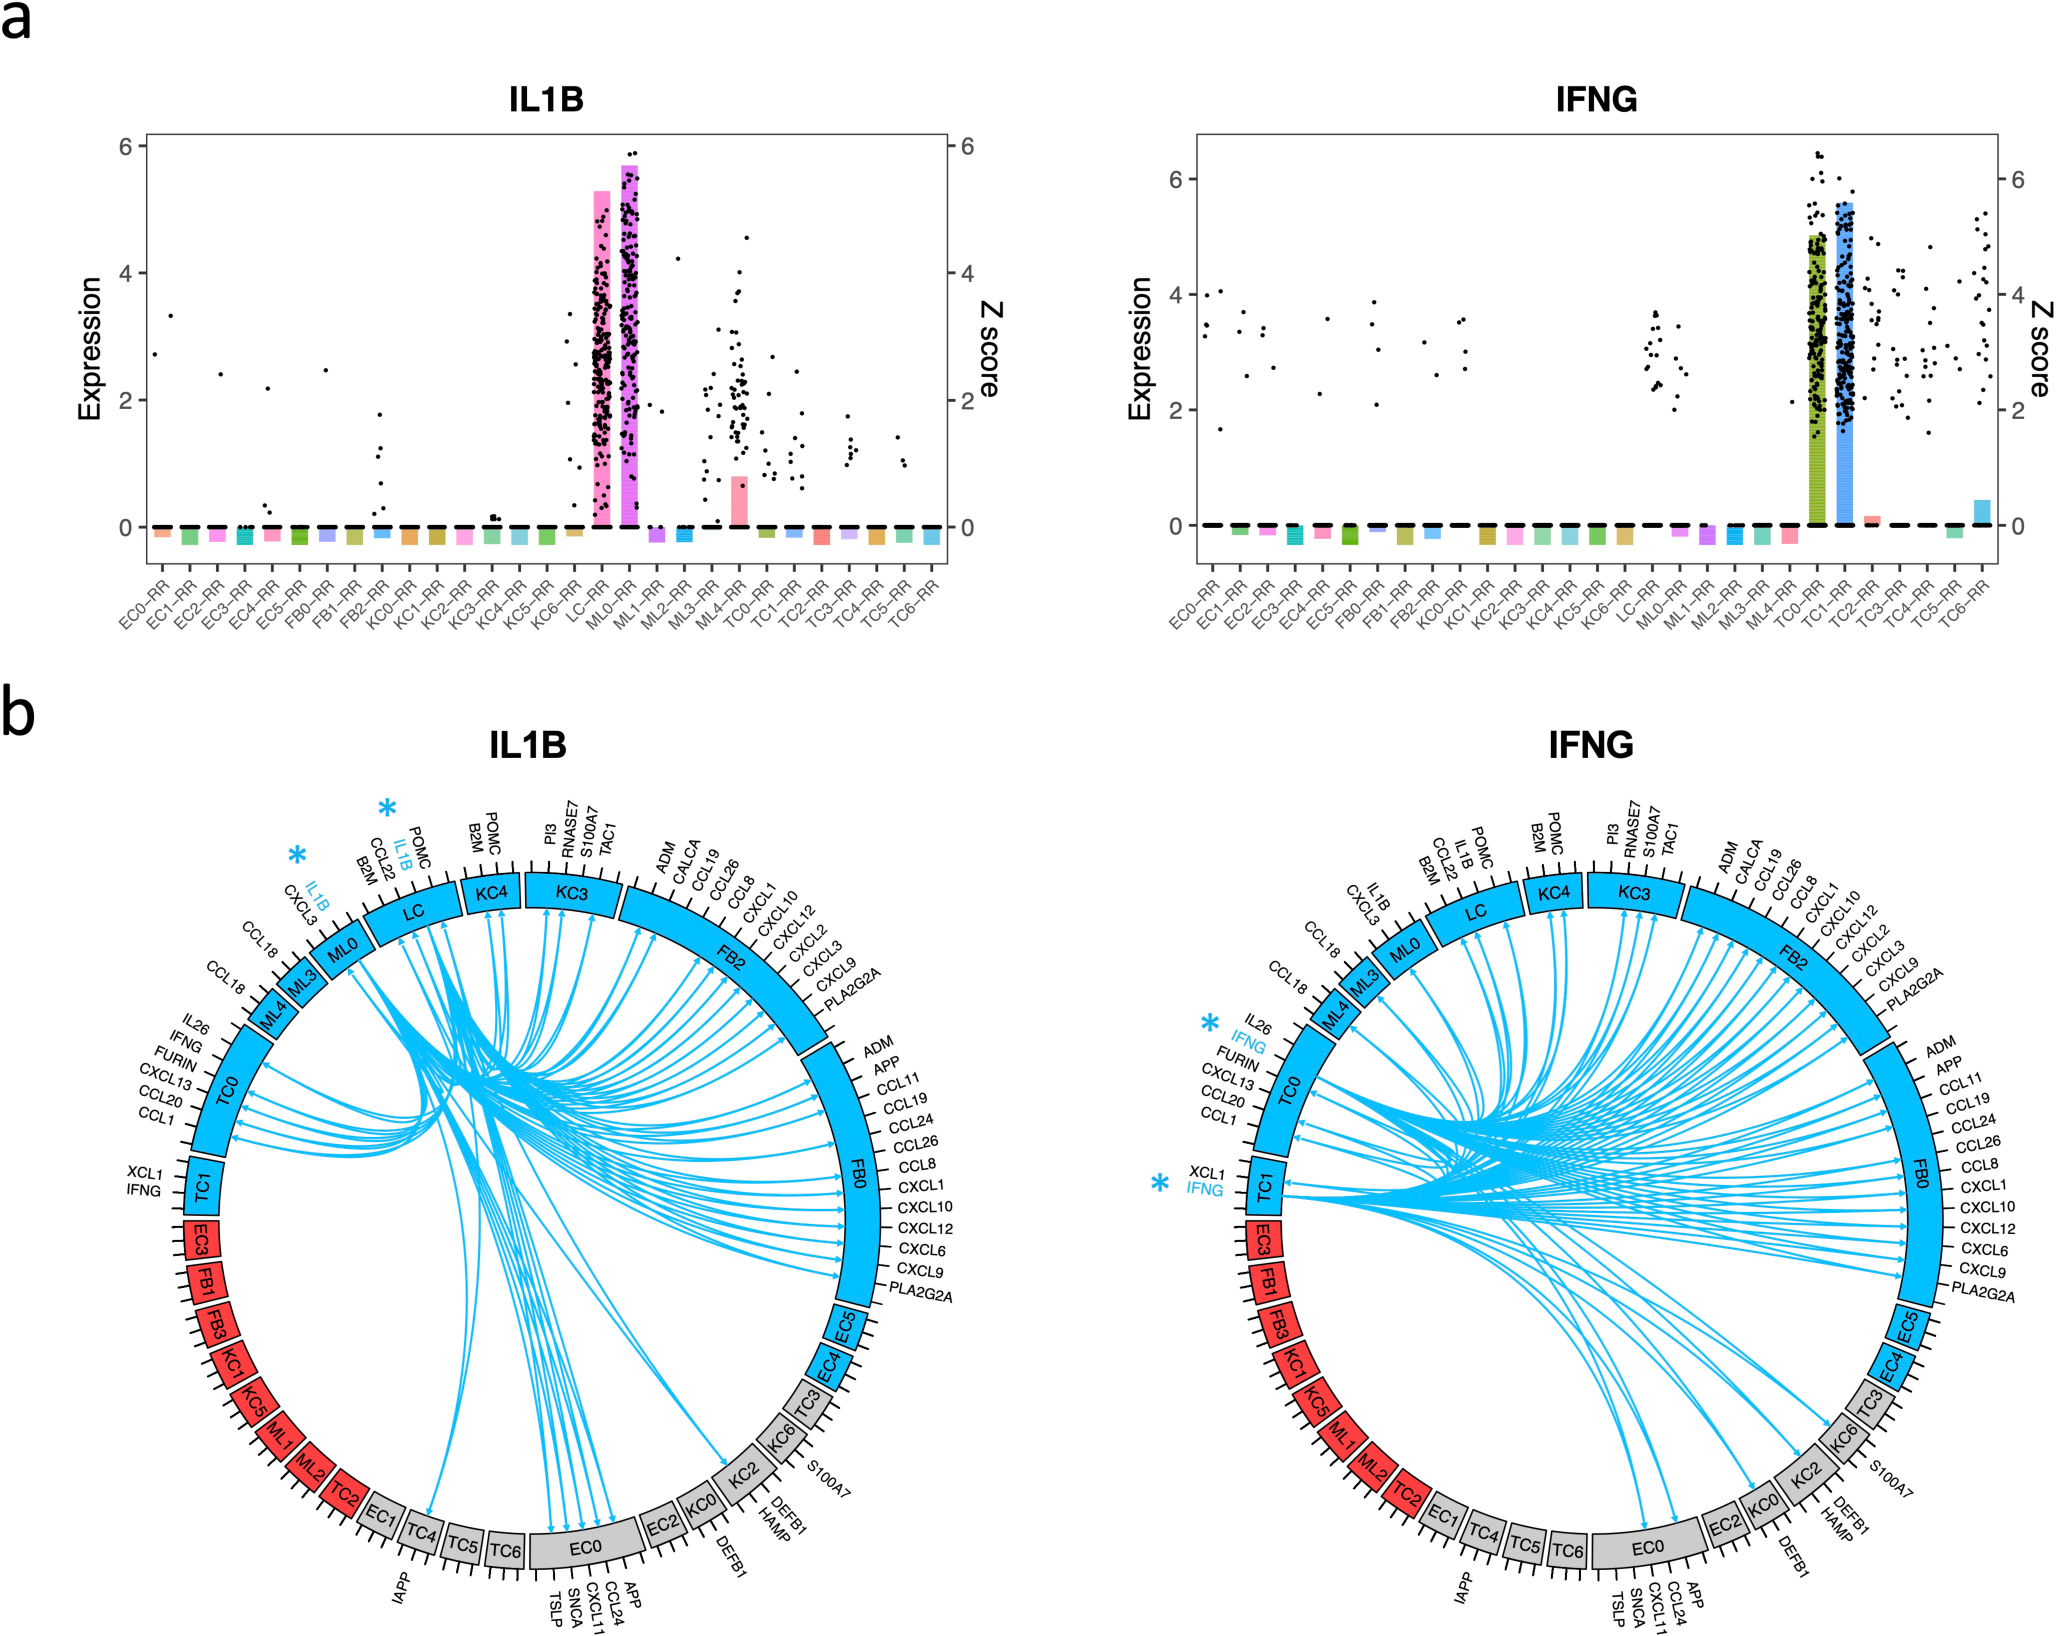
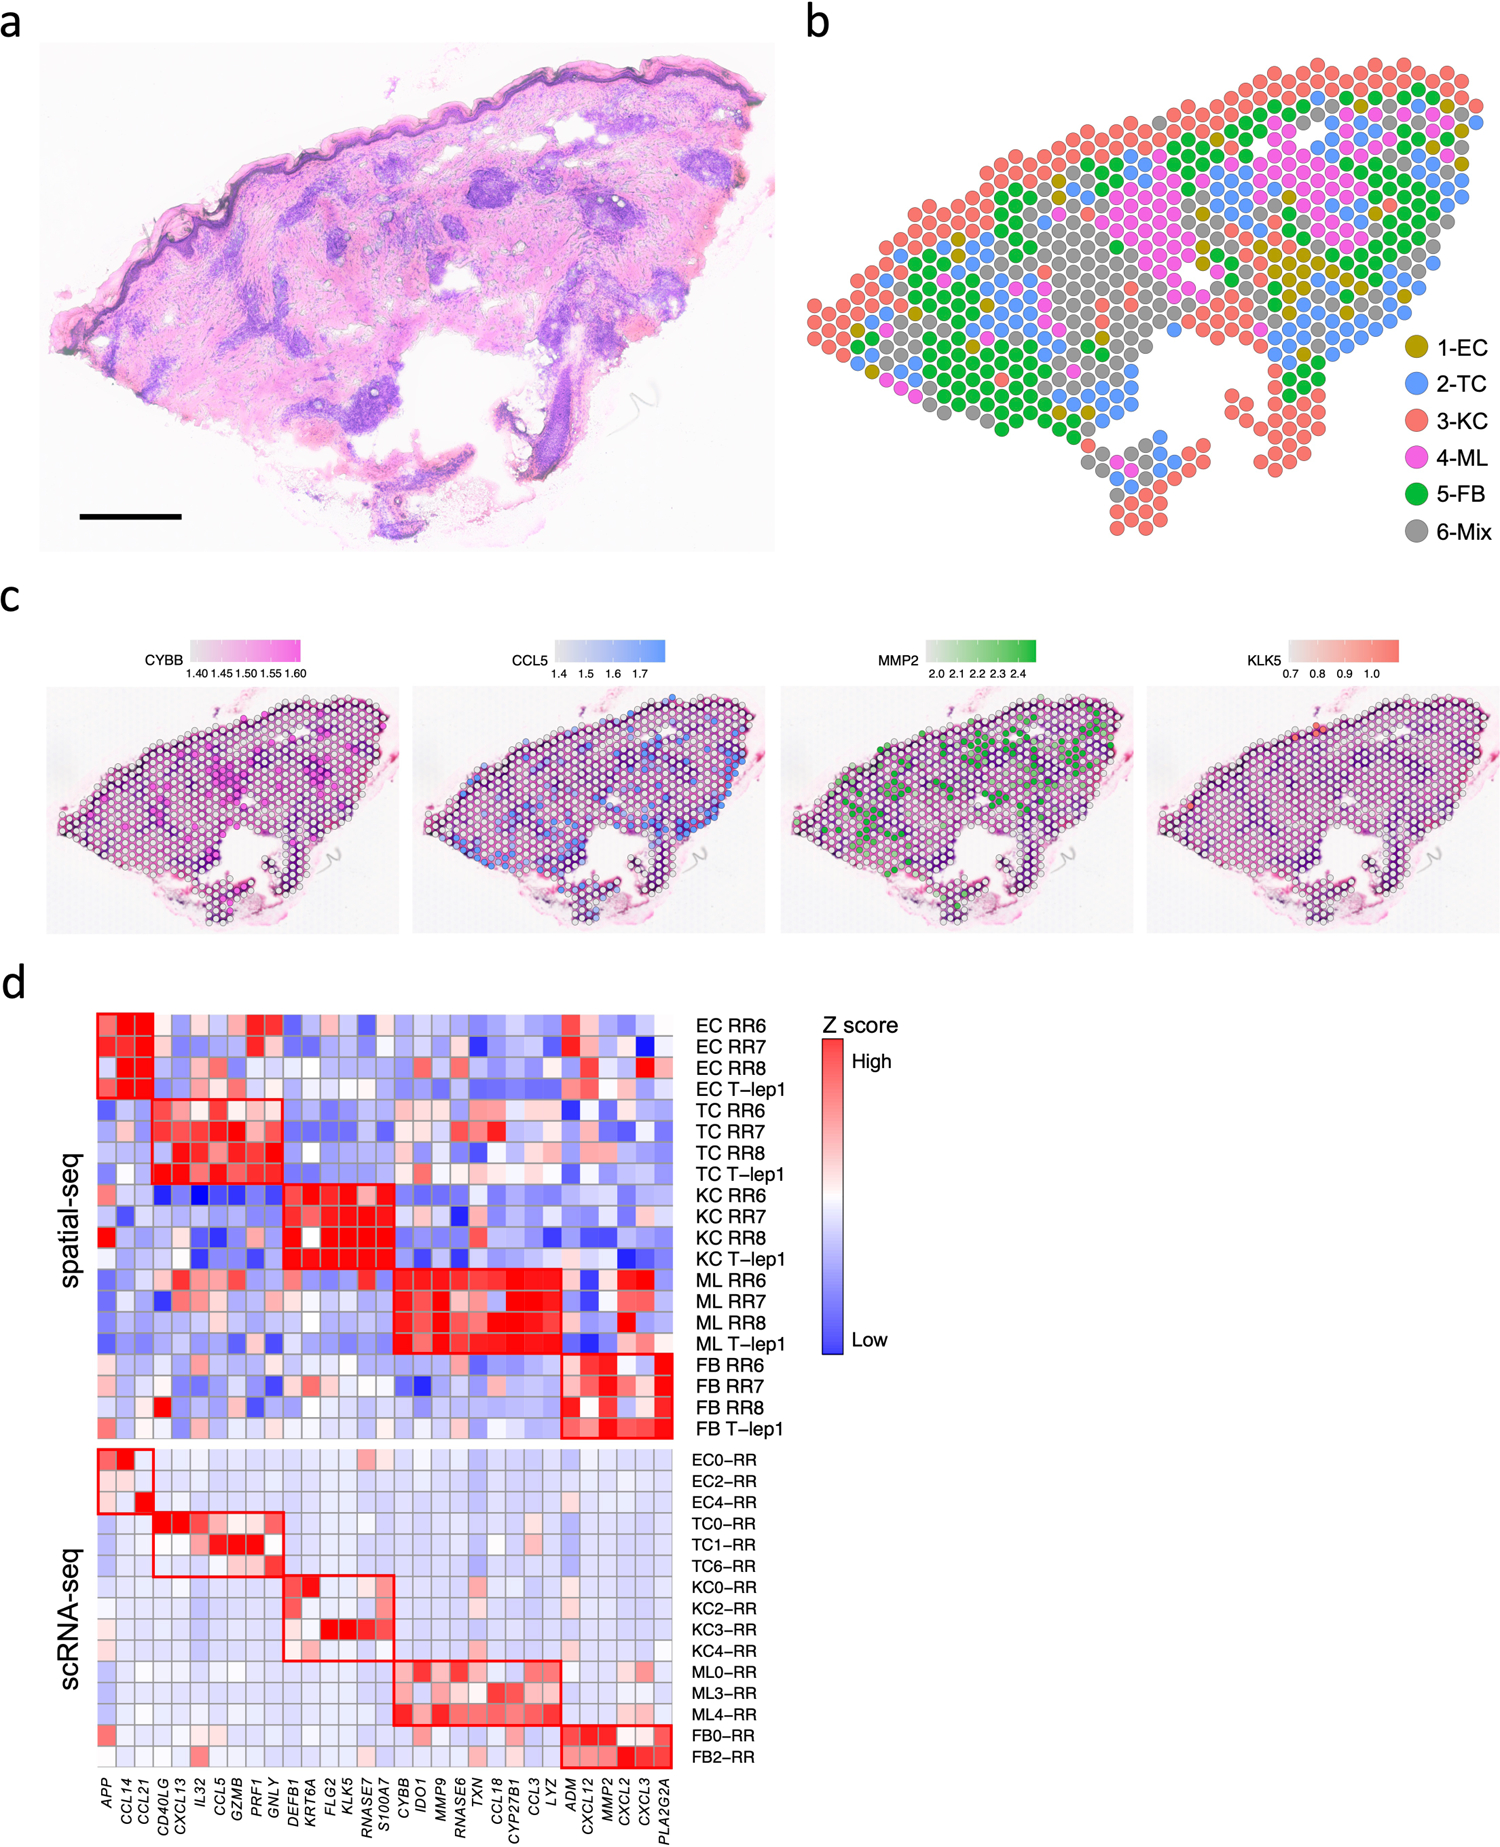
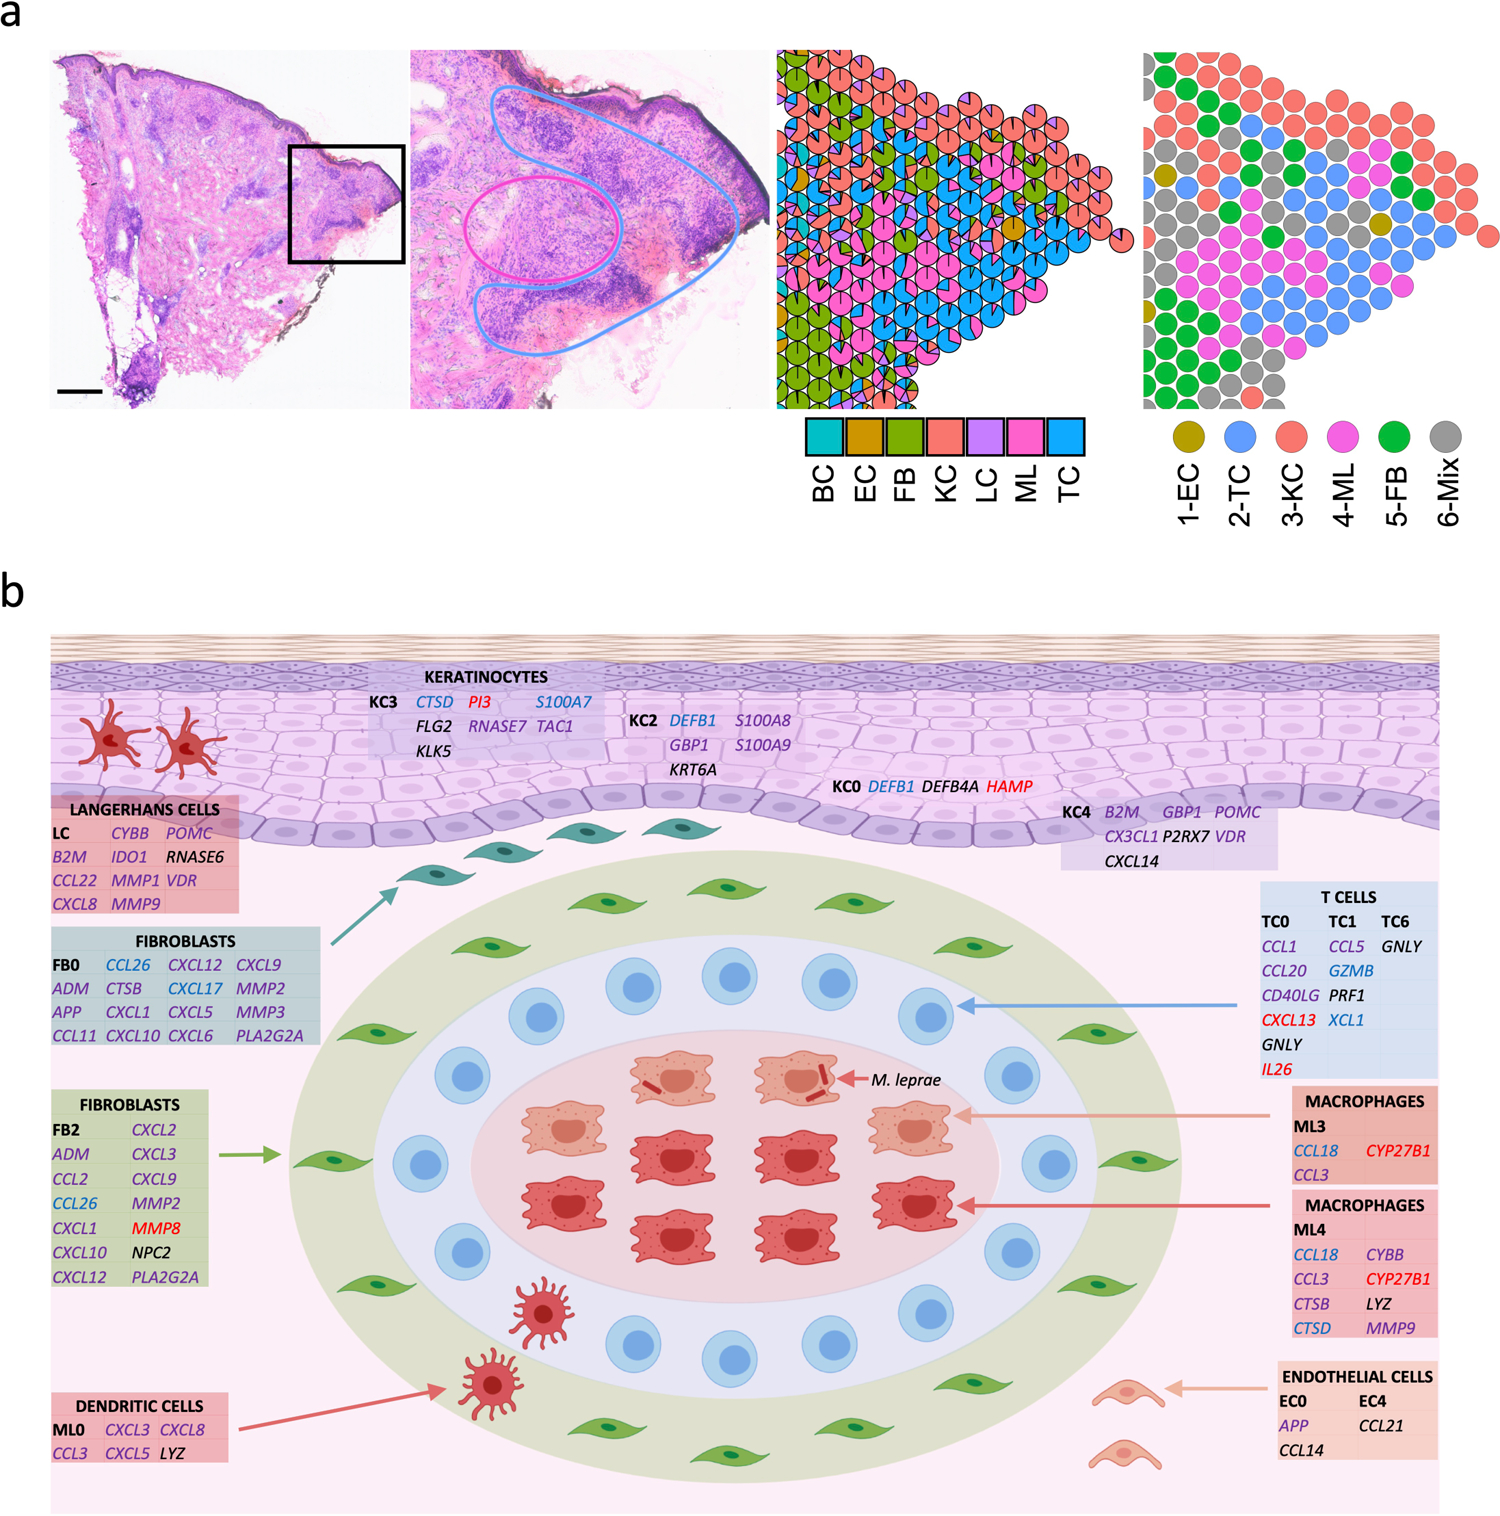
Granulomas are complex cellular structures composed predominantly of macrophages and lymphocytes that function to contain and kill invading pathogens. Here, we investigated the single-cell phenotypes associated with antimicrobial responses in human leprosy granulomas by applying single-cell and spatial sequencing to leprosy biopsy specimens. We focused on reversal reactions (RRs), a dynamic process whereby some patients with disseminated lepromatous leprosy (L-lep) transition toward self-limiting tuberculoid leprosy (T-lep), mounting effective antimicrobial responses. We identified a set of genes encoding proteins involved in antimicrobial responses that are differentially expressed in RR versus L-lep lesions and regulated by interferon-γ and interleukin-1β. By integrating the spatial coordinates of the key cell types and antimicrobial gene expression in RR and T-lep lesions, we constructed a map revealing the organized architecture of granulomas depicting compositional and functional layers by which macrophages, T cells, keratinocytes and fibroblasts can each contribute to the antimicrobial response.


Conflict of interest statement

Declaration of Interests

A.K.S. reports compensation for consulting and/or SAB membership from Merck, Honeycomb Biotechnologies, Cellarity, Cogen Therapeutics, Orche Bio, and Dahlia Biosciences. The remaining authors declare no competing interests.

Figures

Extended Data Fig. 1
Extended Data Fig. 1. IFN-α/β and IFN-γ signature on CTL subtypes and co-expression of IFNG, GZMB, PRF1 and GNLY.
a. UMAP plot for 2,290 T cells colored by patient identities. b. Individual UMAP for the T cells from each patient. c. Enrichment analysis on differentially expressed genes (adjusted p value < 0.05) between TC1 (RR CTL) and TC2 (L-lep CTL) using IFN-α/β and IFN-γ specific genes identified in human PBMC. Dotted lines indicate (left) no enrichment or (right) the hypergeometric test p value of 0.05 (log p value = 1.3). d. UMAP plots showing co-expression of IFNG, GMZB, PRF1 and GNLY in RR CTL and amCTL. e. T cell subtype comparisons between scRNA-seq datasets from human leprosy skin biopsy specimens and from lung samples of a non-human primate model of tuberculosis. The color scale represents the z scores of the gene expression signature scores.
Extended Data Fig. 2
Extended Data Fig. 2. Dendritic cell subpopulations and comparison of macrophage sub-clusters.
a. UMAP plot for 991 myeloid cells colored by patient identities. b. Individual UMAP for the myeloid cells from each patient. c. UMAP plots showing CD1C and LAMP3 expression in ML0. Only few co-expression events were observed, indicating distinct dendritic cell subpopulations. d. Heatmap showing top differentially expressed genes between ML2 and ML4. ML3 expressed both ML2 and ML4 specific genes. e. UMAP plots showing TREM2 expression, APOE expression and TREM2 module score. The color scale represents the expression level of the genes or the level of the module score. f. Myeloid cell subtype comparisons between scRNA-seq data sets from human leprosy skin biopsy specimens and from lung samples of a non-human primate model of tuberculosis. The color scale represents the z scores of the gene expression signature scores.
Extended Data Fig. 3
Extended Data Fig. 3. Identification of keratinocyte subtypes.
a. UMAP plot for 3,748 keratinocytes colored by subtypes. b. UMAP plot for 3,748 keratinocytes colored by clinical forms. c. Heatmap showing marker genes for each keratinocyte subtype. The representative genes are labelled. d. Abundance composition across all samples for each keratinocyte subtype. e. UMAP plot for 1,010 fibroblasts colored by subtypes. f. Abundance composition across all samples for each fibroblast subtype. g. Heatmap showing marker genes for each fibroblast subtype. The representative genes are labelled. h. UMAP plot for 1,219 endothelial cells colored by subtypes. i. Abundance composition across all samples for each endothelial cell subtype. j. Dot plot showing 10 marker genes for each endothelial subtype. The color scale represents the scaled expression of the gene. The size of the dot represents the percentage of cells expressing the gene.
Extended Data Fig. 4
Extended Data Fig. 4. Pseudotime construction in macrophages and keratinocytes.
a. Pseudo-temporal trajectory colored by pseudotime (top) and by sub-cluster identity (bottom) for macrophage sub-cluster 2, 3 and 4. b. Heatmap showing six expression patterns along the macrophage pseudotime trajectory as depicted on the x axis. Representative genes regulated by IL1B and IFNG are labelled. c. Pseudo-temporal trajectory colored by pseudotime (top) and by sub-cluster identity (bottom) for keratinocyte sub-cluster 1, 2 and 3. d. Heatmap showing six expression patterns along the keratinocyte pseudotime trajectory as depicted on the x axis. Representative genes regulated by IL1B and IFNG are labelled.
Extended Data Fig. 5
Extended Data Fig. 5. Representative antimicrobial genes expressed by the major cell types.
a. Bar plot showing the expression of the antimicrobial genes in each RR subtype. The height of the bar represents the z score of the gene in each subtype. The dots represent the gene’s expression level in individual cells. b. Heat map showing z scores of antimicrobial genes in RR cell types. The red boxes indicate distinct sets of antimicrobial genes highly expressed in endothelial cells, fibroblasts, keratinocytes, myeloid cells and T cells.
Extended Data Fig. 6
Extended Data Fig. 6. Cell type composition and clustering of the RR6 and T-lep1 spatial-seq sample.
a. Scatter pie plot showing the cell type composition of the RR6 spatial-seq sample. Each spot is represented as a pie chart showing the relative proportion of the cell types. b. Heatmap showing the average cell type prediction score for each cluster of the RR6 spatial-seq sample. c. H & E staining of the T-lep1 biopsy used for spatial sequencing. Scale bar: 0.5 mm. d. Scatter pie plot showing the cell type composition of the T-lep1 spatial-seq sample. Each spot is represented as a pie chart showing the relative proportion of the cell types. e. Spatial plot for 1,154 spots colored by clusters, the coordinates of the spot correspond to the location in the T-lep1 sample tissue. f. Heatmap showing the average cell type prediction score for each cluster of the T-lep1 spatial-seq sample.
Extended Data Fig. 7
Extended Data Fig. 7. Spatial sequencing for two additional RR samples and subtypes location for the RR6 sample.
a. H & E staining of the RR7 biopsy used for spatial sequencing (top left), scale bar: 0.5 mm. Scatter pie plot showing the cell type composition of the RR7 spatial-seq sample. Each spot is represented as a pie chart showing the relative proportion of the cell types (top right). Spatial plot for 418 spots colored by clusters, the coordinates of the spot correspond to the location in the tissue (bottom left). Heatmap showing the average cell type prediction score for each cluster (bottom right). b. H & E staining of the RR8 biopsy used for spatial sequencing (top left), scale bar: 0.5 mm. Scatter pie plot showing the cell type composition of the RR8 spatial-seq sample. Each spot is represented as a pie chart showing the relative proportion of the cell types (top right). Spatial plot for 214 spots colored by clusters, the coordinates of the spot correspond to the location in the tissue (bottom left). Heatmap showing the average cell type prediction score for each cluster (bottom right). c. Subtype prediction scores for the RR6 spatial-seq sample. The spots in the corresponding cluster were used to plot the subtype scores. For example, the FB0 prediction score was plotted in the spots from cluster 5, which was annotated as fibroblasts.
Extended Data Fig. 8
Extended Data Fig. 8. Spatial distance between the FB0 and FB2 sub-clusters and the epidermis in the RR and T-lep samples.
a. Spatial plots showing the identified epidermis, FB0 and FB2 spots in the RR6 sample (left). Violin plot showing the distance of each FB0 and FB2 spot to the nearest epidermis spot. b. Spatial plots showing the identified epidermis, FB0 and FB2 spots in the T-lep1 sample (left). Violin plot showing the distance of each FB0 and FB2 spot to the nearest epidermis spot. c. Spatial plots showing the identified epidermis, FB0 and FB2 spots in the RR7 sample (left). Violin plot showing the distance of each FB0 and FB2 spot to the nearest epidermis spot. d. Spatial plots showing the identified epidermis, FB0 and FB2 spots in the RR8 sample (left). Violin plot showing the distance of each FB0 and FB2 spot to the nearest epidermis spot. e. Violin plot showing the distance of each FB0 and FB2 spot to the nearest epidermis spot in all three RR and the T-lep spatial-seq samples. The p value (1.32e-14) was calculated from a two-sided Wilcoxon rank sum test (152 FB0 spots vs 120 FB2 spots).
Extended Data Fig. 9
Extended Data Fig. 9. Immunohistochemistry validation of DEFB1, CXCL14 and TAC1 protein expression in the epidermis of three RR and three L-lep biopsy specimens.
a. Immunohistochemistry using monoclonal antibodies to DEFB1. The corresponding isotype controls were negative. Scale bar: 20 μm. Original magnification: x200. b. Immunohistochemistry using monoclonal antibodies to CXCL14. The corresponding isotype controls were negative. Scale bar: 20 μm. Original magnification: x200. c. Immunohistochemistry using monoclonal antibodies to TAC1. The corresponding isotype controls were negative. Scale bar: 20 μm. Original magnification: x200. d. Antimicrobial activity was determined by pretreatment of MDMs from healthy donors with 1μM of DEFB1 (n=3), CXCL14 (n=4) and TAC1 (n=5) for 30 minutes followed by M. leprae infection (MOI 5:1). Rifampicin (RIF, 10ug/ml) was used as positive control. M. leprae viability was determined by qPCR after 4 days and % antimicrobial activity was calculated by assigning 100% viability to the media control. All data represent the mean ± SEM. Statistical analyses were performed using mixed effects analysis with Dunnet’s multiple comparisons test in the GraphPad Prism 8 software. *p<0.05, **p<0.01, ****p<0.0001.
Extended Data Fig. 10
Extended Data Fig. 10. TREM2 module score comparison in the RR, T-lep and L-lep spatial-seq samples.
a. H & E staining of the two L-lep biopsies used for spatial sequencing. The first tissue slide was folded in the dermis region, thus a replicate slide from the same tissue covering the dermis region was processed in the same spatial-seq run. Scale bar: 0.5 mm. b. Scatter pie plot showing the cell type composition of the two L-lep spatial-seq samples. Each spot is represented as a pie chart showing the relative proportion of the cell types. c. Spatial plots showing the TREM2 module score in the myeloid spots from all spatial-seq samples. The same color scale was applied across the samples. d. Violin plot showing the TREM2 module score in the myeloid spots for individual samples. The p value (<2.2e-16) was calculated from a two-sided Wilcoxon rank sum test (329 RR and T-lep spots vs 760 L-lep spots). e. Heatmap showing the number of neighbors for each pair of cell types in the RR and T-lep spatial-seq samples. The percentage of the numbers were calculated for each row, thus each row sum to 1. f. Heatmap showing the number of neighbors for each pair of cell types in the L-lep spatial-seq samples. The percentage of the numbers were calculated for each row, thus each row sum to 1.
Fig. 1.
Fig. 1.. Cell types observed in leprosy lesions.
a. UMAP plot for 21,318 cells colored by cell types. b. UMAP plot colored by clinical forms. c. Heatmap showing three representative marker genes for each cell type. d. Abundance composition across all samples for each cell type. T tests were conducted between the L-lep and RR samples for each cell type (excluding the Langerhans cells), only plasma cells had a p value <0.05. e. Violin plot showing the number of M. leprae transcripts detected in individual cells from each patient.
Fig. 2.
Fig. 2.. Identification of T cell subtypes.
a. UMAP plot for 2,290 T cells colored by subtypes. b. Heatmap showing marker genes for each subtype. The representative genes are labelled. c. UMAP plots showing six marker genes. The color scale represents normalized expression level of the gene. d. Abundance composition across all samples for each T cell subtype. Two sided T tests were conducted between the L-lep and RR samples (5 vs 5) for each subtype, TC0 and TC2 had p values <0.05. e. (Left) Violin plots showing the expression for GZMB, PRF1 and GNLY in T cell sub-cluster 6 grouped by L-lep and RR. (Right) Boxplot showing the T-CTL score in T cell sub-cluster 6 grouped by L-lep and RR, the p value (0.0017) was calculated from a two-sided Wilcoxon rank sum test (64 L-lep cells vs 70 RR cells). The bounds of the box represent the first and third quartile, the middle bar represents the median. f. Number of RR cells expressing IFNG, GMZB, PRF1 and GNLY in RR CTL and amCTL.
Fig. 3.
Fig. 3.. Identification of myeloid cell subtypes.
a. UMAP plot for 991 myeloid cells colored by subtypes. b. UMAP plot colored by clinical forms. c. Heatmap showing marker genes for each subtype. The representative genes are labelled. d. Abundance composition across all samples for each myeloid cell subtype. e. (Left) Violin plots showing the expression for TREM2 and APOE in myeloid subtypes. (Right) Violin plot showing the TREM2 Module score in myeloid subtypes.
Fig. 4.
Fig. 4.. Antimicrobial gene analysis and pseudotime construction.
a. Boxplot showing the sum of 1,124 antimicrobial gene z scores in L-lep and RR cell types. The p value (< 2.2e-16) was calculated from a two-sided T test (n = 1,124). The bounds of the box represent the first and third quartile, the middle bar represents the median. b. Bar graph showing the top 20 upstream regulators ranked by p value from the enrichment analysis using the 1,124 antimicrobial genes. c. Boxplot showing the sum of the z scores for the top 20 upstream regulators in L-lep and RR cell types. The p value (3.5e-09) was calculated from a two-sided T test (n = 1,124). The bounds of the box represent the first and third quartile, the middle bar represents the median. d. Pseudotime trajectory colored by clinical form in myeloid sub-cluster 2, 3 and 4. e. Pseudotime trajectory colored by clinical form in keratinocyte sub-cluster 1, 2 and 3. f. Dot plot showing the correlation between the module scores of the top 10 upstream regulators and macrophage/keratinocyte pseudotimes. The size of the dots represents the −log10(p value) from the enrichment analysis. g. Scatter plot showing the correlation between macrophage (top) or keratinocyte (bottom) pseudotimes and module scores calculated using IL1B target genes or IFNG target genes from the six expression patterns. Color of the dots represents the sub-cluster identity of the cells.
Fig. 5.
Fig. 5.. Antimicrobial network induced by IL1B and IFNG.
a. Bar plot showing the z scores of IL1B (left) or IFNG (right) expression levels in each cell type from RR lesions. The dots represent IL1B or IFNG expression level in individual cells. b. Circos plot showing the connection between IL1B (left) or IFNG (right) and the direct antimicrobial gene targets in the cell types with z score >3. The color represents patient composition of the cell type. Red: L-lep specific; Blue: RR specific; Grey: mix of L-lep and RR.
Fig. 6.
Fig. 6.. Spatial sequencing recapitulates the same set of antimicrobial genes in the corresponding cell types.
a. H & E staining of the RR6 biopsy used for spatial sequencing. Scale bar: 0.5 mm. b. Spatial plot for 708 spots colored by clusters, the coordinates of the spot correspond to the location in the tissue. c. Spatial plots showing expression level of four antimicrobial genes. The colors correspond to the cluster colors in B. CYBB was highly expressed in myeloid cells, CCL5 in T cells, MMP2 in fibroblasts and KLK5 in keratinocytes. d. Heatmaps showing 31 antimicrobial genes expressed in the same cell types in both spatial-seq and scRNA-seq. All the RR and T-lep spatial-seq samples were plotted. The red boxes indicate distinct sets of antimicrobial genes highly expressed in a certain cell-type. RR: reversal reaction; T-lep: borderline tuberculoid.
Fig. 7.
Fig. 7.. Granuloma architecture and antimicrobial ecosystem obtained by scRNA-seq and spatial-seq.
a. H & E staining of the T-lep biopsy and the cell type composition highlighting the myeloid cells in the center of the granuloma and the T cells and fibroblasts at the periphery. Scale bar: 0.5 mm. b. Granuloma architecture and antimicrobial ecosystem. Gene names in red represent targets of IL1B. Gene names in blue represent targets of IFNG. Gene names in purple represent targets of both IL1B and IFNG. Gene names in black were curated from known antimicrobial pathways.

Comment in

References

    1. Gordon S Alternative activation of macrophages. Nat. Rev. Immunol 3, 23–35 (2003). - PubMed
    1. Ridley DS & Jopling WH Classification of leprosy according to immunity. A five-group system. Int J Lepr 34, 255–273 (1966). - PubMed
    1. Modlin RL, Hofman FM, Taylor CR & Rea TH T lymphocyte subsets in the skin lesions of patients with leprosy. J. Am. Acad. Dermatol 8, 182–189 (1983). - PubMed
    1. Stenger S et al. Differential effects of cytolytic T cell subsets on intracellular infection. Science 276, 1684–1687 (1997). - PubMed
    1. Stenger S et al. An antimicrobial activity of cytolytic T cells mediated by granulysin. Science 282, 121–125 (1998). - PubMed

Publication types

MeSH terms