. 2021 Jun 1;24(6):102678.
doi: 10.1016/j.isci.2021.102678. eCollection 2021 Jun 25.

A critical role for MSR1 in vesicular stomatitis virus infection of the central nervous system

Affiliations

A critical role for MSR1 in vesicular stomatitis virus infection of the central nervous system

Duomeng Yang et al. iScience. .

Abstract

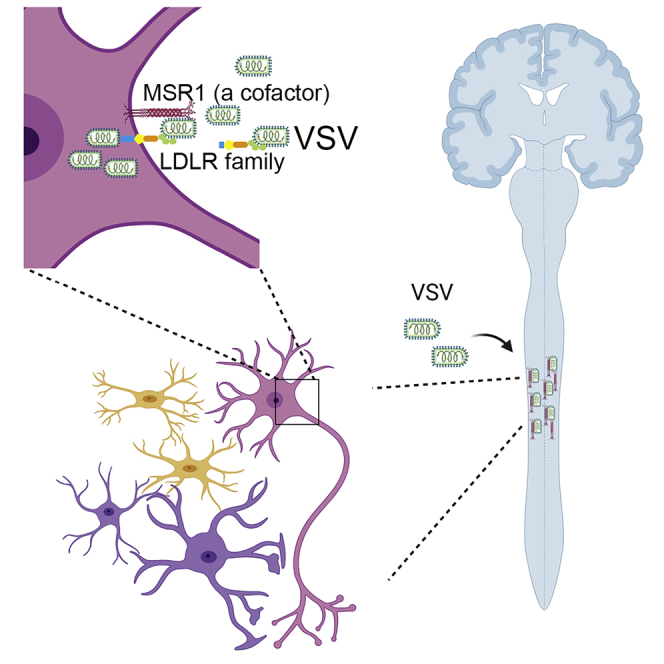
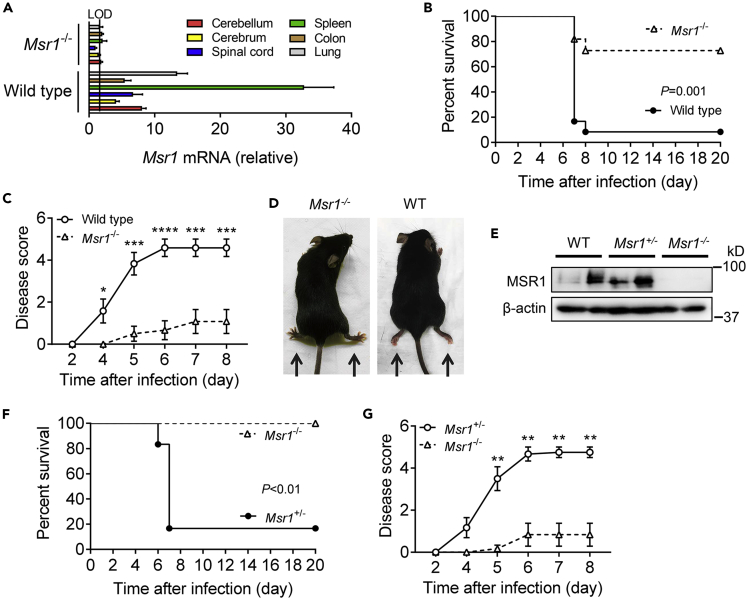
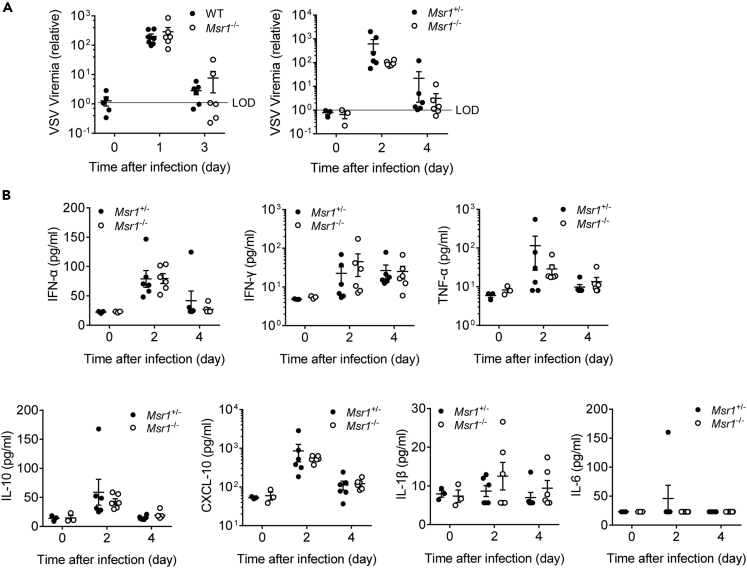
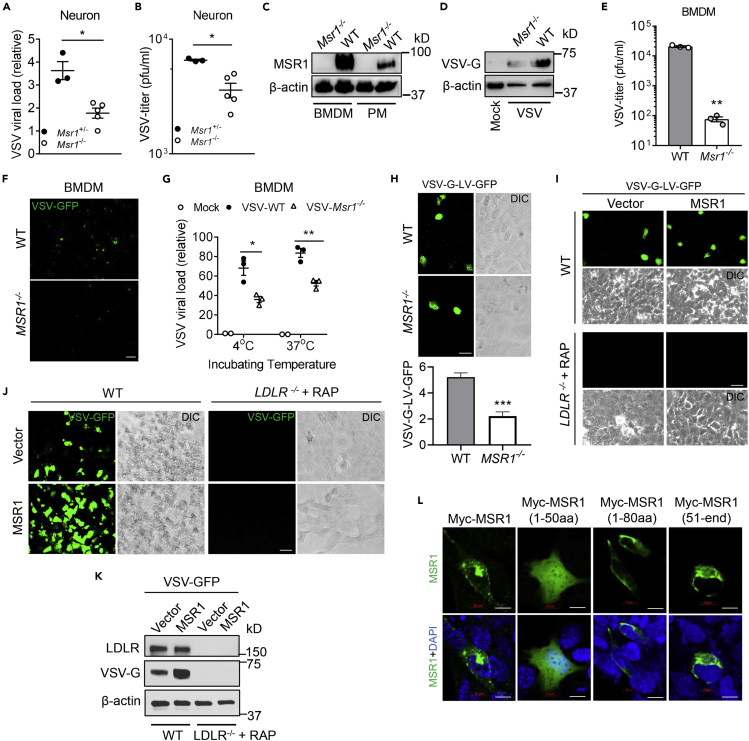
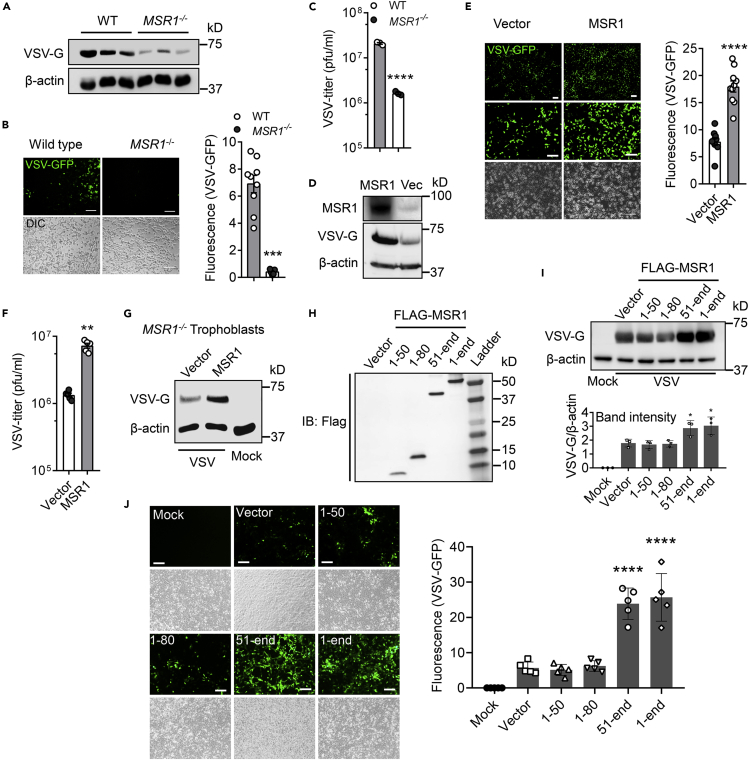
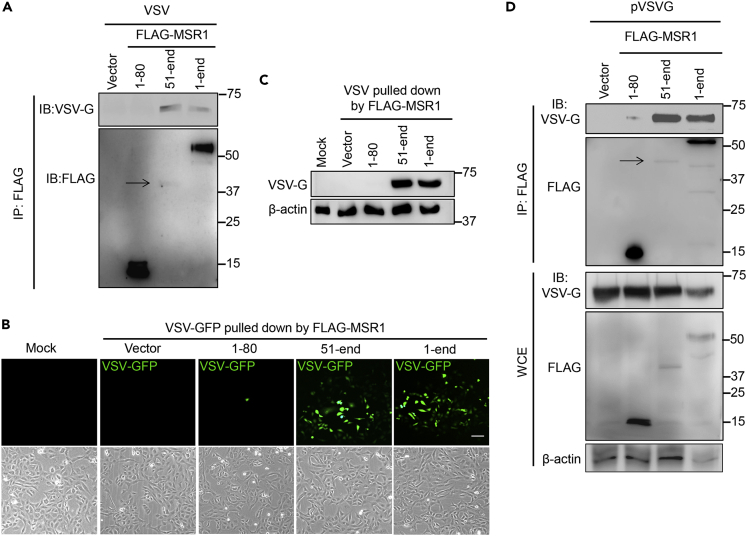
Macrophage scavenger receptor 1 (MSR1) plays an important role in host defense to bacterial infections, M2 macrophage polarization, and lipid homeostasis. However, its physiological function in viral pathogenesis remains poorly defined. Herein, we report that MSR1 facilitates vesicular stomatitis virus (VSV) infection in the central nervous system. Msr1-deficient (Msr1 -/-) mice presented reduced morbidity, mortality, and viral loads in the spinal cord following lethal VSV infection, along with normal viremia and innate immune responses, compared to Msr1 +/- littermates and wild-type mice. Msr1 expression was most significantly upregulated in the spinal cord, the predominant target of VSV. Mechanistically, through its extracellular domains, MSR1 interacted with VSV surface glycoprotein and facilitated its cellular entry in a low-density lipoprotein receptor-dependent manner. In conclusion, our results demonstrate that MSR1 serves as a cofactor for VSV cellular entry and facilitates its infection preferentially in the spinal cord.

Keywords: Cell biology; Molecular physiology; Neuroscience; Virology.


Conflict of interest statement

The authors declare no competing interest.

Figures

None
Graphical abstract
Figure 1
Figure 1
Msr1 contributes to VSV pathogenesis in mice (A) Msr1 mRNA expression in various tissues of wild-type (WT, C57BL/6) and Msr1−/− mice. LOD, limit of detection; N = 3 mice per genotype. (B and C) The survival curves (B) and disease scores (C) of WT and Msr1−/− mice challenged with 1×10⁷ plaque-forming units (PFUs) per mouse of VSV by retro-orbital injection, N = 12 mice/genotype. p = 0.001 (log rank test), ∗p < 0.05; ∗∗p < 0.01; ∗∗∗p < 0.001; ∗∗∗∗p < 0.0001, non-parametric Mann-Whitney U test. All the error bars: mean ± standard error of the mean (S.E.M.). (D) The WT mice with paralyzed hindlimbs at day 6 after infection. (E) Immunoblots of Msr1 protein expression in bone-marrow-derived macrophages (BMDMs) of WT, Msr1−/−, and Msr1+/− littermates. β-actin is a housekeeping control. (F and G) The survival curves (F) and disease scores (G) of Msr1−/− and Msr1+/− littermates challenged with 1 × 107 PFU/mouse of VSV by retro-orbital injection, N = 6 mice/genotype. For percent survival, p < 0.01 (log rank test); for disease score, ∗∗p < 0.01, non-parametric Mann-Whitney U test. All the error bars: mean ± S.E.M.
Figure 2
Figure 2
Msr1 is dispensable for systemic VSV dissemination and innate immune responses (A) The RNA viremia in the whole blood of WT and Msr1−/− mice, Msr1+/−, and Msr1−/− littermates infected with VSV, assessed by quantitative RT-PCR, N = 6 mice/genotype in each experiment. The VSV RNA is expressed as a fold change over limit of detection (LOD)s. (B) The serum levels of type I IFN and inflammatory cytokines (IFN-α, IFN-γ, TNF-α, IL-10, CXCL-10, IL-1β, IL-6) in Msr1+/− and Msr1−/− littermates after VSV infection, assessed by multiplex ELISA, N = 6 mice/genotype. All the data are presented as mean ± S.E.M., and statistical significance is analyzed by non-parametric Mann-Whitney U tests.
Figure 3
Figure 3
Msr1 is critical for VSV infection in the central nervous system (A–C) Quantitative RT-PCR analyses of VSV loads in (A) different tissues of Msr1+/− and Msr1−/− littermates on day 6 after infection (N = 3 mice/genotype), (B) the spinal cords, and (C) the brains of Msr1+/− and Msr1−/− littermates on day 6 after infection (N = 6 mice/genotype). The viral RNA load is expressed as fold changes over the limit of detection (LOD). (D) The VSV titers in the spinal cord and brain of Msr1+/− and Msr1−/− littermates on day 6 after infection, assessed by a plaque-forming assay (N = 6 mice/genotype). (E) Msr1 mRNA expression (expressed as a fold change over the mock spinal cord group) in different tissues of mock and VSV-infected Msr1+/− mice on day 6 after infection, N = 3 mice/group. (F–H) (F) Correlation between Msr1 expression and VSV load in various tissues after VSV infection, N = 3 mice/group. The mRNA expression of class A and B scavenger receptors in (G) the spinal cord and (H) the brain of mock and VSV-infected Msr1+/− and Msr1−/− littermates on day 6 after virus inoculation, assessed by quantitative RT-PCR and expressed as a fold change over the Msr1+/--mock group, N = 3 mice/group. (I) Ldlr mRNA expression in the brain and spinal cord of mock and VSV-infected Msr1+/− and Msr1−/− littermates, expressed as a fold change over the brain of Msr1+/--mock group, N = 3 mice/group, ∗p < 0.05 vs brain, analyzed by non-parametric Mann-Whitney U test. Mock: no virus infection control. (J) Colocalization of MSR1 with microglia, astrocytes, and neurons in the mouse spinal cord by dual immunofluorescence staining. IBA1: a marker of microglia; GFAP: a marker of astrocyte; MAP2: a marker of neuron; DAPI: nuclei. The yellow regions in the overlay indicate colocalizations. Scale bar represents 10 μm. All the data are presented as mean ± S.E.M., and statistical significances are analyzed by non-parametric Mann-Whitney U test, ∗p < 0.05, ∗∗p < 0.01.
Figure 4
Figure 4
MSR1 mediates cellular entry of VSV in primary mouse cells and human cells (A and B) VSV loads in primary neurons of Msr1+/− and Msr1−/− littermates at 36 h after inoculation (MOI = 1, multiplicity of infection = 3), as assessed by (A) quantitative RT-PCR (expressed as a fold change over the lowest viral load) and (B) plaque forming assay. Each dot represents an individual mouse. (C) Immunoblots of MSR1 protein expression in WT and Msr1−/− bone-marrow-derived macrophages (BMDMs) and peritoneal macrophages (PMs). (D–F) (D) VSV-G protein expression in BMDMs, (E) virus titer in culture medium, and (F) VSV-GFP fluorescence under microscopy in BMDMs at 48 h after VSV-GFP infection (MOI = 5), N = 3 biological replicates. Objective: 20×, scale bar: 100 μm. (G) Quantitative RT-PCR analyses of VSV virions attached to BMDMs (4°C for 2 h) and entry into BMDMs (37°C for 30 min). The cells were washed 3 times with cold PBS before switching from 4°C to 37°C and after 37°C as well. MOI = 10, N = 3 biological replicates. (H) GFP expression in WT and MSR1−/− trophoblasts, 24 h after transduction with GFP-encoding VSV-G-pseudotyped lentiviral vectors (VSV-G-LV-GFP) without polybrene. Scale bar: 50 μm. The statistic VSV-G-LV-GFP was acquired with a fluorescence microscope from 9 random fields of three biological replicates. (I) GFP expression in WT and LDLR−/−+ RAP trophoblasts, 24 h after transduction with VSV-G-LV-GFP. The LDLR−/− trophoblasts were pre-treated with RAP (200 nM, 30 min, 37°C) followed by VSV-G-LV-GFP transduction. (J and K) The GFP fluorescence (J) and immunoblots of protein level (K) in VSV-GFP-infected WT and LDLR−/−+RAP trophoblasts with or without MSR1 overexpression; the WT and LDLR−/− trophoblasts were transfected with human MSR1 plasmid for 24 h, followed by VSV-GFP infection for 18 h (MOI = 0.5). The LDLR−/− trophoblasts were pre-treated with RAP (200 nM, 30 min, 37°C) before inoculation of VSV-GFP. Scale bar: 50 μm. (L) Immunofluorescence staining for different Myc-tagged MSR1 fragments in human trophoblasts, 24 h after transfection of plasmids. Myc proteins were stained by a mouse anti-Myc antibody, followed by an Alexa Fluor 488 (green)-conjugated secondary antibody. The cell nuclei were stained by DAPI (blue). Scale bar: 10 μm. β-actin is a housekeeping control. Mock: no virus infection control. All the data are presented as mean ± S.E.M., and statistical significances are analyzed by a standard two-tailed unpaired Student's t-test, ∗p < 0.05, ∗∗p < 0.01, ∗∗∗p < 0.001.
Figure 5
Figure 5
MSR1 facilitates cellular entry of VSV through its extracellular domains (A–C) WT and MSR1−/− trophoblasts were examined at 12 h after VSV-GFP inoculation, (A) immunoblots of VSV-G protein level, (B) VSV-GFP fluorescence intensity, and (C) VSV titers in the cell culture medium, MOI = 0.5. N = 3 biological replicates. (D–F) WT and MSR1-overexpressed trophoblasts were examined at 12 h after VSV-GFP inoculation, (D) MSR1 protein expression, VSV-G protein level, (E) VSV-GFP fluorescence intensity, and (F) VSV titers in the culture medium, MOI = 0.5. N = 3 biological replicates. The VSV-GFP fluorescence intensity in (B) and (E) was acquired with a fluorescence microscope from 9 random fields of three biological replicates and quantified by ImageJ. Objective: 4x (top) and 20x, scale bar: 100 μm. (G) Immunoblots of VSV-G protein level in MSR1−/− trophoblasts with epichromosomal complementation of an empty vector or FLAG-MSR1 expression plasmid at 12 h after VSV infection, MOI=0.5. (H) The protein expression of different FLAG-tagged MSR1 fragments at 24 h after transfection of plasmids in trophoblasts. IB: immunoblotting. Amino residues 1-50 (cytoplasmic N-tail), 1-80 (cytoplasmic N-tail plus transmembrane), 51-end (extracellular domains with transmembrane), and 1-end (full length). (I) VSV-G protein level and (J) VSV-GFP fluorescence intensity in trophoblasts overexpressing FLAG-MSR1 fragments at 12 h after VSV-GFP infection at an MOI = 0.5. The GFP fluorescence intensity was acquired with a fluorescence microscope from random regions of three biological replicates (N = 3). β-actin is a housekeeping control. Mock: no virus infection control. Scale bar: 100 μm. All the data are presented as mean ± S.E.M., and statistical significances are analyzed by a standard two-tailed unpaired Student's t-test, ∗∗p < 0.01, ∗∗∗p < 0.001, ∗∗∗∗p < 0.0001, compare with WT or vector.
Figure 6
Figure 6
MSR1 interacts with VSV glycoprotein G via its extracellular domains (A–C) Binding of MSR1 to VSV virions. FLAG-MSR1 (human, 1-end) and its fragments (aa1-80, 51-end) were expressed in HEK293T cells and immunoprecipitated (IP) using anti-FLAG antibody-coated magnetic beads, which were then incubated with intact VSV-GFP virions (4°C for 2 h). The bound virions were eluted for (A) immunoblotting (IB) with a mouse monoclonal anti-FLAG and rabbit anti-VSV-G antibody (B and C) Re-infection in Vero cells for 12 h followed by detection of (B) VSV-GFP by fluorescence microscopy and (C) VSV-G protein level by immunoblotting. Mock: no virion control. (D) co-IP of FLAG-MSR1 and its fragments with VSV-G in HEK293T cells transfected with plasmids. WCE: whole-cell extraction. Arrows point to the faint protein bands.

References

    1. Beaudoin G.M., 3rd, Lee S.H., Singh D., Yuan Y., Ng Y.G., Reichardt L.F., Arikkath J. Culturing pyramidal neurons from the early postnatal mouse hippocampus and cortex. Nat. Protoc. 2012;7:1741–1754. - PubMed
    1. Beffert U., Stolt P.C., Herz J. Functions of lipoprotein receptors in neurons. J. Lipid Res. 2004;45:403–409. - PubMed
    1. Beier K.T., Saunders A., Oldenburg I.A., Miyamichi K., Akhtar N., Luo L., Whelan S.P., Sabatini B., Cepko C.L. Anterograde or retrograde transsynaptic labeling of CNS neurons with vesicular stomatitis virus vectors. Proc. Natl. Acad. Sci. U S A. 2011;108:15414–15419. - PMC - PubMed
    1. Bradbury E.J., McMahon S.B. Spinal cord repair strategies: why do they work? Nat. Rev. Neurosci. 2006;7:644–653. - PubMed
    1. Bukreyev A., Skiadopoulos M.H., Murphy B.R., Collins P.L. Nonsegmented negative-strand viruses as vaccine vectors. J. Virol. 2006;80:10293–10306. - PMC - PubMed

LinkOut - more resources