. 2021 Jan 27;3(1):vdab013.
doi: 10.1093/noajnl/vdab013. eCollection 2021 Jan-Dec.

Droplet digital PCR-based detection of circulating tumor DNA from pediatric high grade and diffuse midline glioma patients

Affiliations

Droplet digital PCR-based detection of circulating tumor DNA from pediatric high grade and diffuse midline glioma patients

Elisa Izquierdo et al. Neurooncol Adv. .

Abstract

Background: The use of liquid biopsy is of potential high importance for children with high grade (HGG) and diffuse midline gliomas (DMG), particularly where surgical procedures are limited, and invasive biopsy sampling not without risk. To date, however, the evidence that detection of cell-free DNA (cfDNA) or circulating tumor DNA (ctDNA) could provide useful information for these patients has been limited, or contradictory.

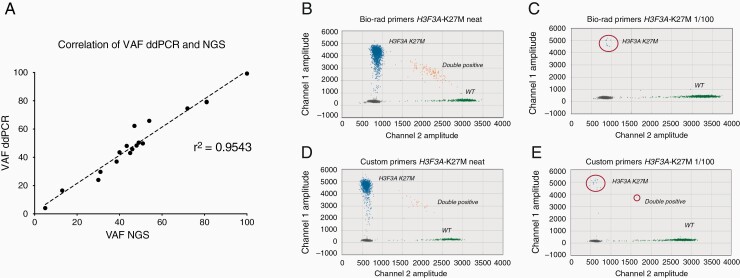
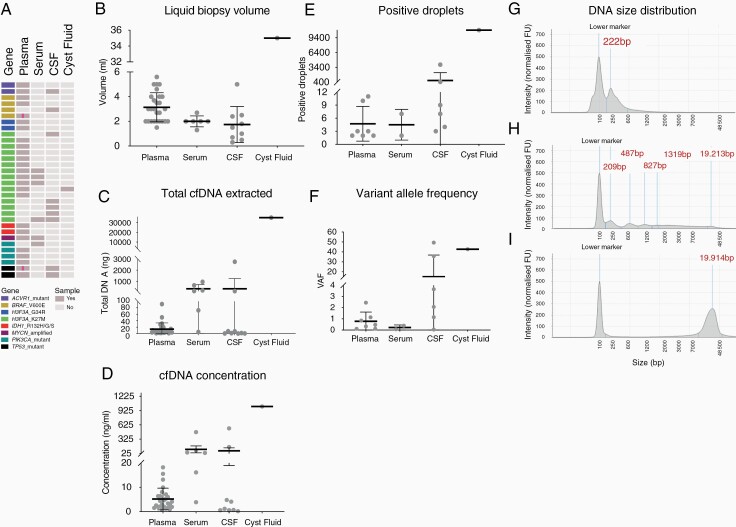
Methods: We optimized droplet digital PCR (ddPCR) assays for the detection of common somatic mutations observed in pediatric HGG/DMG, and applied them to liquid biopsies from plasma, serum, cerebrospinal fluid (CSF), and cystic fluid collected from 32 patients.

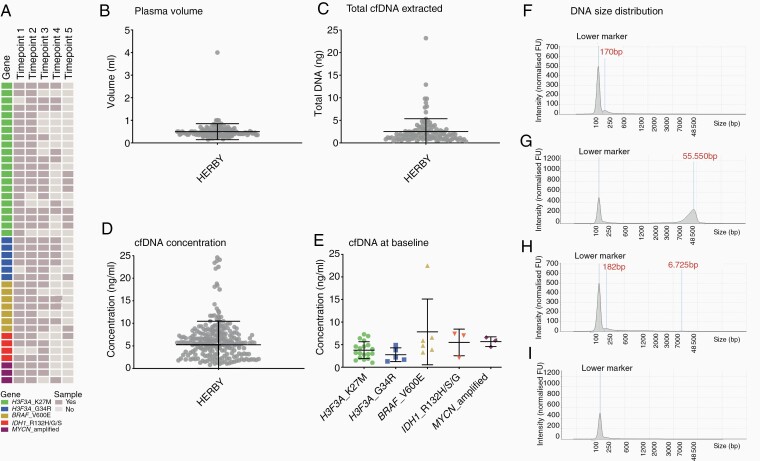
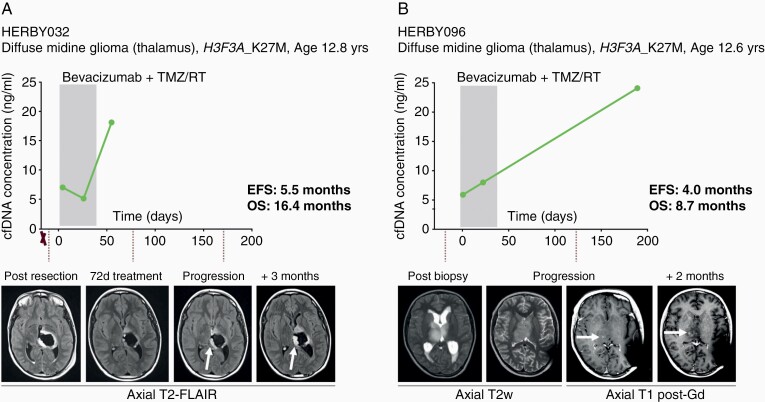
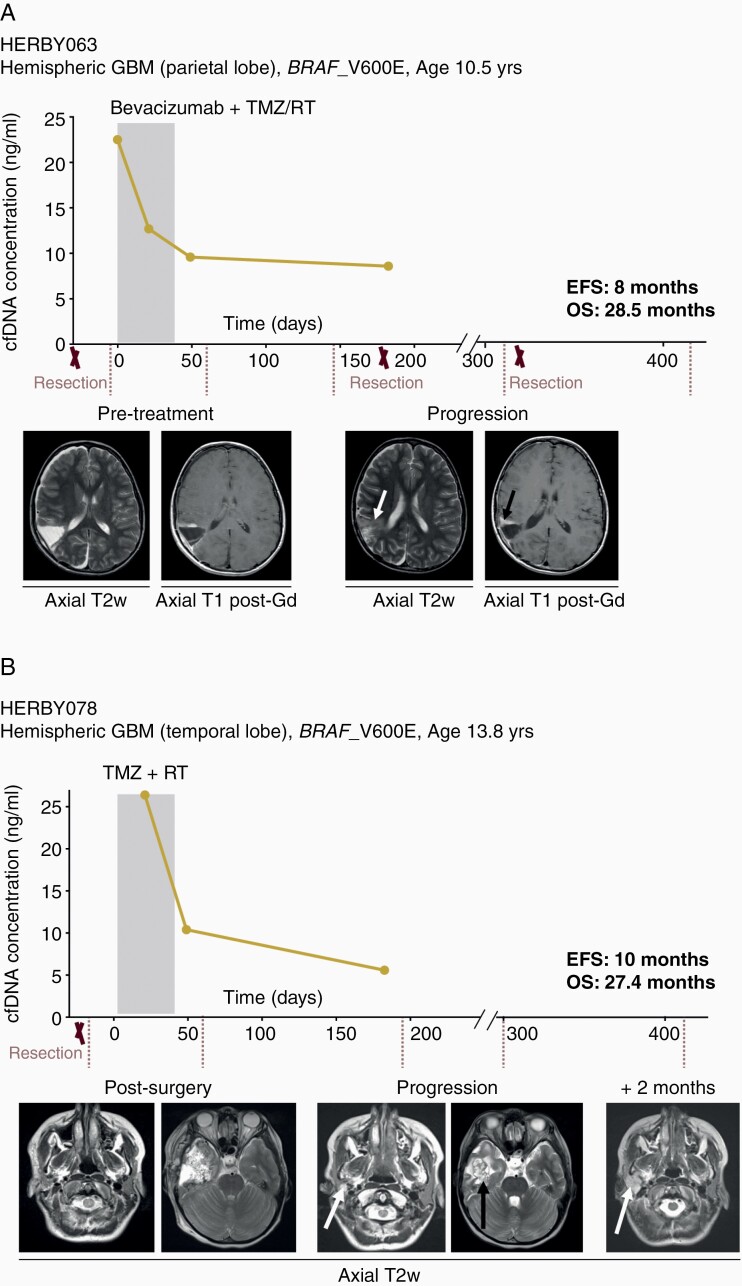
Results: Although detectable in all biomaterial types, ctDNA presented at significantly higher levels in CSF compared to plasma and/or serum. When applied to a cohort of 127 plasma specimens from 41 patients collected from 2011 to 2018 as part of a randomized clinical trial in pediatric non-brainstem HGG/DMG, ctDNA profiling by ddPCR was of limited use due to the small volumes (mean = 0.49 mL) available. In anecdotal cases where sufficient material was available, cfDNA concentration correlated with disease progression in two examples each of poor response in H3F3A_K27M-mutant DMG, and longer survival times in hemispheric BRAF_V600E-mutant cases.

Conclusion: Tumor-specific DNA alterations are more readily detected in CSF than plasma. Although we demonstrate the potential of the approach to assessing tumor burden, our results highlight the necessity for adequate sample collection and approach to improve detection if plasma samples are to be used.

Keywords: CSF; DIPG; HGG; cfDNA; ctDNA; plasma.


Figures

Figure 1.
Figure 1.
ddPCR assay validation. (A) Correlation of variant allele frequencies (VAFs) by NGS (x-axis) and ddPCR (y-axis) for ddPCR assay validation. 13 assays were tested in samples positive for the mutations analyzed (n = 18). A linear regression is fitted, with a Pearson correlation coefficient calculated and labeled, r2 = 0.9543. (B) Droplet digital PCR 2D amplitude plot of H3F3A_K27M tested in a positive control DIPG sample using the Bio-Rad assay on undiluted (neat) H3F3A_K27M DNA (1760/2226 VAF of 79.3%). (C) Bio-Rad assay on 1/100 dilution of H3F3A_K27M DNA with wild-type DNA (10/1564 droplets, VAF of 6.4%). (D) Custom assay on neat H3F3A_K27M DNA (1586/2014 VAF of 79.1%). (E) Custom assay on 1/100 dilution of H3F3A_K27M DNA with wild-type DNA (17/1613 droplets, VAF of 7.7%). H3F3A_K27M droplets are shown in blue, H3.3 wild-type droplets are shown in green, double positive droplets are shown in orange and empty droplets with no DNA are shown in grey.
Figure 2.
Figure 2.
Detection of genetic alterations in ctDNA from pHGG and DIPG patients. (A) A cohort of pHGG and DIPG samples used for liquid biopsy feasibility study, with each row representing a patient and each column a sample. Cells are colored by molecular alteration assessed and sample availability according to the key provided. A pink line indicates multiple samples for that case. (B) Dot plot of the volume of liquid biopsy used for cfDNA extraction, separated by the biological source material. Each sample is represented by a dot, the middle line represents the median, and the upper and bottom line the standard deviation. (C) Dot plot of total cfDNA extracted from liquid biopsy samples. Each sample is represented by a dot, the middle line represents the median, and the upper and bottom line the standard deviation. (D) Dot plot of cfDNA concentrations of liquid biopsy samples, separated by the biological source material. Each sample is represented by a dot, the middle line represents the median, and the upper and bottom line the standard deviation. (E) Dot plot of positive (>2) ddPCR droplets from liquid biopsy samples, separated by the biological source material. (F) Dot plot of variant allele frequency (VAF) for ctDNA samples, separated by biological source material. Each sample is represented by a dot and the middle line represents the mean. (G) Electropherogram of cfDNA size distribution was obtained by using the TapeStation for a representative serum sample (B118) showing a smear indicating a high degree of genomic DNA fragmentation. (H) Electropherogram of cfDNA size distribution obtained by using the TapeStation for a representative CSF sample (045-T) with a prominent ctDNA peak with an average size of 222 bp. (I) Electropherogram of cfDNA size distribution obtained by using the TapeStation for a representative CSF sample (C15-654) with intact genomic DNA contamination with an average size of 19,914 kb. The y-axis shows the signal intensity (FU) and the x-axis shows the DNA fragment size is represented in base pairs (bp).
Figure 3.
Figure 3.
Quantitation of plasma samples collected as part of the HERBY clinical trial. (A) A cohort of nonbrainstem pHGG plasma samples from the HERBY clinical trial, with each row representing a patient and each column a sample. Cells are colored by molecular alteration assessed and sample availability according to the key provided. Time-points are as follows: 1 = baseline, 2 = week 3, 3 = week 7, 4 = month 6, 5 = end of treatment. (B) Dot plot of volume of plasma used for cfDNA extraction. Each sample is represented by a dot, the middle line represents the median, and the upper and bottom line the standard deviation. (C) Dot plot of total cfDNA extracted from HERBY plasma samples. Each sample is represented by a dot, the middle line represents the median, and the upper and bottom line the standard deviation. (D) Dot plot of cfDNA concentration per mL from HERBY plasma samples. Each sample is represented by a dot, the middle line represents the median, and the upper and bottom line the standard deviation. (E) Dot plot of cfDNA concentration at baseline, separated by molecular subgroup. Each sample is represented by a dot, the middle line represents the median, and the upper and bottom line the standard deviation. (F) Electropherogram of cfDNA size distribution was obtained by using the TapeStation for a representative plasma sample with detectable levels of cfDNA (~170 bp). (G) Electropherogram of cfDNA size distribution was obtained by using the TapeStation for a representative plasma sample with a high degree of genomic DNA contamination (>55 kb). (H) Electropherogram of cfDNA size distribution obtained by using the TapeStation for a representative plasma sample with detectable cfDNA (182 bp) and genomic DNA (~6.7 kb) peaks. (I) Electropherogram of cfDNA size distribution obtained by using the TapeStation for a representative plasma sample with detectable DNA. The y-axis shows the signal intensity (FU) and the x-axis shows the DNA fragment size is represented in base pairs (bp).
Figure 4.
Figure 4.
Correlation of plasma cfDNA concentration and poor response in DMG-K27M. (A) HERBY032, diffuse midline glioma, WHO grade IV H3F3A_K27M mutant, event-free survival (EFS) of 5.5 months, overall survival (OS) of 16.4 months. cfDNA concentrations (y axis) plotted against time from randomization (days). Resections are marked with an X. Below, axial T2-weighted Fluid and Attenuation Inversion Recovery (FLAIR) MRI scans at different time-points of the patient’s disease, with white arrows highlighting an enlarging hyperintense abnormality at the cavity margins. The shaded box represents the initial 6-week treatment of RT/TMZ with bevacizumab. Subsequent to this, there were repeated cycles of TMZ every 28 days, and bevacizumab every 2 weeks, until the end-point. (B) HERBY096, diffuse midline glioma, WHO grade IV, H3F3A_K27M mutant, EFS of 4 months, OS of 8.7 months. cfDNA concentrations (y axis) plotted against time from randomization (days). Resections are marked with an X. Below, axial T2-weighted or T1 post-gadolinium MRI scans at different time-points of the patient’s disease, with white arrows highlighting a new focus of enhancement. The shaded box represents the initial 6-week treatment of RT/TMZ with bevacizumab. Subsequent to this, there were repeated cycles of TMZ every 28 days, and bevacizumab every 2 weeks, until the end-point.
Figure 5.
Figure 5.
Correlation of plasma cfDNA concentration and better outcome in hemispheric BRAF_V600E mutant GBM. (A) HERBY063, hemispheric glioblastoma, WHO grade IV, BRAF_V600E mutant, event-free survival (EFS) of 8 months, overall survival (OS) of 28.5 months. cfDNA concentrations (y axis) plotted against time from randomization (days). Resections are marked with an X. Below, axial T2-weighted or T1 post-gadolinium MRI scans at different time-points of the patient disease, with white arrow highlighting an increased T2 abnormality, and the black arrow showing the progressive enhancing tumor. The shaded box represents the initial 6-week treatment of RT/TMZ with bevacizumab. Subsequent to this, there were repeated cycles of TMZ every 28 days, and bevacizumab every 2 weeks, until the end-point. (B) HERBY078, hemispheric glioblastoma, WHO grade IV, BRAF_V600E mutant, EFS of 10 months, OS of 27.4 months. cfDNA concentrations (y axis) plotted against time from randomization (days). Resections are marked with an X. Below, axial T2-weighted MRI scans at different time-points of the patient disease, with white arrows highlighting a new parotid lesion, and the black arrow indicating the primary site recurrence. The shaded box represents the initial 6-week treatment of RT/TMZ. Subsequent to this, there were repeated cycles of TMZ every 28 days until the end-point.

References

    1. Ramkissoon SH, Bandopadhayay P, Hwang J, et al. Clinical targeted exome-based sequencing in combination with genome-wide copy number profiling: precision medicine analysis of 203 pediatric brain tumors. Neuro Oncol. 2017;19(7):986–996. - PMC - PubMed
    1. Koschmann C, Wu Y-M, Kumar-Sinha C, et al. Clinically integrated sequencing alters therapy in children and young adults with high-risk glial brain tumors. JCO Precision Oncol. 2018;(2):1–34. - PMC - PubMed
    1. Hamisch C, Kickingereder P, Fischer M, Simon T, Ruge MI. Update on the diagnostic value and safety of stereotactic biopsy for pediatric brainstem tumors: a systematic review and meta-analysis of 735 cases. J Neurosurg Pediatr. 2017;20(3):261–268. - PubMed
    1. Gupta N, Goumnerova LC, Manley P, et al. Prospective feasibility and safety assessment of surgical biopsy for patients with newly diagnosed diffuse intrinsic pontine glioma. Neuro oncol. 2018;20(11):1547–1555. - PMC - PubMed
    1. Akshulakov SK, Kerimbayev TT, Biryuchkov MY, Urunbayev YA, Farhadi DS, Byvaltsev VA. Current trends for improving safety of stereotactic brain biopsies: advanced optical methods for vessel avoidance and tumor detection. Front Oncol. 2019;9:947. - PMC - PubMed

LinkOut - more resources